Schematic overview of the cellular and molecular mechanisms involved in the cancer progression, including the proposed cellular and molecular mechanisms in cancer cells trajectory. AT1: alveolar type 1 cells; AT2: alveolar type 2 cells; AAH: atypical adenomatous hyperplasia; AIS: adenocarcinoma in situ; MIA: minimally invasive adenocarcinoma; IA: invasive adenocarcinoma; EMT: epithelial-mesenchymal transition

Home

Download

Statistics

Help

Contact

Center for Computational Systems Medicine
leaf

Gene summary

leaf

Malignant transformation analysis

leaf

Malignant transformation related pathway analysis

leaf

Cell-cell communication analysis

leaf

Single-cell gene regulatory network inference analysis

leaf

Somatic mutation of malignant transformation related genes

leaf

Related drugs of malignant transformation related genes

Gene: CIB1

Gene summary for CIB1

check button Gene summary.

Gene informationSpeciesHuman
Gene symbol

CIB1

Gene ID

10519

Gene namecalcium and integrin binding 1
Gene AliasCIB
Cytomap15q26.1
Gene Typeprotein-coding
GO ID

GO:0000003

UniProtAcc

Q99828


Top

Malignant transformation analysis

check button Identification of the aberrant gene expression in precancerous and cancerous lesions by comparing the gene expression of stem-like cells in diseased tissues with normal stem cells
check button Malignant transformation involving gene list.
Entrez IDSymbolReplicatesSpeciesOrganTissueAdj P-valueLog2FCMalignancy
10519CIB1GSM4909282HumanBreastIDC2.43e-154.63e-01-0.0288
10519CIB1GSM4909286HumanBreastIDC4.79e-06-3.36e-010.1081
10519CIB1GSM4909290HumanBreastIDC6.75e-033.10e-010.2096
10519CIB1GSM4909291HumanBreastIDC1.51e-095.04e-010.1753
10519CIB1GSM4909293HumanBreastIDC3.12e-031.72e-010.1581
10519CIB1GSM4909294HumanBreastIDC3.34e-032.40e-010.2022
10519CIB1GSM4909296HumanBreastIDC4.88e-082.47e-010.1524
10519CIB1GSM4909297HumanBreastIDC4.39e-09-2.56e-010.1517
10519CIB1GSM4909304HumanBreastIDC5.91e-678.85e-010.1636
10519CIB1GSM4909306HumanBreastIDC1.25e-073.58e-010.1564
10519CIB1GSM4909307HumanBreastIDC1.96e-053.44e-010.1569
10519CIB1GSM4909308HumanBreastIDC1.94e-113.65e-010.158
10519CIB1GSM4909311HumanBreastIDC2.56e-24-1.47e-010.1534
10519CIB1GSM4909312HumanBreastIDC1.08e-041.25e-040.1552
10519CIB1GSM4909315HumanBreastIDC2.32e-103.85e-010.21
10519CIB1GSM4909319HumanBreastIDC5.11e-30-3.06e-010.1563
10519CIB1GSM4909321HumanBreastIDC2.20e-131.74e-010.1559
10519CIB1ctrl6HumanBreastPrecancer7.31e-126.43e-01-0.0061
10519CIB1brca2HumanBreastPrecancer1.05e-245.10e-01-0.024
10519CIB1brca3HumanBreastPrecancer4.76e-113.63e-01-0.0263
Page: 1 2 3 4 5 6 7 8 9 10 11 12 

check button Transcriptomic changes along malignancy continuum.
TissueExpression DynamicsAbbreviation
BreastThe image shows the transcriptomic changes along malignancy continuum.log2FC in expression of this searched gene in stem-like cells from each diseased tissue sample relative to stem-like cells in normal samples in each tissue plotted against the malignancy continuum. Samples are colored based on if they are from different disease stage.IDC: Invasive ductal carcinoma
DCIS: Ductal carcinoma in situ
Precancer(BRCA1-mut): Precancerous lesion from BRCA1 mutation carriers
CervixThe image shows the transcriptomic changes along malignancy continuum.log2FC in expression of this searched gene in stem-like cells from each diseased tissue sample relative to stem-like cells in normal samples in each tissue plotted against the malignancy continuum. Samples are colored based on if they are from different disease stage.CC: Cervix cancer
HSIL_HPV: HPV-infected high-grade squamous intraepithelial lesions
N_HPV: HPV-infected normal cervix
Colorectum (GSE201348)The image shows the transcriptomic changes along malignancy continuum.log2FC in expression of this searched gene in stem-like cells from each diseased tissue sample relative to stem-like cells in normal samples in each tissue plotted against the malignancy continuum. Samples are colored based on if they are from different disease stage.FAP: Familial adenomatous polyposis
CRC: Colorectal cancer
Colorectum (HTA11)The image shows the transcriptomic changes along malignancy continuum.log2FC in expression of this searched gene in stem-like cells from each diseased tissue sample relative to stem-like cells in normal samples in each tissue plotted against the malignancy continuum. Samples are colored based on if they are from different disease stage.AD: Adenomas
SER: Sessile serrated lesions
MSI-H: Microsatellite-high colorectal cancer
MSS: Microsatellite stable colorectal cancer
EndometriumThe image shows the transcriptomic changes along malignancy continuum.log2FC in expression of this searched gene in stem-like cells from each diseased tissue sample relative to stem-like cells in normal samples in each tissue plotted against the malignancy continuum. Samples are colored based on if they are from different disease stage.
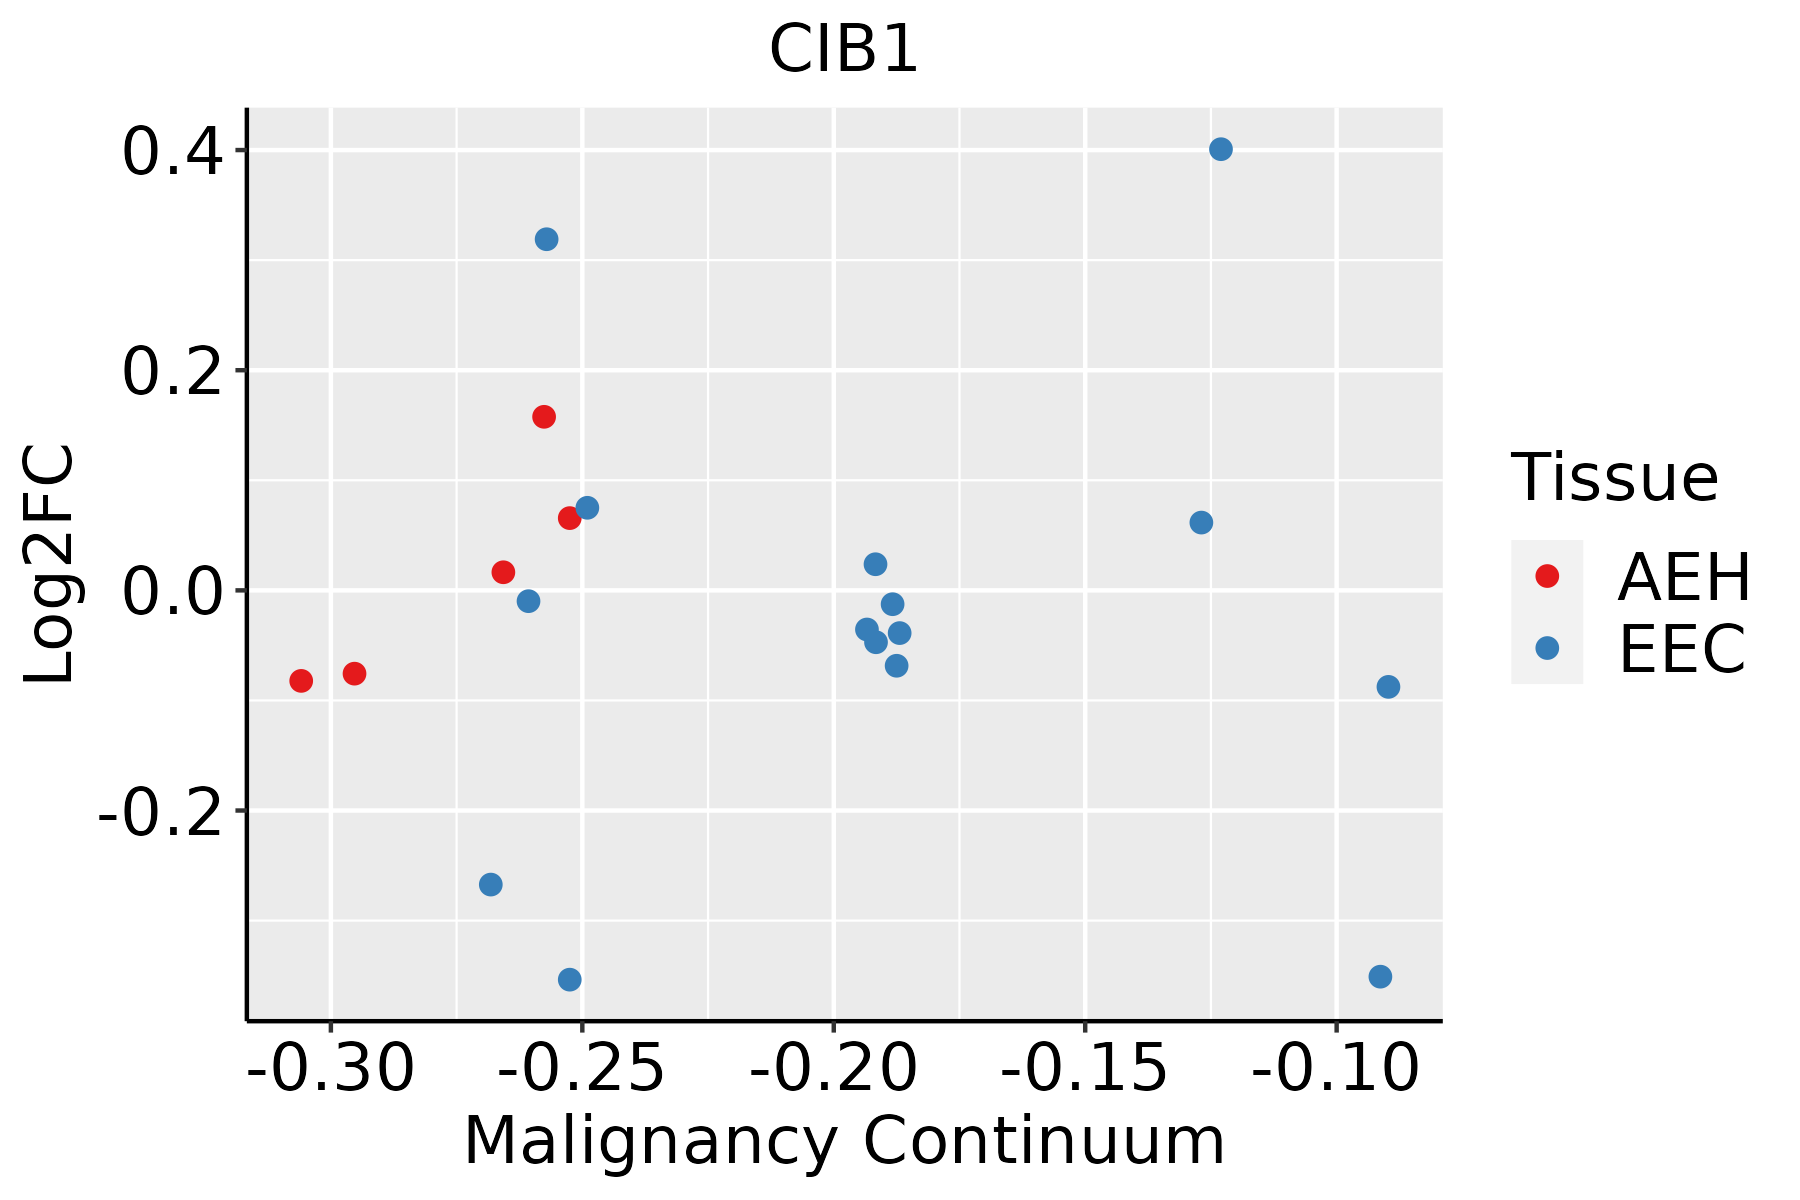
AEH: Atypical endometrial hyperplasia
EEC: Endometrioid Cancer
EsophagusThe image shows the transcriptomic changes along malignancy continuum.log2FC in expression of this searched gene in stem-like cells from each diseased tissue sample relative to stem-like cells in normal samples in each tissue plotted against the malignancy continuum. Samples are colored based on if they are from different disease stage.ESCC: Esophageal squamous cell carcinoma
HGIN: High-grade intraepithelial neoplasias
LGIN: Low-grade intraepithelial neoplasias
LiverThe image shows the transcriptomic changes along malignancy continuum.log2FC in expression of this searched gene in stem-like cells from each diseased tissue sample relative to stem-like cells in normal samples in each tissue plotted against the malignancy continuum. Samples are colored based on if they are from different disease stage.
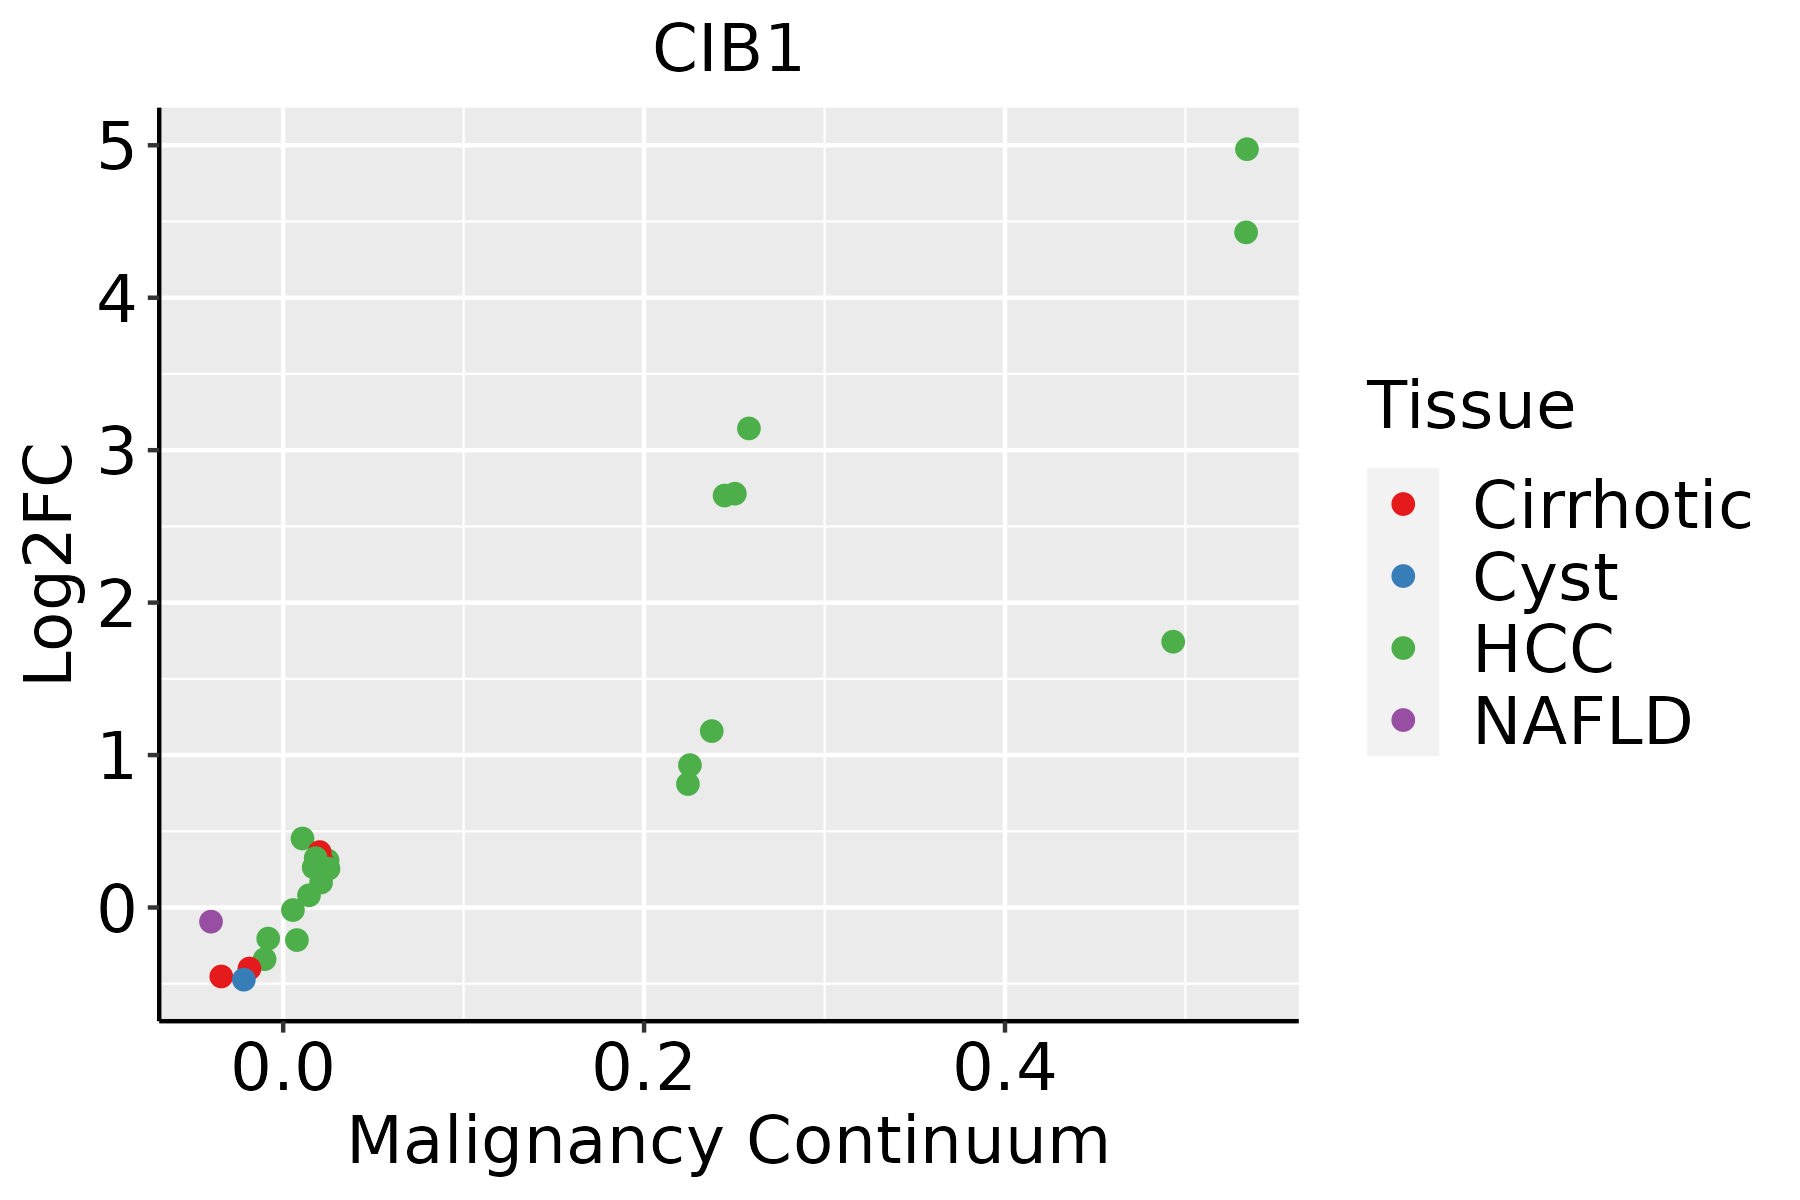
HCC: Hepatocellular carcinoma
NAFLD: Non-alcoholic fatty liver disease
Oral CavityThe image shows the transcriptomic changes along malignancy continuum.log2FC in expression of this searched gene in stem-like cells from each diseased tissue sample relative to stem-like cells in normal samples in each tissue plotted against the malignancy continuum. Samples are colored based on if they are from different disease stage.EOLP: Erosive Oral lichen planus
LP: leukoplakia
NEOLP: Non-erosive oral lichen planus
OSCC: Oral squamous cell carcinoma
ProstateThe image shows the transcriptomic changes along malignancy continuum.log2FC in expression of this searched gene in stem-like cells from each diseased tissue sample relative to stem-like cells in normal samples in each tissue plotted against the malignancy continuum. Samples are colored based on if they are from different disease stage.
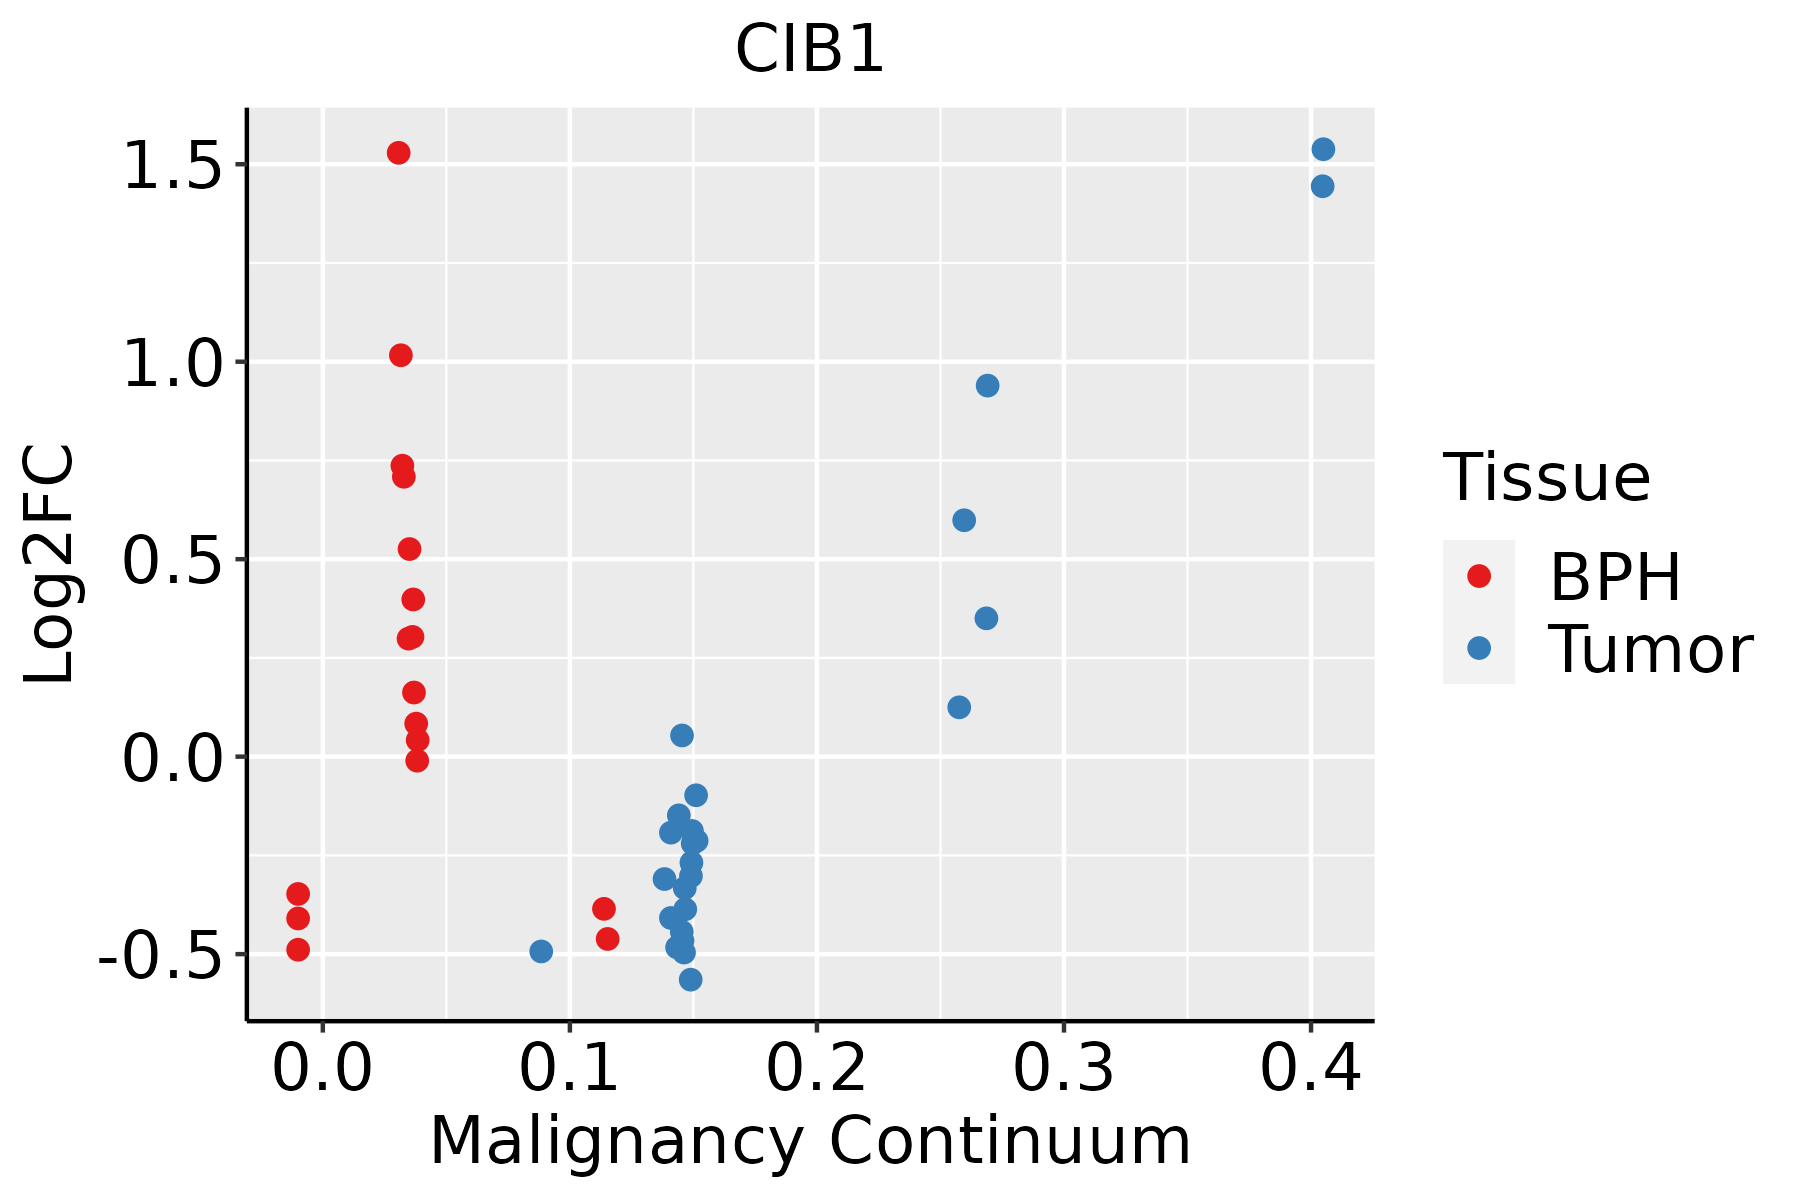
BPH: Benign Prostatic Hyperplasia
SkinThe image shows the transcriptomic changes along malignancy continuum.log2FC in expression of this searched gene in stem-like cells from each diseased tissue sample relative to stem-like cells in normal samples in each tissue plotted against the malignancy continuum. Samples are colored based on if they are from different disease stage.
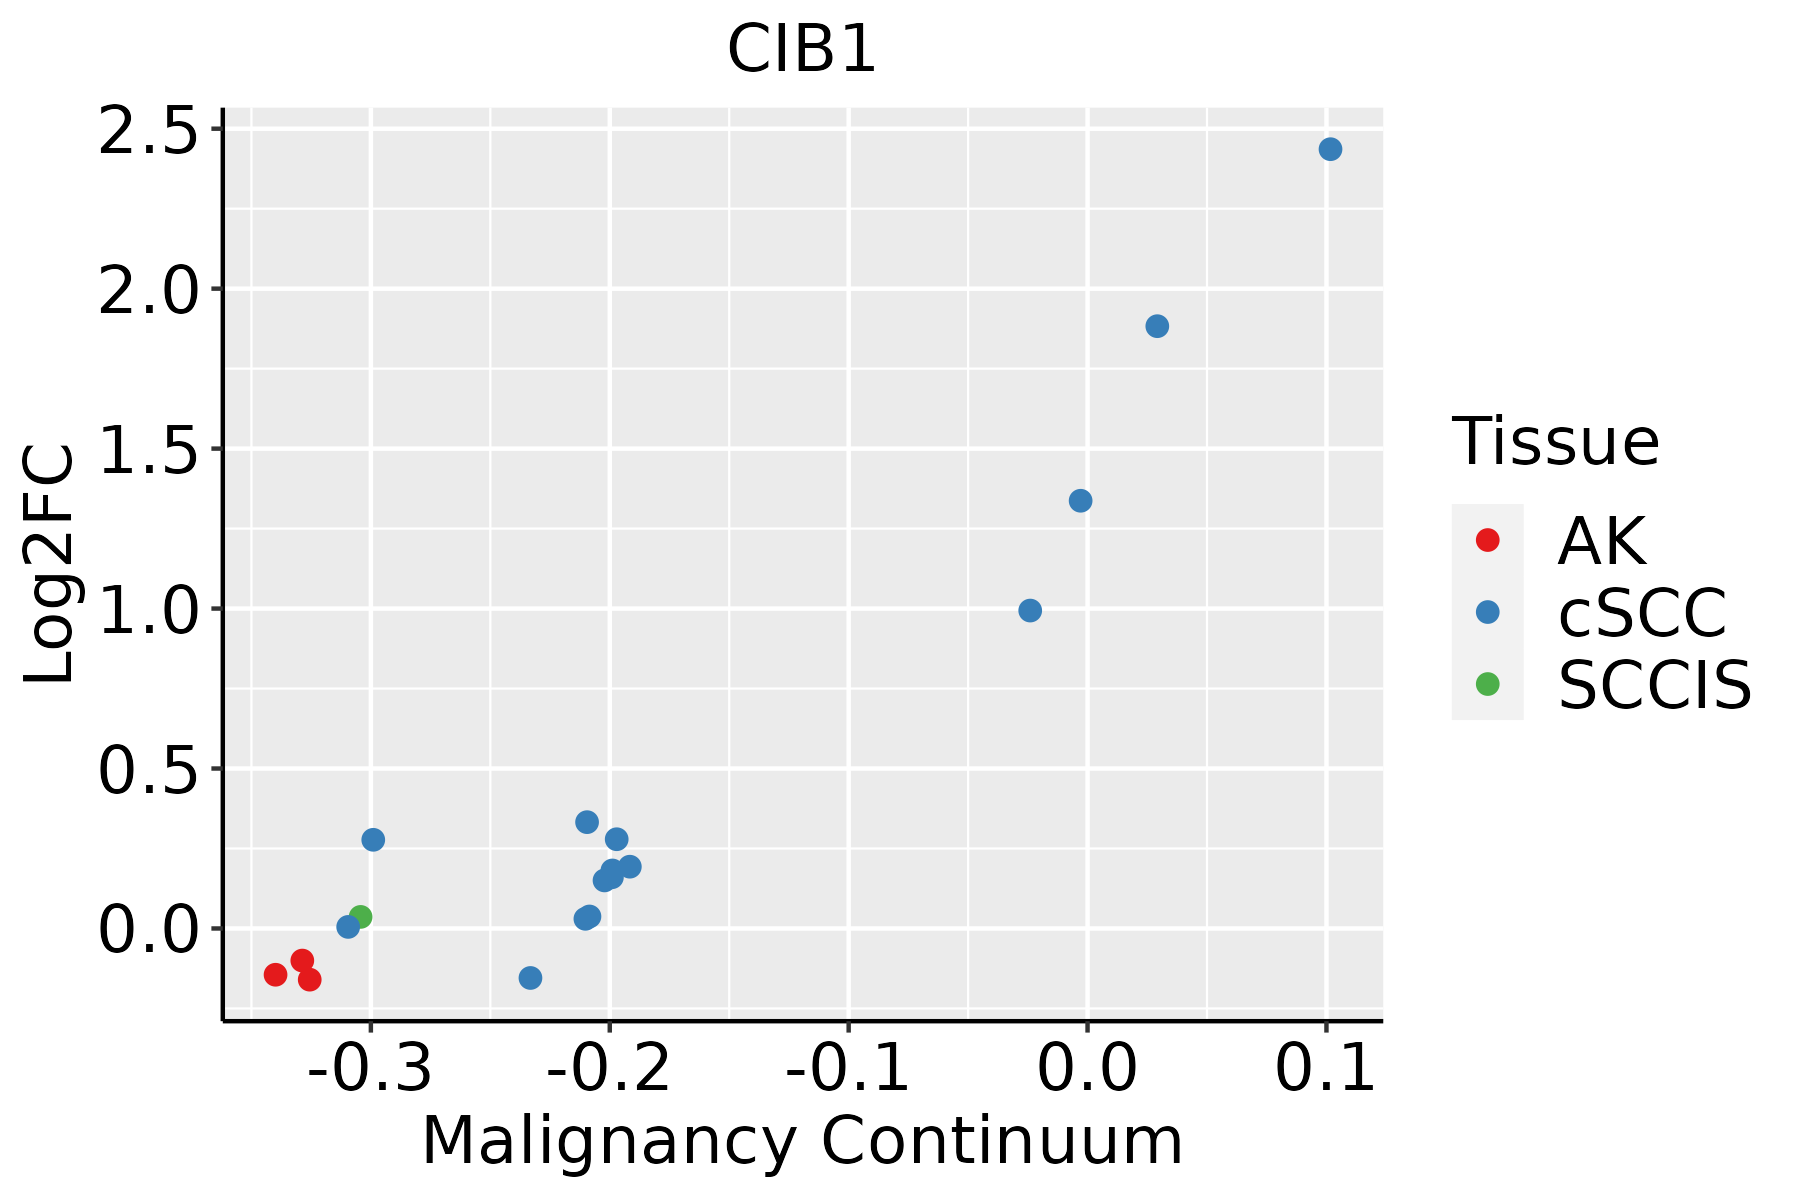
AK: Actinic keratosis
cSCC: Cutaneous squamous cell carcinoma
SCCIS:squamous cell carcinoma in situ
ThyroidThe image shows the transcriptomic changes along malignancy continuum.log2FC in expression of this searched gene in stem-like cells from each diseased tissue sample relative to stem-like cells in normal samples in each tissue plotted against the malignancy continuum. Samples are colored based on if they are from different disease stage.ATC: Anaplastic thyroid cancer
HT: Hashimoto's thyroiditis
PTC: Papillary thyroid cancer
∗log2FC in expression of this searched gene in stem-like cells from each diseased tissue sample relative to stem-like cells in normal samples in each tissue plotted against the malignancy continuum. Samples are colored based on if they are from different disease stage.

Top

Malignant transformation related pathway analysis

check buttonFind out the enriched GO biological processes and KEGG pathways involved in transition from healthy to precancer to cancer
check button Figure of enriched GO biological processes.
TissueDisease StageEnriched GO biological Processes
ColorectumADGO analysis - Figure of enriched GO biological processes: Top 15 enriched GO BP terms are showed in the bar plot of each disease state in each tissue. Each row represents a significant GO biological process which is colored according to the -log10(p.adjust).
ColorectumSERGO analysis - Figure of enriched GO biological processes: Top 15 enriched GO BP terms are showed in the bar plot of each disease state in each tissue. Each row represents a significant GO biological process which is colored according to the -log10(p.adjust).
ColorectumMSSGO analysis - Figure of enriched GO biological processes: Top 15 enriched GO BP terms are showed in the bar plot of each disease state in each tissue. Each row represents a significant GO biological process which is colored according to the -log10(p.adjust).
ColorectumMSI-HGO analysis - Figure of enriched GO biological processes: Top 15 enriched GO BP terms are showed in the bar plot of each disease state in each tissue. Each row represents a significant GO biological process which is colored according to the -log10(p.adjust).
ColorectumFAPGO analysis - Figure of enriched GO biological processes: Top 15 enriched GO BP terms are showed in the bar plot of each disease state in each tissue. Each row represents a significant GO biological process which is colored according to the -log10(p.adjust).
∗Top 15 enriched GO BP terms are showed in the bar plot of each disease state in each tissue. Each row represents a significant GO biological process which is colored according to the -log10(p.adjust).
Page: 1 2 3 4 5 6 7 8 9 

check button Enriched GO biological processes.
GO IDTissueDisease StageDescriptionGene RatioBg Ratiopvaluep.adjustCount
GO:00435427CervixCCendothelial cell migration60/2311279/187231.05e-052.33e-0460
GO:004232610CervixCCnegative regulation of phosphorylation77/2311385/187231.09e-052.38e-0477
GO:00160498CervixCCcell growth92/2311482/187231.16e-052.49e-0492
GO:00105944CervixCCregulation of endothelial cell migration52/2311232/187231.20e-052.54e-0452
GO:004563710CervixCCregulation of myeloid cell differentiation48/2311210/187231.49e-052.93e-0448
GO:00346129CervixCCresponse to tumor necrosis factor55/2311253/187231.75e-053.32e-0455
GO:00713569CervixCCcellular response to tumor necrosis factor51/2311229/187231.75e-053.32e-0451
GO:00719025CervixCCpositive regulation of protein serine/threonine kinase activity46/2311200/187231.87e-053.47e-0446
GO:19054778CervixCCpositive regulation of protein localization to membrane29/2311106/187232.29e-054.01e-0429
GO:000193310CervixCCnegative regulation of protein phosphorylation69/2311342/187232.29e-054.01e-0469
GO:19029048CervixCCnegative regulation of supramolecular fiber organization40/2311167/187232.39e-054.17e-0440
GO:00323889CervixCCpositive regulation of intracellular transport46/2311202/187232.45e-054.24e-0446
GO:00434104CervixCCpositive regulation of MAPK cascade90/2311480/187232.92e-054.83e-0490
GO:00107708CervixCCpositive regulation of cell morphogenesis involved in differentiation23/231179/187235.44e-058.04e-0423
GO:002241110CervixCCcellular component disassembly83/2311443/187236.04e-058.68e-0483
GO:19000269CervixCCpositive regulation of substrate adhesion-dependent cell spreading15/231141/187236.11e-058.76e-0415
GO:00106399CervixCCnegative regulation of organelle organization68/2311348/187237.40e-051.03e-0368
GO:00901509CervixCCestablishment of protein localization to membrane54/2311260/187237.67e-051.05e-0354
GO:19030768CervixCCregulation of protein localization to plasma membrane27/2311104/187231.15e-041.44e-0327
GO:00459277CervixCCpositive regulation of growth53/2311259/187231.33e-041.64e-0353
Page: 1 2 3 4 5 6 7 8 9 10 11 12 13 14 15 16 17 18 19 20 21 22 23 24 25 26 27 28 29 30 31 32 33 34 35 36 37 38 39 40 41 42 43 44 45 46 47 48 49 50 51 52 53 54 55 56 57 58 59 60 61 62 63 64 65 66 67 68 69 70 71 72 73 74 75 

check button Enriched KEGG pathways.
Pathway IDTissueDisease StageDescriptionGene RatioBg Ratiopvaluep.adjustqvalueCount
Page: 1 

Top

Cell-cell communication analysis

check buttonIdentification of potential cell-cell interactions between two cell types and their ligand-receptor pairs for different disease states
LigandReceptorLRpairPathwayTissueDisease Stage
Page: 1 

Top

Single-cell gene regulatory network inference analysis

check buttonFind out the significant the regulons (TFs) and the target genes of each regulon across cell types for different disease states
TFCell TypeTissueDisease StageTarget GeneRSSRegulon Activity
∗The dot plots of a searched regulon are shown for all cell subpopulations in each disease state of each tissue based on the regulon specific score inferred using pySCENIC and by calculating the average expression.
Page: 1 

Top

Somatic mutation of malignant transformation related genes

check buttonAnnotation of somatic variants for genes involved in malignant transformation
Hugo SymbolVariant ClassVariant ClassificationdbSNP RSHGVScHGVSpHGVSp ShortSWISSPROTBIOTYPESIFTPolyPhenTumor Sample BarcodeTissueHistologySexAgeStageTherapy TypesDrugsOutcome
CIB1insertionFrame_Shift_Insnovelc.258_259insGAGCGTGGAGp.Ser87GlufsTer44p.S87Efs*44Q99828protein_codingTCGA-A2-A0EQ-01Breastbreast invasive carcinomaFemale<65I/IIChemotherapyadriamycinSD
CIB1SNVMissense_Mutationc.43N>Ap.Glu15Lysp.E15KQ99828protein_codingdeleterious(0.03)possibly_damaging(0.551)TCGA-C5-A7CK-01Cervixcervical & endocervical cancerFemale<65I/IIChemotherapycisplatinSD
CIB1SNVMissense_Mutationrs771152399c.686N>Cp.Ile229Thrp.I229TQ99828protein_codingdeleterious(0)probably_damaging(0.979)TCGA-AA-3811-01Colorectumcolon adenocarcinomaFemale>=65III/IVUnknownUnknownPD
CIB1SNVMissense_Mutationnovelc.665N>Gp.Asp222Glyp.D222GQ99828protein_codingdeleterious(0)probably_damaging(0.997)TCGA-A5-A0G2-01Endometriumuterine corpus endometrioid carcinomaFemale<65III/IVUnknownUnknownSD
CIB1SNVMissense_Mutationnovelc.82N>Ap.Leu28Ilep.L28IQ99828protein_codingtolerated(0.11)benign(0.065)TCGA-AX-A2HD-01Endometriumuterine corpus endometrioid carcinomaFemale>=65III/IVUnknownUnknownSD
CIB1SNVMissense_Mutationc.581N>Gp.Asp194Glyp.D194GQ99828protein_codingtolerated(0.09)benign(0.071)TCGA-B5-A11G-01Endometriumuterine corpus endometrioid carcinomaFemale>=65I/IIUnknownUnknownSD
CIB1SNVMissense_Mutationrs145803459c.656N>Ap.Arg219Hisp.R219HQ99828protein_codingdeleterious(0)probably_damaging(0.961)TCGA-BG-A220-01Endometriumuterine corpus endometrioid carcinomaFemale>=65I/IIUnknownUnknownSD
CIB1SNVMissense_Mutationnovelc.248G>Tp.Arg83Leup.R83LQ99828protein_codingtolerated(0.14)benign(0.168)TCGA-DF-A2KY-01Endometriumuterine corpus endometrioid carcinomaFemale<65III/IVChemotherapycarboplatinSD
CIB1SNVMissense_Mutationc.686T>Gp.Ile229Serp.I229SQ99828protein_codingdeleterious(0)probably_damaging(0.991)TCGA-G3-A3CK-01Liverliver hepatocellular carcinomaMale<65I/IIUnknownUnknownSD
CIB1SNVMissense_Mutationrs765061684c.538N>Ap.Glu180Lysp.E180KQ99828protein_codingtolerated(0.1)benign(0.216)TCGA-39-5031-01Lunglung squamous cell carcinomaFemale>=65I/IIUnknownUnknownSD
Page: 1 2 

Top

Related drugs of malignant transformation related genes

check buttonIdentification of chemicals and drugs interact with genes involved in malignant transfromation
(DGIdb 4.0)
Entrez IDSymbolCategoryInteraction TypesDrug Claim NameDrug NamePMIDs
Page: 1