
|
|||||
|
 | |
| |
| |
| |
| |
| |
|
Gene: CDH2 |
Gene summary for CDH2 |
| Gene information | Species | Human | Gene symbol | CDH2 | Gene ID | 1000 |
| Gene name | cadherin 2 | |
| Gene Alias | ACOGS | |
| Cytomap | 18q12.1 | |
| Gene Type | protein-coding | GO ID | GO:0000165 | UniProtAcc | P19022 |
Top |
Malignant transformation analysis |
| Identification of the aberrant gene expression in precancerous and cancerous lesions by comparing the gene expression of stem-like cells in diseased tissues with normal stem cells |
| Entrez ID | Symbol | Replicates | Species | Organ | Tissue | Adj P-value | Log2FC | Malignancy |
| 1000 | CDH2 | P10T-E | Human | Esophagus | ESCC | 1.13e-16 | 3.21e-01 | 0.116 |
| 1000 | CDH2 | P11T-E | Human | Esophagus | ESCC | 2.06e-07 | 4.78e-01 | 0.1426 |
| 1000 | CDH2 | P19T-E | Human | Esophagus | ESCC | 2.95e-08 | 6.23e-01 | 0.1662 |
| 1000 | CDH2 | P24T-E | Human | Esophagus | ESCC | 1.88e-04 | 3.06e-01 | 0.1287 |
| 1000 | CDH2 | P32T-E | Human | Esophagus | ESCC | 2.41e-29 | 5.86e-01 | 0.1666 |
| 1000 | CDH2 | P37T-E | Human | Esophagus | ESCC | 2.88e-04 | 1.59e-01 | 0.1371 |
| 1000 | CDH2 | P61T-E | Human | Esophagus | ESCC | 1.19e-12 | 4.20e-01 | 0.099 |
| 1000 | CDH2 | P76T-E | Human | Esophagus | ESCC | 1.66e-02 | 1.43e-01 | 0.1207 |
| 1000 | CDH2 | P107T-E | Human | Esophagus | ESCC | 2.29e-02 | 1.58e-01 | 0.171 |
| 1000 | CDH2 | NAFLD1 | Human | Liver | NAFLD | 6.04e-06 | 6.20e-01 | -0.04 |
| 1000 | CDH2 | S41 | Human | Liver | Cirrhotic | 2.25e-02 | 6.33e-01 | -0.0343 |
| 1000 | CDH2 | S43 | Human | Liver | Cirrhotic | 3.41e-19 | -2.03e-02 | -0.0187 |
| 1000 | CDH2 | HCC1_Meng | Human | Liver | HCC | 4.65e-83 | 5.94e-02 | 0.0246 |
| 1000 | CDH2 | HCC2_Meng | Human | Liver | HCC | 2.37e-21 | -4.21e-01 | 0.0107 |
| 1000 | CDH2 | cirrhotic1 | Human | Liver | Cirrhotic | 2.96e-04 | -1.45e-01 | 0.0202 |
| 1000 | CDH2 | cirrhotic2 | Human | Liver | Cirrhotic | 3.59e-09 | 1.91e-01 | 0.0201 |
| 1000 | CDH2 | cirrhotic3 | Human | Liver | Cirrhotic | 3.23e-06 | -1.61e-01 | 0.0215 |
| 1000 | CDH2 | HCC1 | Human | Liver | HCC | 4.03e-07 | 3.95e+00 | 0.5336 |
| 1000 | CDH2 | HCC2 | Human | Liver | HCC | 9.19e-11 | 4.04e+00 | 0.5341 |
| 1000 | CDH2 | HCC5 | Human | Liver | HCC | 9.05e-07 | 5.63e-01 | 0.4932 |
| Page: 1 2 |
| Tissue | Expression Dynamics | Abbreviation |
| Esophagus |  | ESCC: Esophageal squamous cell carcinoma |
| HGIN: High-grade intraepithelial neoplasias | ||
| LGIN: Low-grade intraepithelial neoplasias | ||
| Liver | 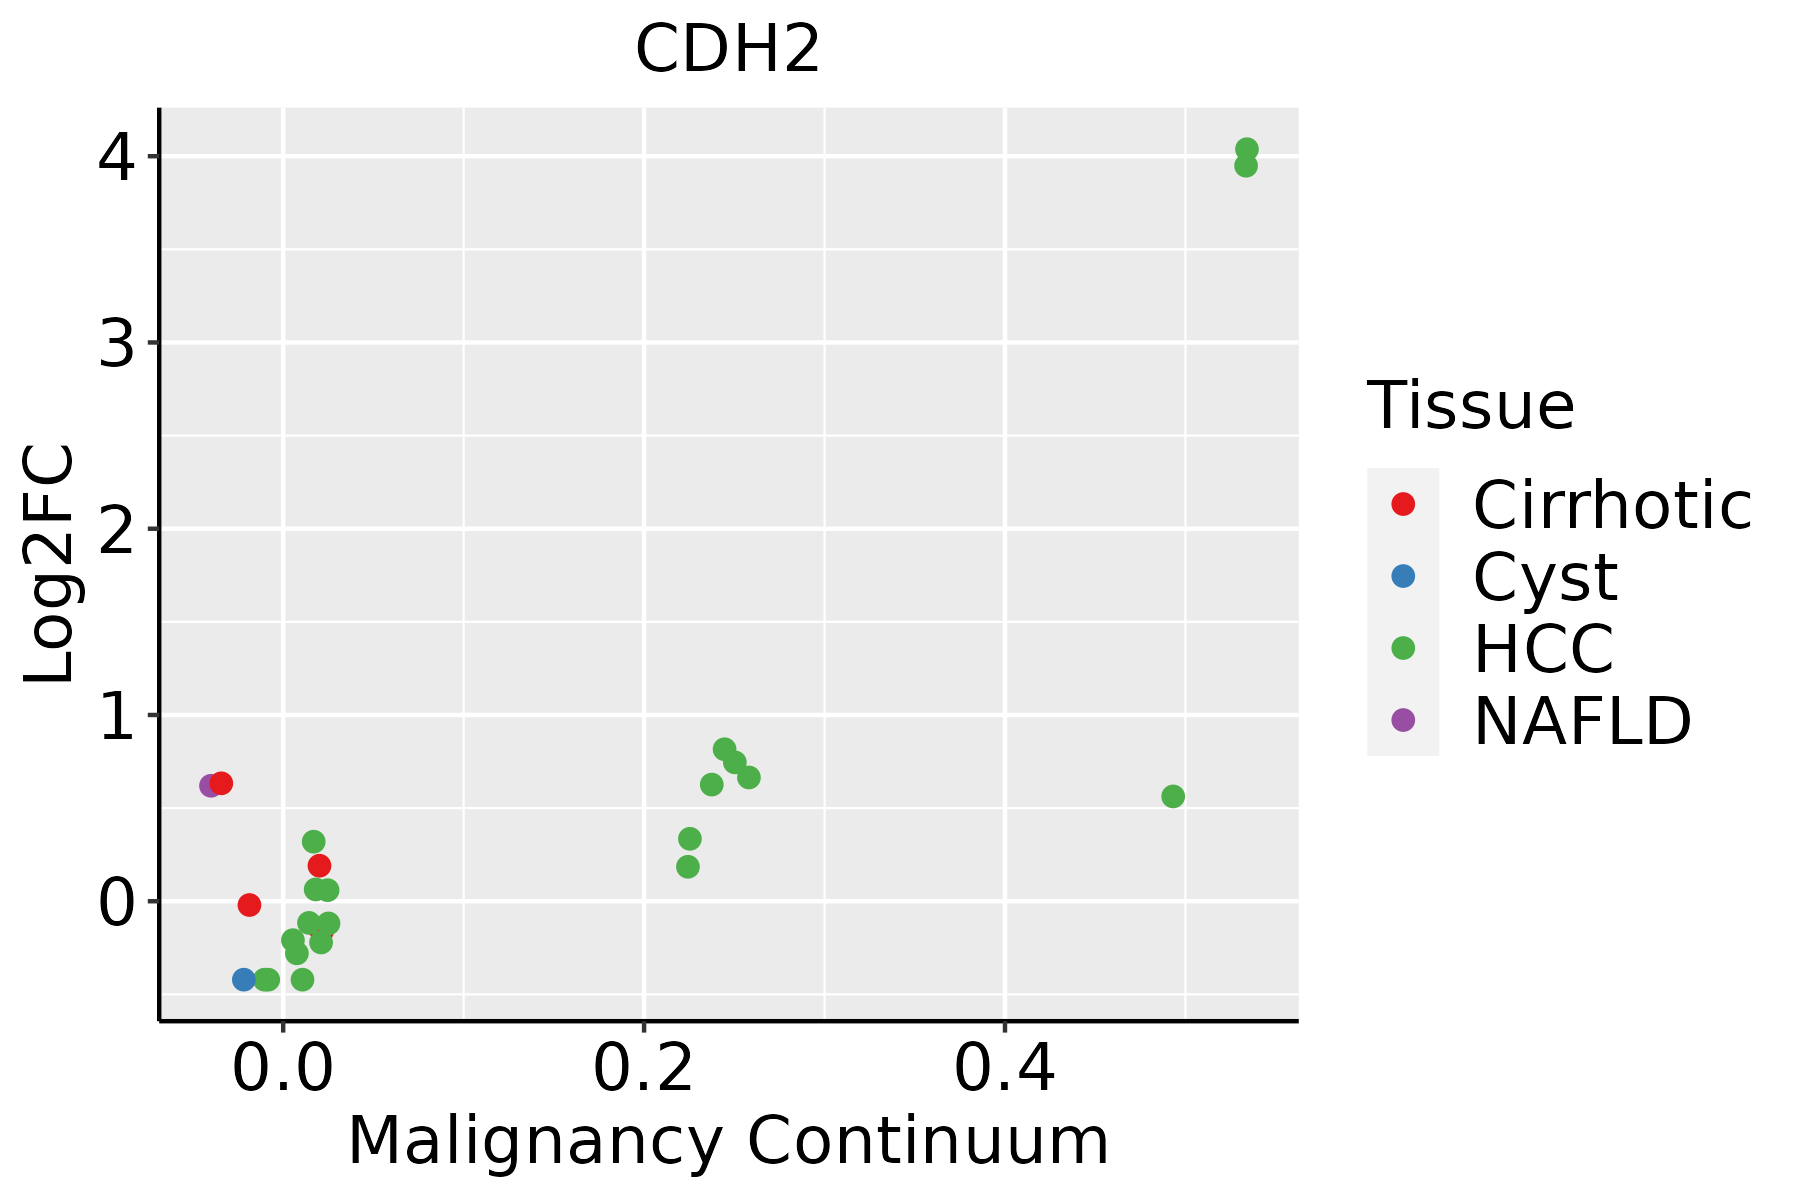 | HCC: Hepatocellular carcinoma |
| NAFLD: Non-alcoholic fatty liver disease | ||
| Thyroid | 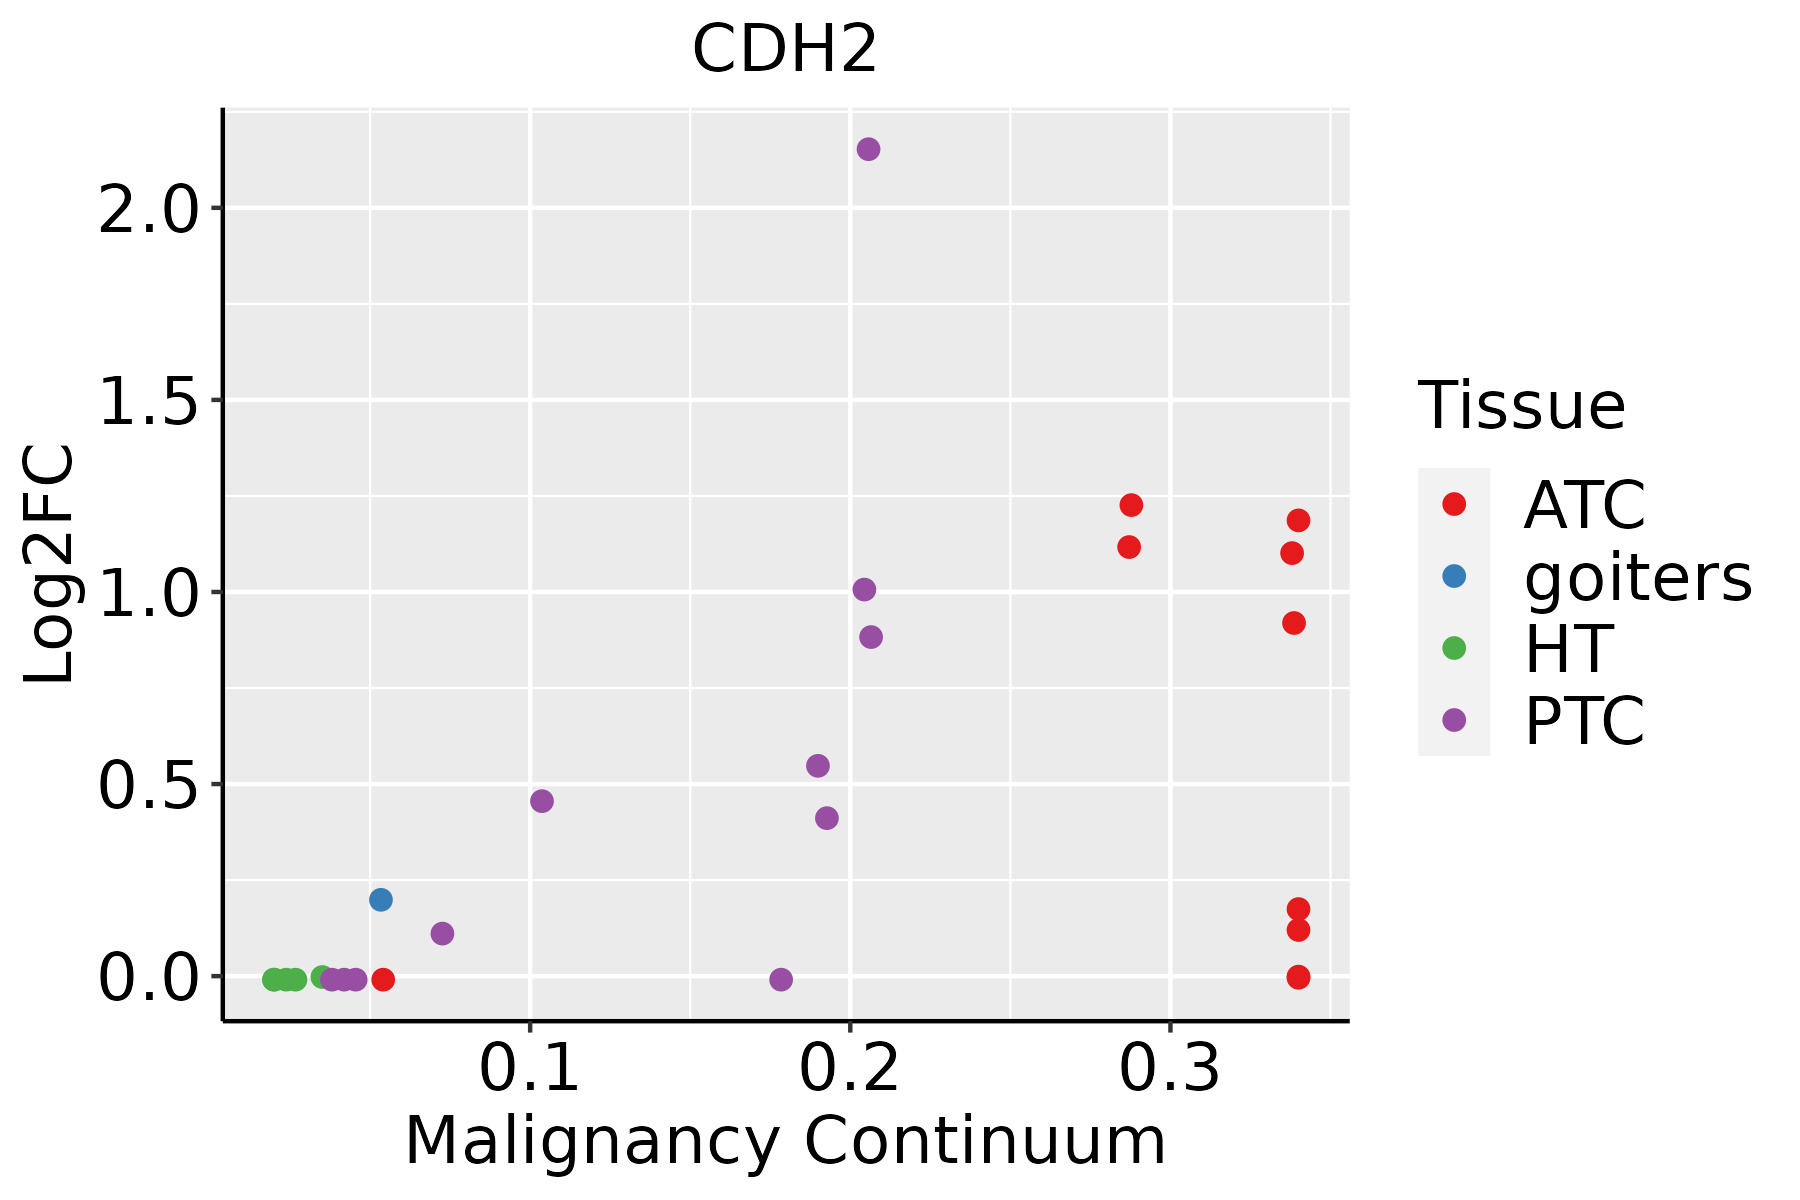 | ATC: Anaplastic thyroid cancer |
| HT: Hashimoto's thyroiditis | ||
| PTC: Papillary thyroid cancer |
| ∗log2FC in expression of this searched gene in stem-like cells from each diseased tissue sample relative to stem-like cells in normal samples in each tissue plotted against the malignancy continuum. Samples are colored based on if they are from different disease stage. |
Top |
Malignant transformation related pathway analysis |
| Find out the enriched GO biological processes and KEGG pathways involved in transition from healthy to precancer to cancer |
| Tissue | Disease Stage | Enriched GO biological Processes |
| Colorectum | AD |  |
| Colorectum | SER |  |
| Colorectum | MSS |  |
| Colorectum | MSI-H |  |
| Colorectum | FAP |  |
| ∗Top 15 enriched GO BP terms are showed in the bar plot of each disease state in each tissue. Each row represents a significant GO biological process which is colored according to the -log10(p.adjust). |
| Page: 1 2 3 4 5 6 7 8 9 |
| GO ID | Tissue | Disease Stage | Description | Gene Ratio | Bg Ratio | pvalue | p.adjust | Count |
| GO:000206428 | Thyroid | ATC | epithelial cell development | 103/6293 | 220/18723 | 3.06e-05 | 2.55e-04 | 103 |
| GO:007170915 | Thyroid | ATC | membrane assembly | 31/6293 | 50/18723 | 3.66e-05 | 2.99e-04 | 31 |
| GO:004886321 | Thyroid | ATC | stem cell differentiation | 97/6293 | 206/18723 | 3.88e-05 | 3.15e-04 | 97 |
| GO:003090015 | Thyroid | ATC | forebrain development | 164/6293 | 379/18723 | 4.85e-05 | 3.87e-04 | 164 |
| GO:002153712 | Thyroid | ATC | telencephalon development | 113/6293 | 248/18723 | 5.61e-05 | 4.32e-04 | 113 |
| GO:004269216 | Thyroid | ATC | muscle cell differentiation | 165/6293 | 384/18723 | 7.17e-05 | 5.46e-04 | 165 |
| GO:002154312 | Thyroid | ATC | pallium development | 81/6293 | 169/18723 | 7.67e-05 | 5.80e-04 | 81 |
| GO:000704324 | Thyroid | ATC | cell-cell junction assembly | 70/6293 | 146/18723 | 2.24e-04 | 1.46e-03 | 70 |
| GO:009009014 | Thyroid | ATC | negative regulation of canonical Wnt signaling pathway | 66/6293 | 137/18723 | 2.82e-04 | 1.80e-03 | 66 |
| GO:009917314 | Thyroid | ATC | postsynapse organization | 78/6293 | 168/18723 | 3.66e-04 | 2.26e-03 | 78 |
| GO:002198722 | Thyroid | ATC | cerebral cortex development | 55/6293 | 114/18723 | 8.32e-04 | 4.57e-03 | 55 |
| GO:004206323 | Thyroid | ATC | gliogenesis | 127/6293 | 301/18723 | 1.07e-03 | 5.66e-03 | 127 |
| GO:005114617 | Thyroid | ATC | striated muscle cell differentiation | 119/6293 | 283/18723 | 1.74e-03 | 8.70e-03 | 119 |
| GO:009917512 | Thyroid | ATC | regulation of postsynapse organization | 44/6293 | 90/18723 | 1.89e-03 | 9.27e-03 | 44 |
| GO:00359946 | Thyroid | ATC | response to muscle stretch | 15/6293 | 23/18723 | 1.91e-03 | 9.33e-03 | 15 |
| GO:005080712 | Thyroid | ATC | regulation of synapse organization | 87/6293 | 211/18723 | 1.20e-02 | 4.27e-02 | 87 |
| GO:0043113 | Thyroid | ATC | receptor clustering | 26/6293 | 53/18723 | 1.42e-02 | 4.91e-02 | 26 |
| Page: 1 2 3 4 5 6 7 8 9 |
| Pathway ID | Tissue | Disease Stage | Description | Gene Ratio | Bg Ratio | pvalue | p.adjust | qvalue | Count |
| Page: 1 |
Top |
Cell-cell communication analysis |
| Identification of potential cell-cell interactions between two cell types and their ligand-receptor pairs for different disease states |
| Ligand | Receptor | LRpair | Pathway | Tissue | Disease Stage |
| CDH2 | CDH2 | CDH2_CDH2 | CDH | CRC | FAP |
| CDH2 | CDH2 | CDH2_CDH2 | CDH | Endometrium | ADJ |
| CDH2 | CDH2 | CDH2_CDH2 | CDH | GC | ADJ |
| CDH2 | CDH2 | CDH2_CDH2 | CDH | Liver | HCC |
| CDH2 | CDH2 | CDH2_CDH2 | CDH | Liver | Healthy |
| CDH2 | CDH2 | CDH2_CDH2 | CDH | Liver | Precancer |
| CDH2 | CDH2 | CDH2_CDH2 | CDH | THCA | PTC |
| Page: 1 |
Top |
Single-cell gene regulatory network inference analysis |
| Find out the significant the regulons (TFs) and the target genes of each regulon across cell types for different disease states |
| TF | Cell Type | Tissue | Disease Stage | Target Gene | RSS | Regulon Activity |
| ∗The dot plots of a searched regulon are shown for all cell subpopulations in each disease state of each tissue based on the regulon specific score inferred using pySCENIC and by calculating the average expression. |
| Page: 1 |
Top |
Somatic mutation of malignant transformation related genes |
| Annotation of somatic variants for genes involved in malignant transformation |
| Hugo Symbol | Variant Class | Variant Classification | dbSNP RS | HGVSc | HGVSp | HGVSp Short | SWISSPROT | BIOTYPE | SIFT | PolyPhen | Tumor Sample Barcode | Tissue | Histology | Sex | Age | Stage | Therapy Types | Drugs | Outcome |
| CDH2 | SNV | Missense_Mutation | novel | c.2125N>C | p.Cys709Arg | p.C709R | P19022 | protein_coding | deleterious(0.01) | possibly_damaging(0.866) | TCGA-A2-A0CP-01 | Breast | breast invasive carcinoma | Female | <65 | I/II | Chemotherapy | cytoxan | SD |
| CDH2 | SNV | Missense_Mutation | c.1949N>C | p.Arg650Thr | p.R650T | P19022 | protein_coding | deleterious(0.02) | possibly_damaging(0.665) | TCGA-A2-A0CT-01 | Breast | breast invasive carcinoma | Female | >=65 | I/II | Chemotherapy | cytoxan | SD | |
| CDH2 | SNV | Missense_Mutation | novel | c.847N>A | p.Gly283Arg | p.G283R | P19022 | protein_coding | tolerated(0.05) | possibly_damaging(0.715) | TCGA-A7-A0DB-01 | Breast | breast invasive carcinoma | Female | <65 | I/II | Hormone Therapy | arimidex | SD |
| CDH2 | SNV | Missense_Mutation | c.560G>C | p.Arg187Thr | p.R187T | P19022 | protein_coding | deleterious(0.01) | possibly_damaging(0.8) | TCGA-AC-A23H-01 | Breast | breast invasive carcinoma | Female | >=65 | I/II | Unknown | Unknown | PD | |
| CDH2 | insertion | Frame_Shift_Ins | novel | c.2122_2123insTTCCATGCTTGGTTTACAAT | p.Asp708ValfsTer40 | p.D708Vfs*40 | P19022 | protein_coding | TCGA-A2-A0CP-01 | Breast | breast invasive carcinoma | Female | <65 | I/II | Chemotherapy | cytoxan | SD | ||
| CDH2 | insertion | Frame_Shift_Ins | novel | c.2604_2605insATTTTATGTGCCTTTTTGTACCTTTTTCAGATTGGAAT | p.Ser869IlefsTer15 | p.S869Ifs*15 | P19022 | protein_coding | TCGA-A2-A0D1-01 | Breast | breast invasive carcinoma | Female | >=65 | I/II | Chemotherapy | taxotere | SD | ||
| CDH2 | insertion | Nonsense_Mutation | novel | c.2275_2276insAGTGGTTTTTCTACCATACATA | p.Leu759Ter | p.L759* | P19022 | protein_coding | TCGA-AR-A0U0-01 | Breast | breast invasive carcinoma | Female | >=65 | I/II | Unknown | Unknown | SD | ||
| CDH2 | SNV | Missense_Mutation | rs771312999 | c.2257N>T | p.Arg753Cys | p.R753C | P19022 | protein_coding | deleterious(0.03) | probably_damaging(1) | TCGA-2W-A8YY-01 | Cervix | cervical & endocervical cancer | Female | <65 | I/II | Chemotherapy | cisplatin | CR |
| CDH2 | SNV | Missense_Mutation | rs140836073 | c.2153N>T | p.Ala718Val | p.A718V | P19022 | protein_coding | deleterious(0) | benign(0.369) | TCGA-C5-A7CK-01 | Cervix | cervical & endocervical cancer | Female | <65 | I/II | Chemotherapy | cisplatin | SD |
| CDH2 | SNV | Missense_Mutation | rs201148355 | c.1471N>A | p.Val491Ile | p.V491I | P19022 | protein_coding | tolerated(0.19) | benign(0.001) | TCGA-DS-A0VL-01 | Cervix | cervical & endocervical cancer | Female | <65 | I/II | Unknown | Unknown | SD |
| Page: 1 2 3 4 5 6 7 8 9 10 11 12 13 14 15 16 17 18 19 |
Top |
Related drugs of malignant transformation related genes |
| Identification of chemicals and drugs interact with genes involved in malignant transfromation |
| (DGIdb 4.0) |
| Entrez ID | Symbol | Category | Interaction Types | Drug Claim Name | Drug Name | PMIDs |
| 1000 | CDH2 | CELL SURFACE, DRUGGABLE GENOME | ADH-1 | ADH-1 | ||
| 1000 | CDH2 | CELL SURFACE, DRUGGABLE GENOME | Exherin | |||
| 1000 | CDH2 | CELL SURFACE, DRUGGABLE GENOME | methadone | METHADONE |
| Page: 1 |

Copyright 2023-Present -The University of Texas Health Science Center at Houston |