
|
|||||
|
 | |
| |
| |
| |
| |
| |
|
Gene: CCT6A |
Gene summary for CCT6A |
| Gene information | Species | Human | Gene symbol | CCT6A | Gene ID | 908 |
| Gene name | chaperonin containing TCP1 subunit 6A | |
| Gene Alias | CCT-zeta | |
| Cytomap | 7p11.2 | |
| Gene Type | protein-coding | GO ID | GO:0000723 | UniProtAcc | P40227 |
Top |
Malignant transformation analysis |
| Identification of the aberrant gene expression in precancerous and cancerous lesions by comparing the gene expression of stem-like cells in diseased tissues with normal stem cells |
| Entrez ID | Symbol | Replicates | Species | Organ | Tissue | Adj P-value | Log2FC | Malignancy |
| 908 | CCT6A | HTA11_78_2000001011 | Human | Colorectum | AD | 3.85e-04 | 4.43e-01 | -0.1088 |
| 908 | CCT6A | HTA11_347_2000001011 | Human | Colorectum | AD | 2.44e-04 | 3.19e-01 | -0.1954 |
| 908 | CCT6A | HTA11_1391_2000001011 | Human | Colorectum | AD | 4.69e-03 | 4.25e-01 | -0.059 |
| 908 | CCT6A | HTA11_6801_2000001011 | Human | Colorectum | SER | 1.80e-02 | 7.36e-01 | 0.0171 |
| 908 | CCT6A | HTA11_99999970781_79442 | Human | Colorectum | MSS | 4.16e-08 | 5.11e-01 | 0.294 |
| 908 | CCT6A | HTA11_99999965104_69814 | Human | Colorectum | MSS | 2.45e-06 | 7.16e-01 | 0.281 |
| 908 | CCT6A | HTA11_99999971662_82457 | Human | Colorectum | MSS | 7.68e-19 | 7.13e-01 | 0.3859 |
| 908 | CCT6A | HTA11_99999974143_84620 | Human | Colorectum | MSS | 1.95e-03 | 2.84e-01 | 0.3005 |
| 908 | CCT6A | A015-C-203 | Human | Colorectum | FAP | 6.36e-04 | -6.54e-02 | -0.1294 |
| 908 | CCT6A | A001-C-108 | Human | Colorectum | FAP | 2.87e-02 | -7.64e-02 | -0.0272 |
| 908 | CCT6A | A002-C-205 | Human | Colorectum | FAP | 8.09e-04 | -4.90e-02 | -0.1236 |
| 908 | CCT6A | A002-C-114 | Human | Colorectum | FAP | 7.50e-03 | -4.67e-02 | -0.1561 |
| 908 | CCT6A | A015-C-104 | Human | Colorectum | FAP | 3.93e-06 | -8.85e-02 | -0.1899 |
| 908 | CCT6A | A002-C-016 | Human | Colorectum | FAP | 3.78e-02 | -5.99e-02 | 0.0521 |
| 908 | CCT6A | A002-C-116 | Human | Colorectum | FAP | 1.99e-04 | -7.76e-02 | -0.0452 |
| 908 | CCT6A | CRC-3-11773 | Human | Colorectum | CRC | 1.40e-05 | 3.57e-01 | 0.2564 |
| 908 | CCT6A | AEH-subject1 | Human | Endometrium | AEH | 3.73e-08 | -2.48e-01 | -0.3059 |
| 908 | CCT6A | AEH-subject2 | Human | Endometrium | AEH | 1.05e-09 | -2.71e-01 | -0.2525 |
| 908 | CCT6A | AEH-subject3 | Human | Endometrium | AEH | 9.93e-06 | -1.27e-01 | -0.2576 |
| 908 | CCT6A | AEH-subject4 | Human | Endometrium | AEH | 1.77e-02 | -8.85e-02 | -0.2657 |
| Page: 1 2 3 4 5 6 7 8 9 10 |
| Tissue | Expression Dynamics | Abbreviation |
| Colorectum (GSE201348) |  | FAP: Familial adenomatous polyposis |
| CRC: Colorectal cancer | ||
| Colorectum (HTA11) |  | AD: Adenomas |
| SER: Sessile serrated lesions | ||
| MSI-H: Microsatellite-high colorectal cancer | ||
| MSS: Microsatellite stable colorectal cancer | ||
| Endometrium | 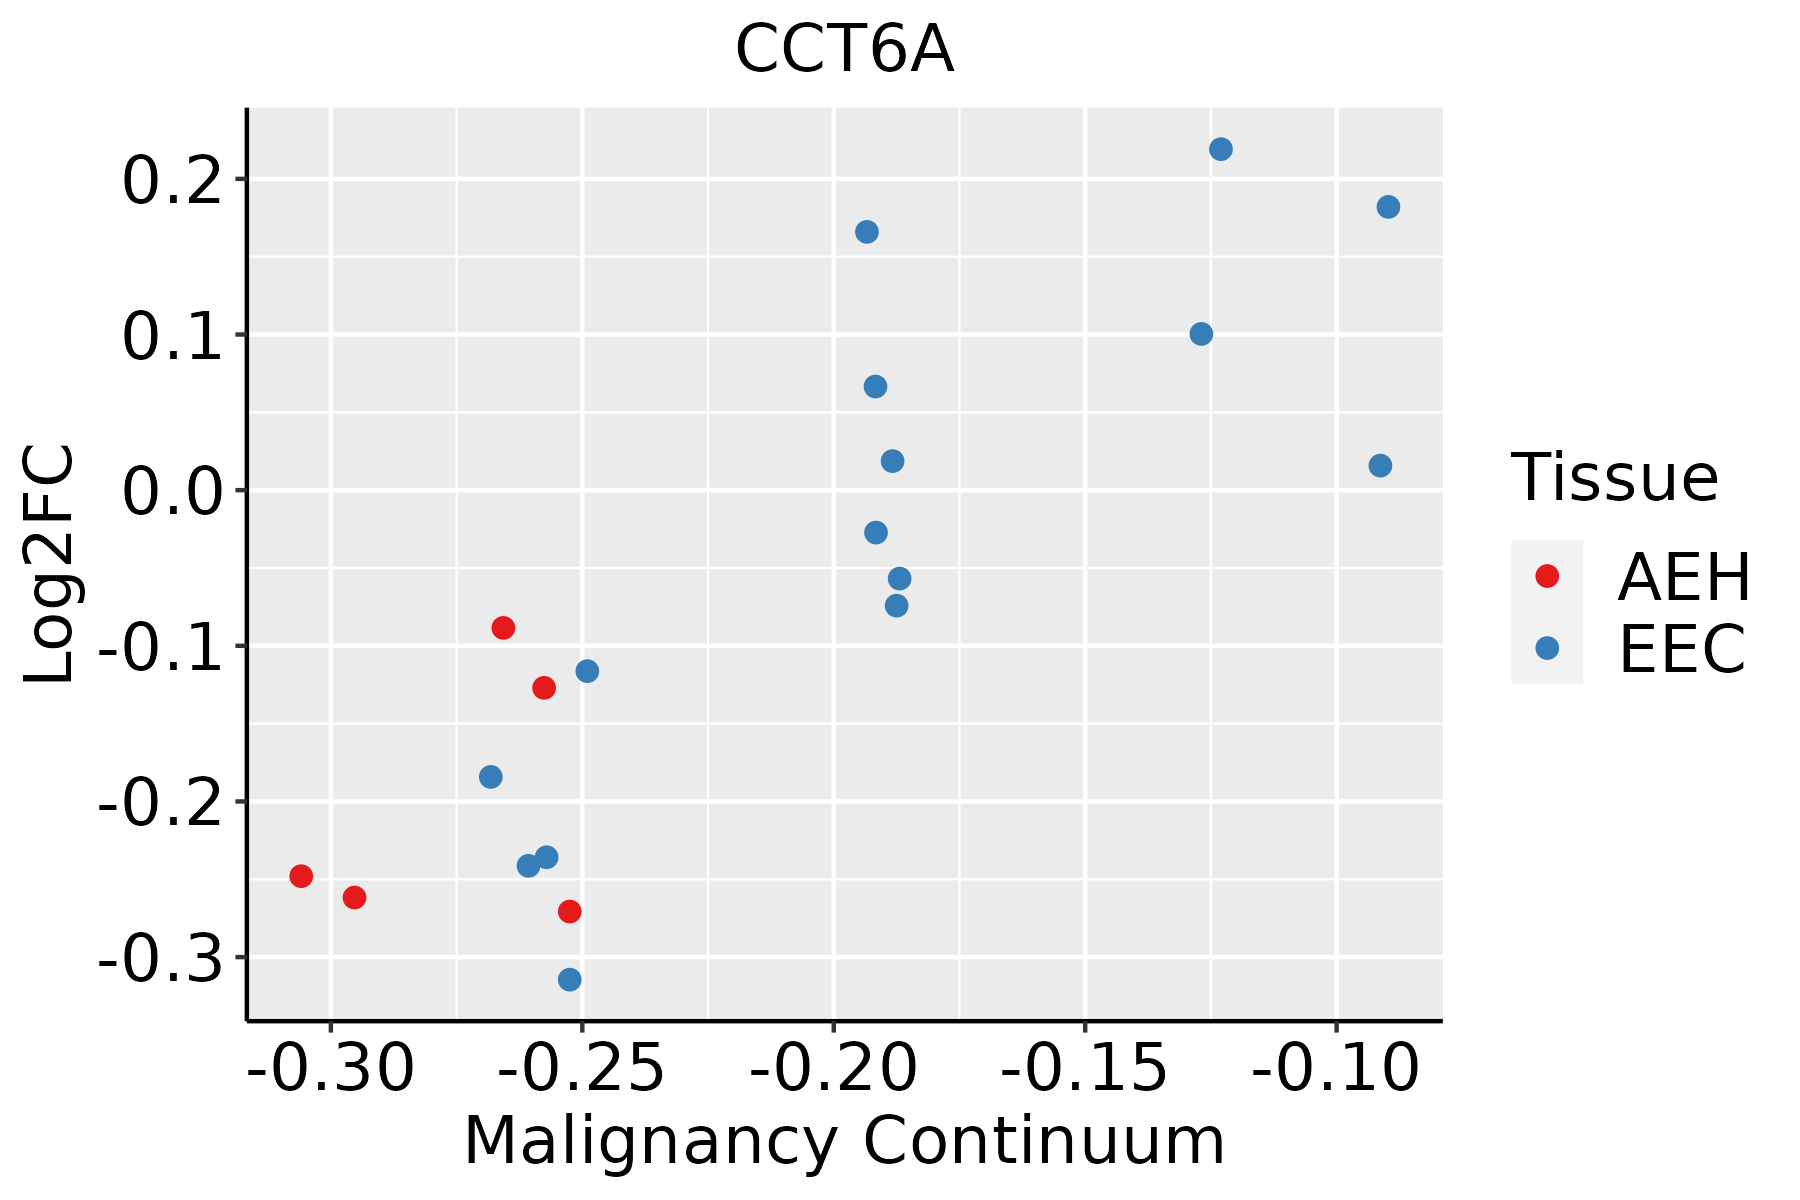 | AEH: Atypical endometrial hyperplasia |
| EEC: Endometrioid Cancer | ||
| Esophagus | 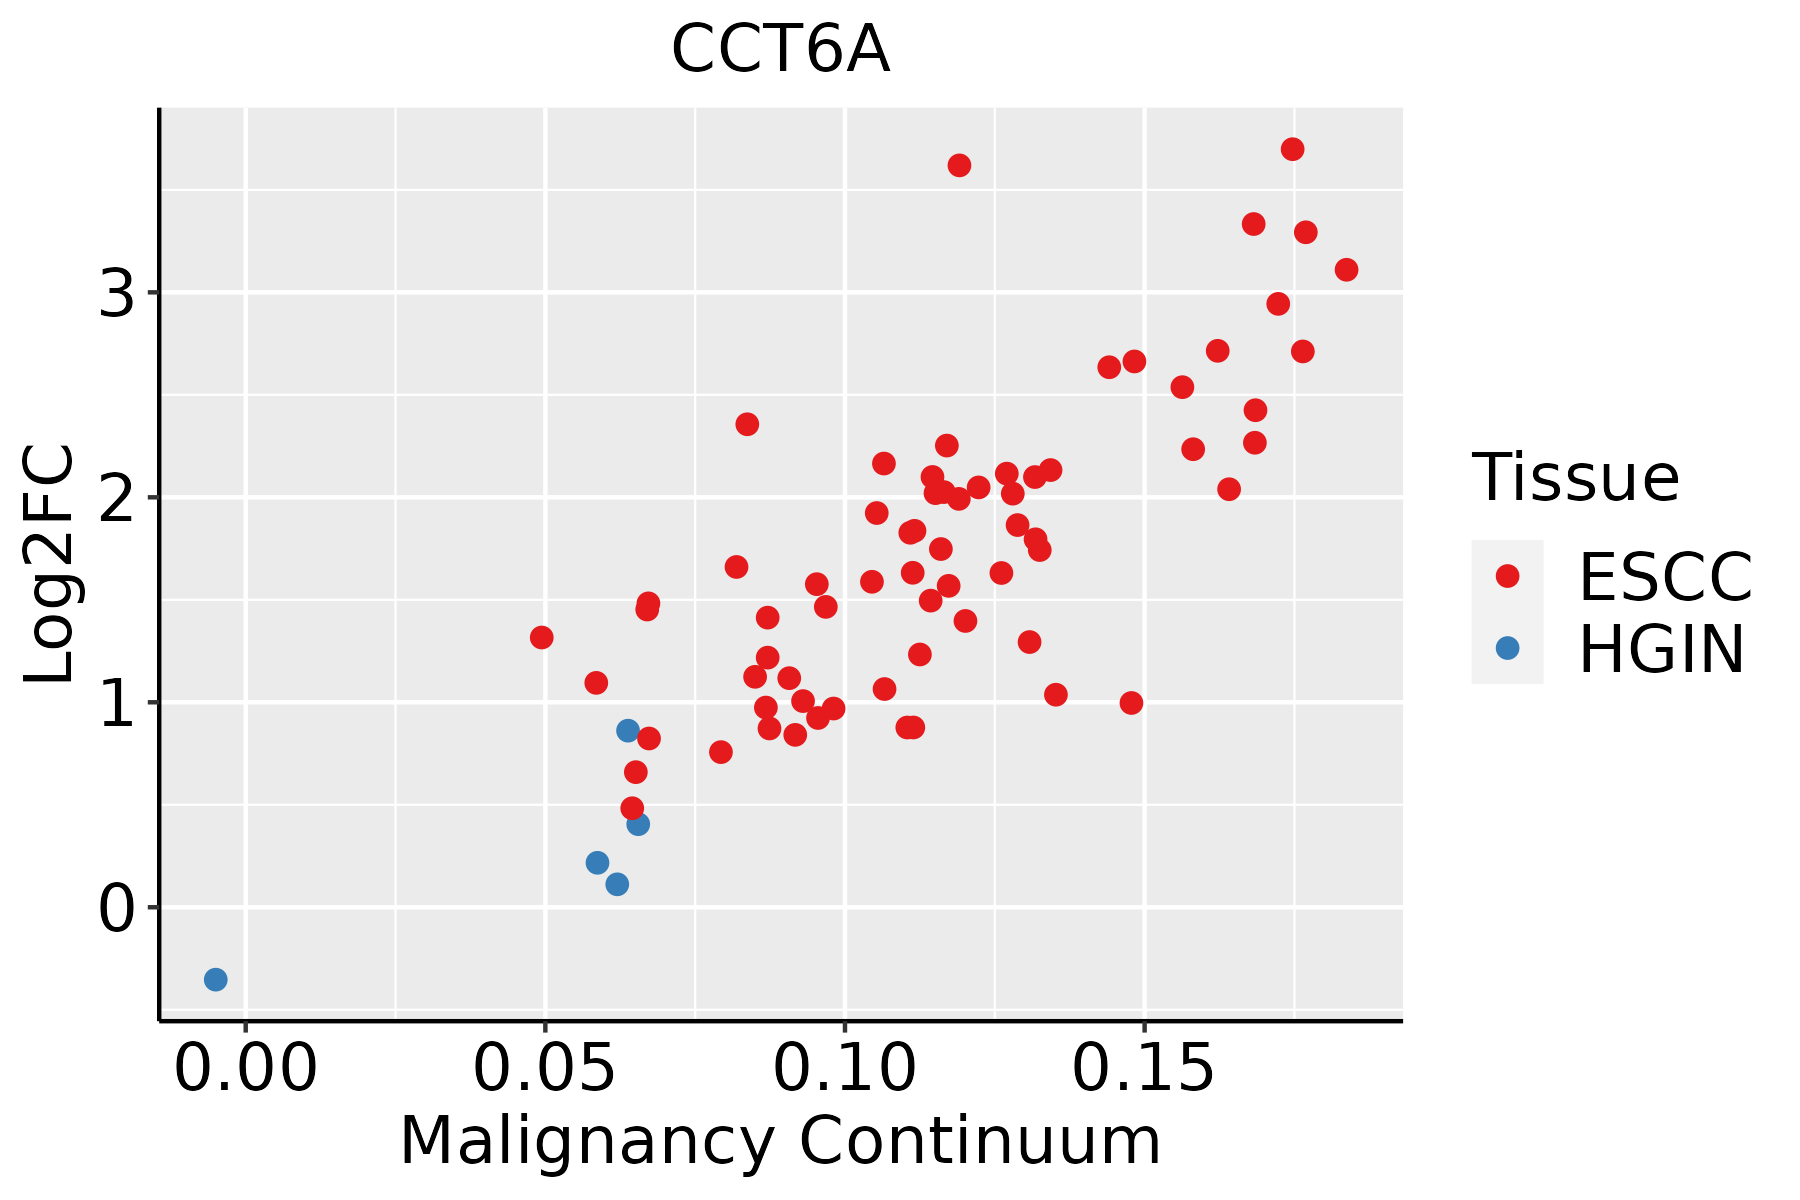 | ESCC: Esophageal squamous cell carcinoma |
| HGIN: High-grade intraepithelial neoplasias | ||
| LGIN: Low-grade intraepithelial neoplasias | ||
| Liver |  | HCC: Hepatocellular carcinoma |
| NAFLD: Non-alcoholic fatty liver disease | ||
| Oral Cavity | 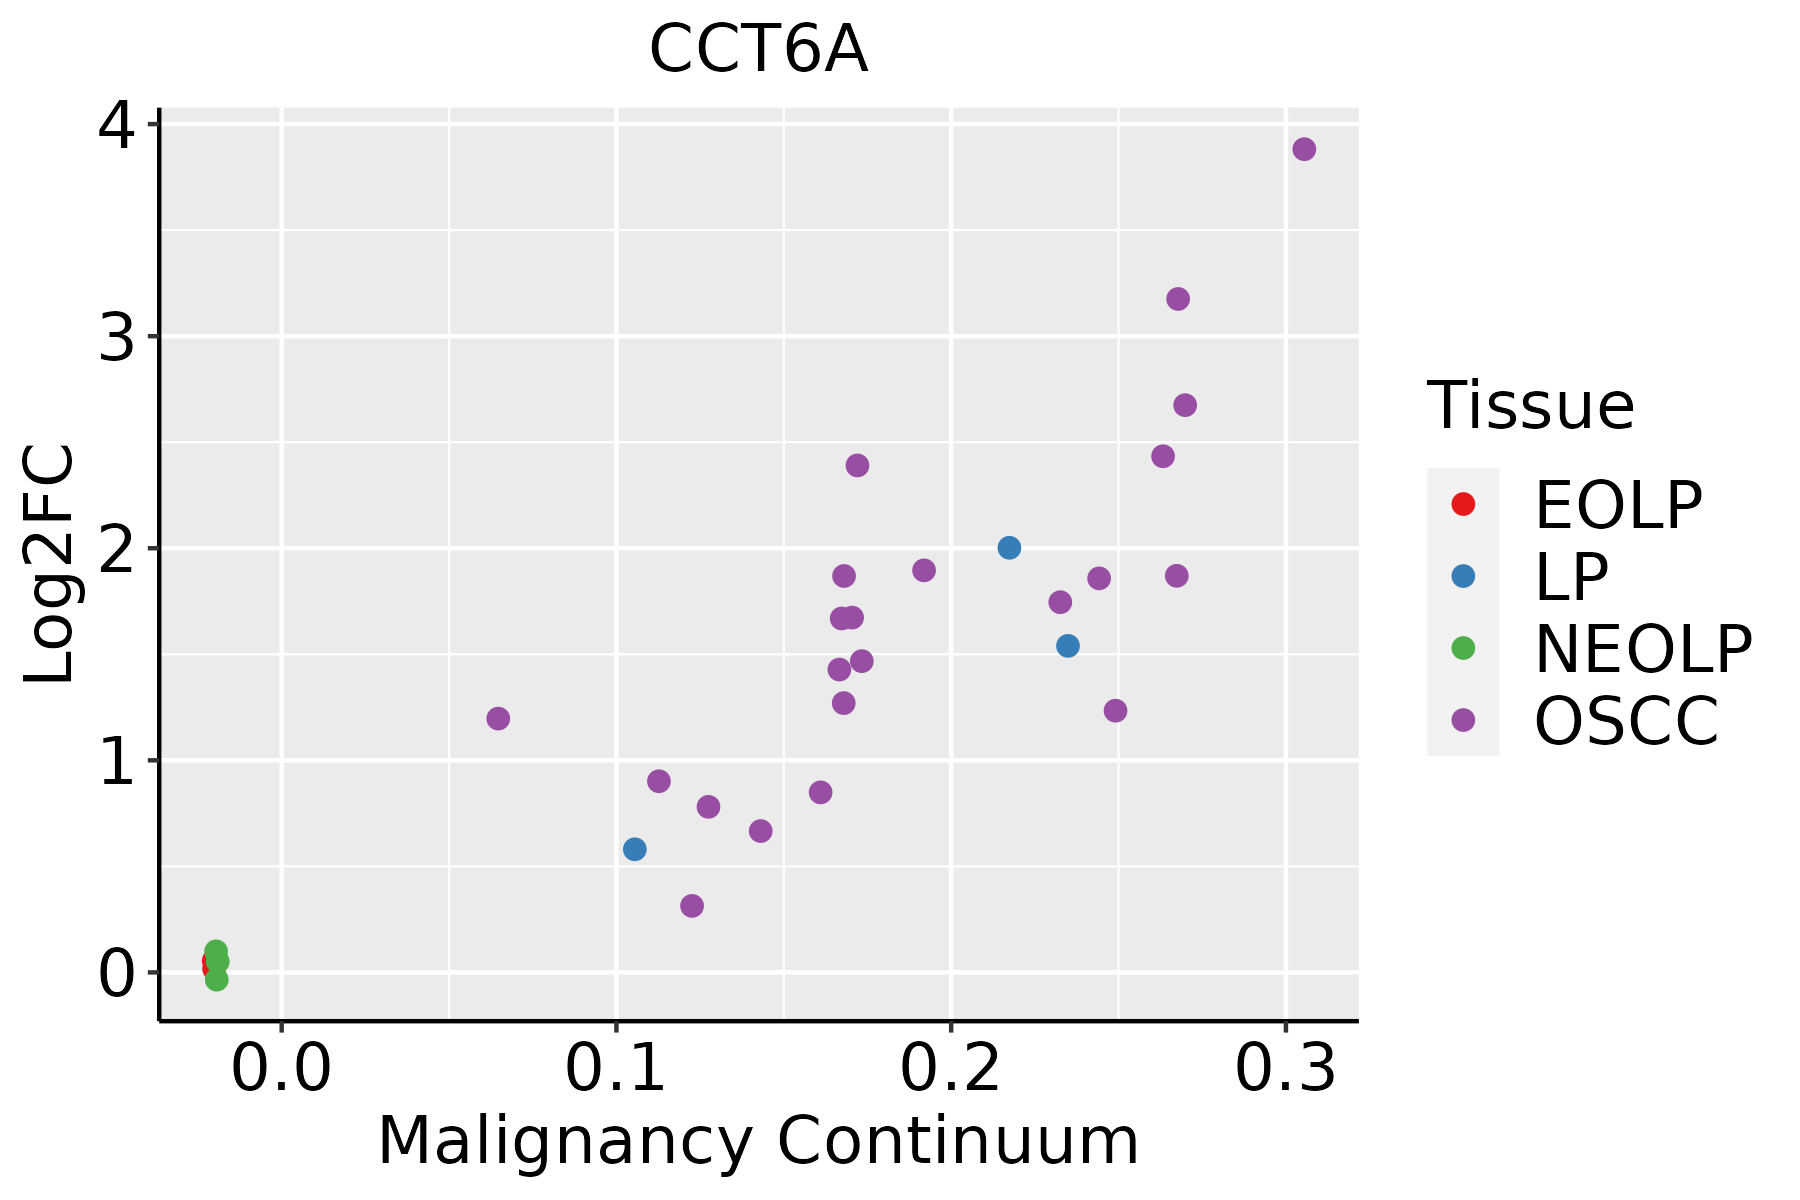 | EOLP: Erosive Oral lichen planus |
| LP: leukoplakia | ||
| NEOLP: Non-erosive oral lichen planus | ||
| OSCC: Oral squamous cell carcinoma | ||
| Prostate | 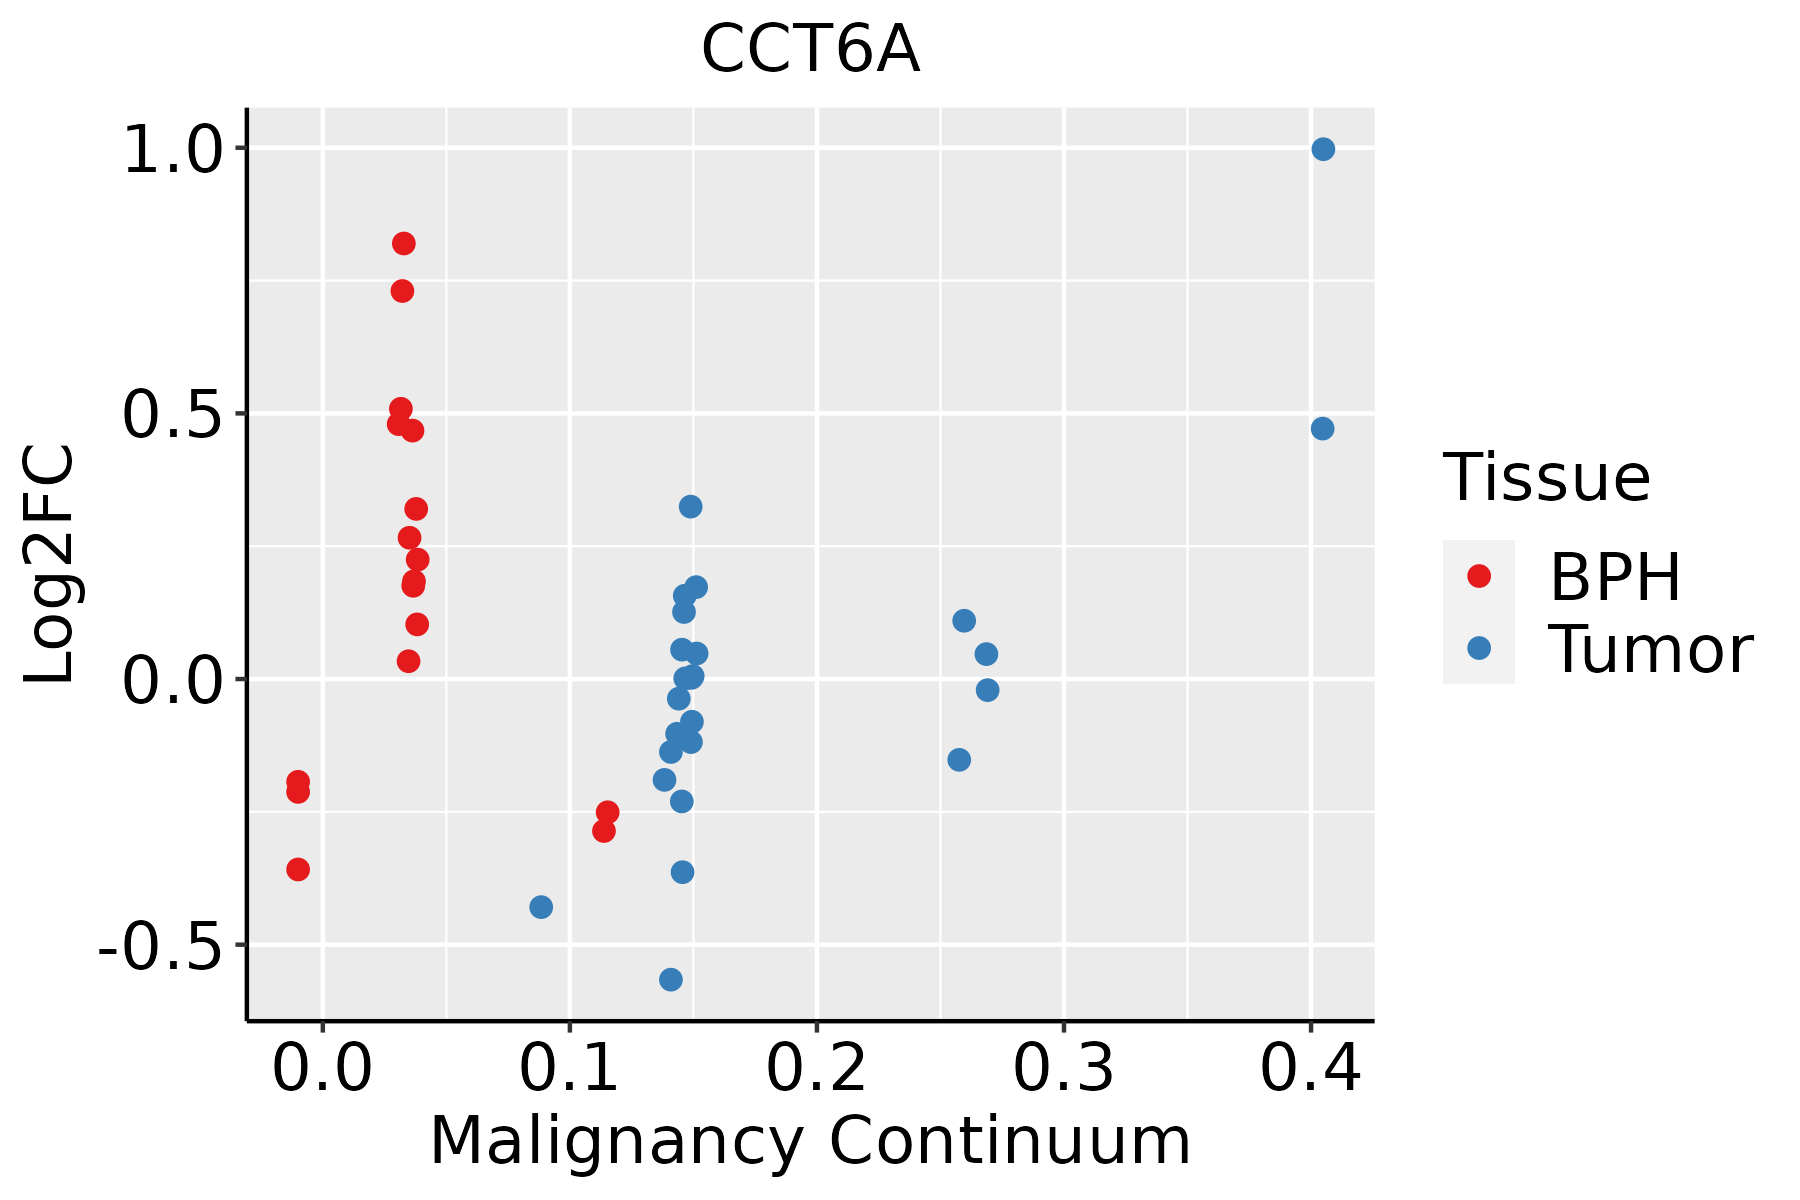 | BPH: Benign Prostatic Hyperplasia |
| Skin | 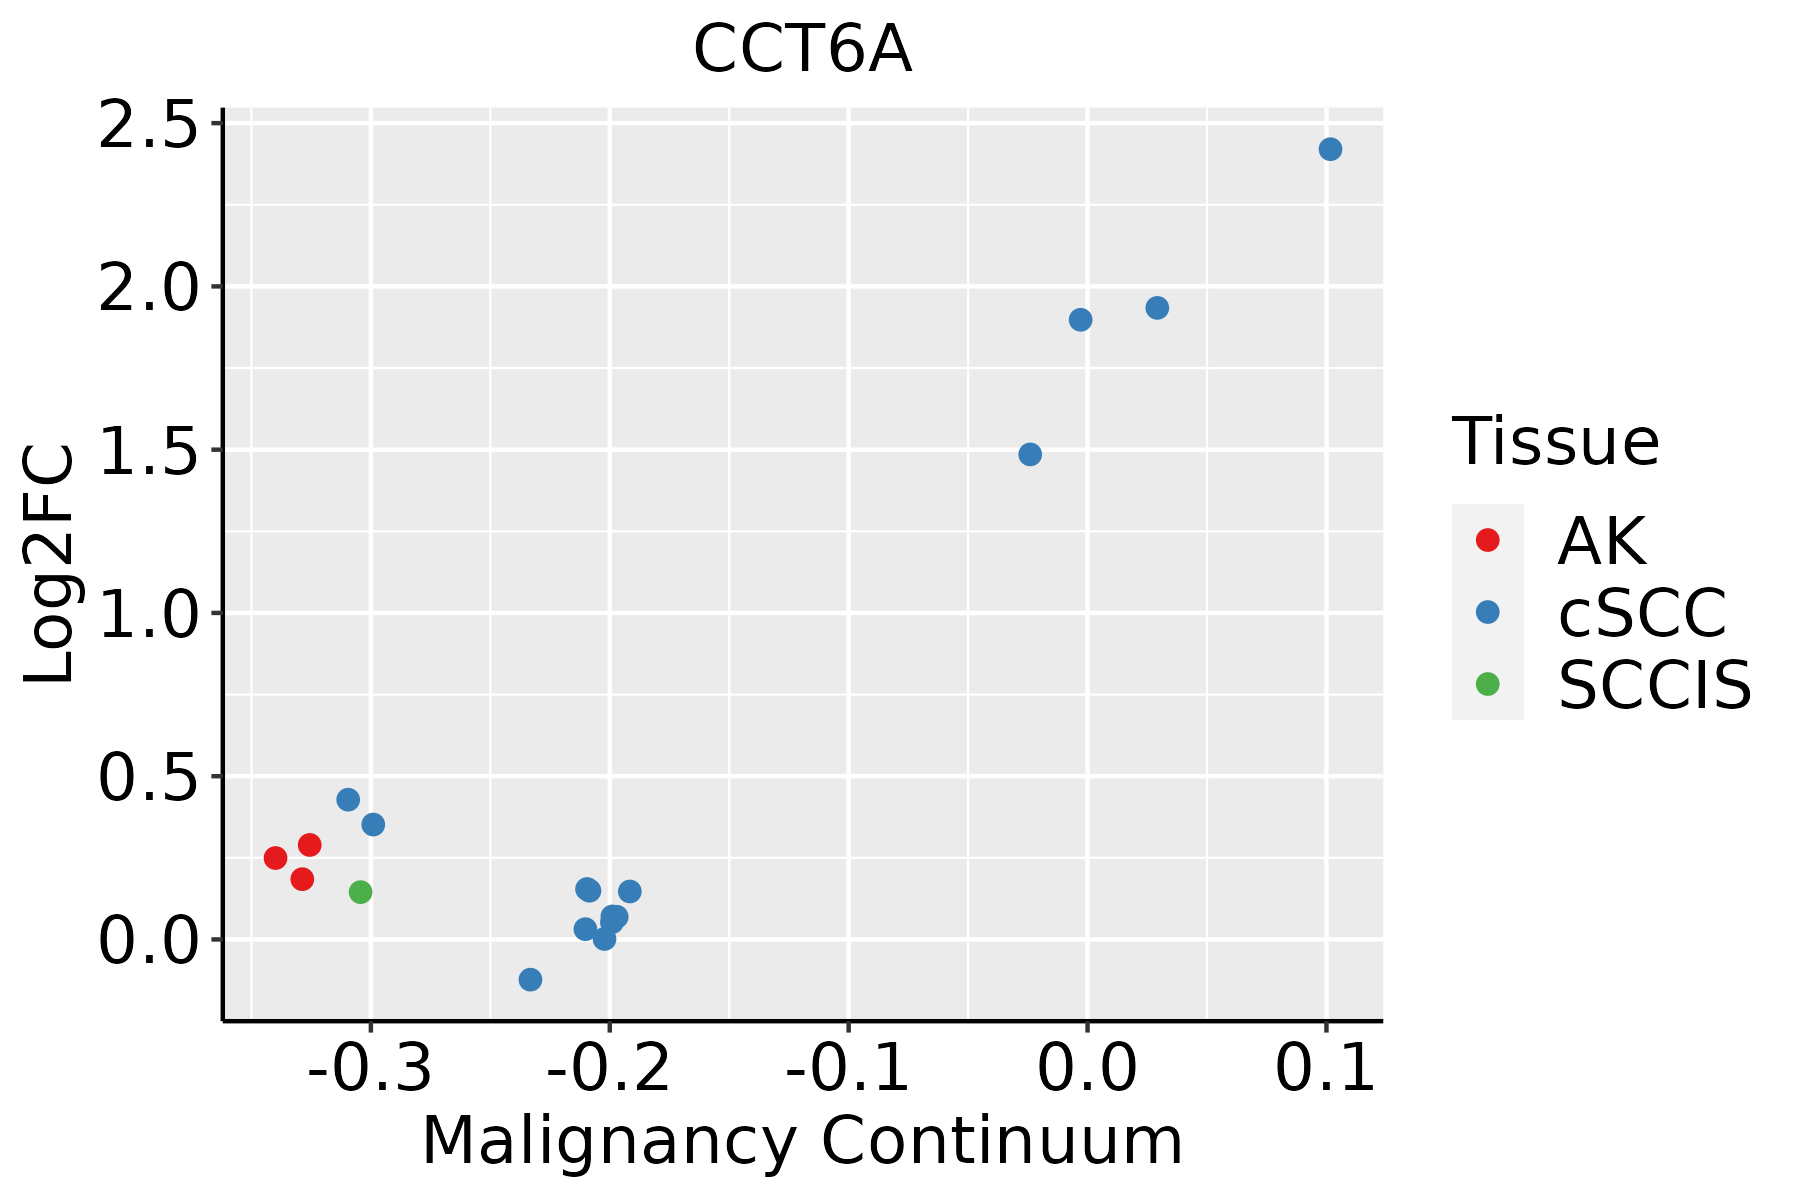 | AK: Actinic keratosis |
| cSCC: Cutaneous squamous cell carcinoma | ||
| SCCIS:squamous cell carcinoma in situ | ||
| Thyroid | 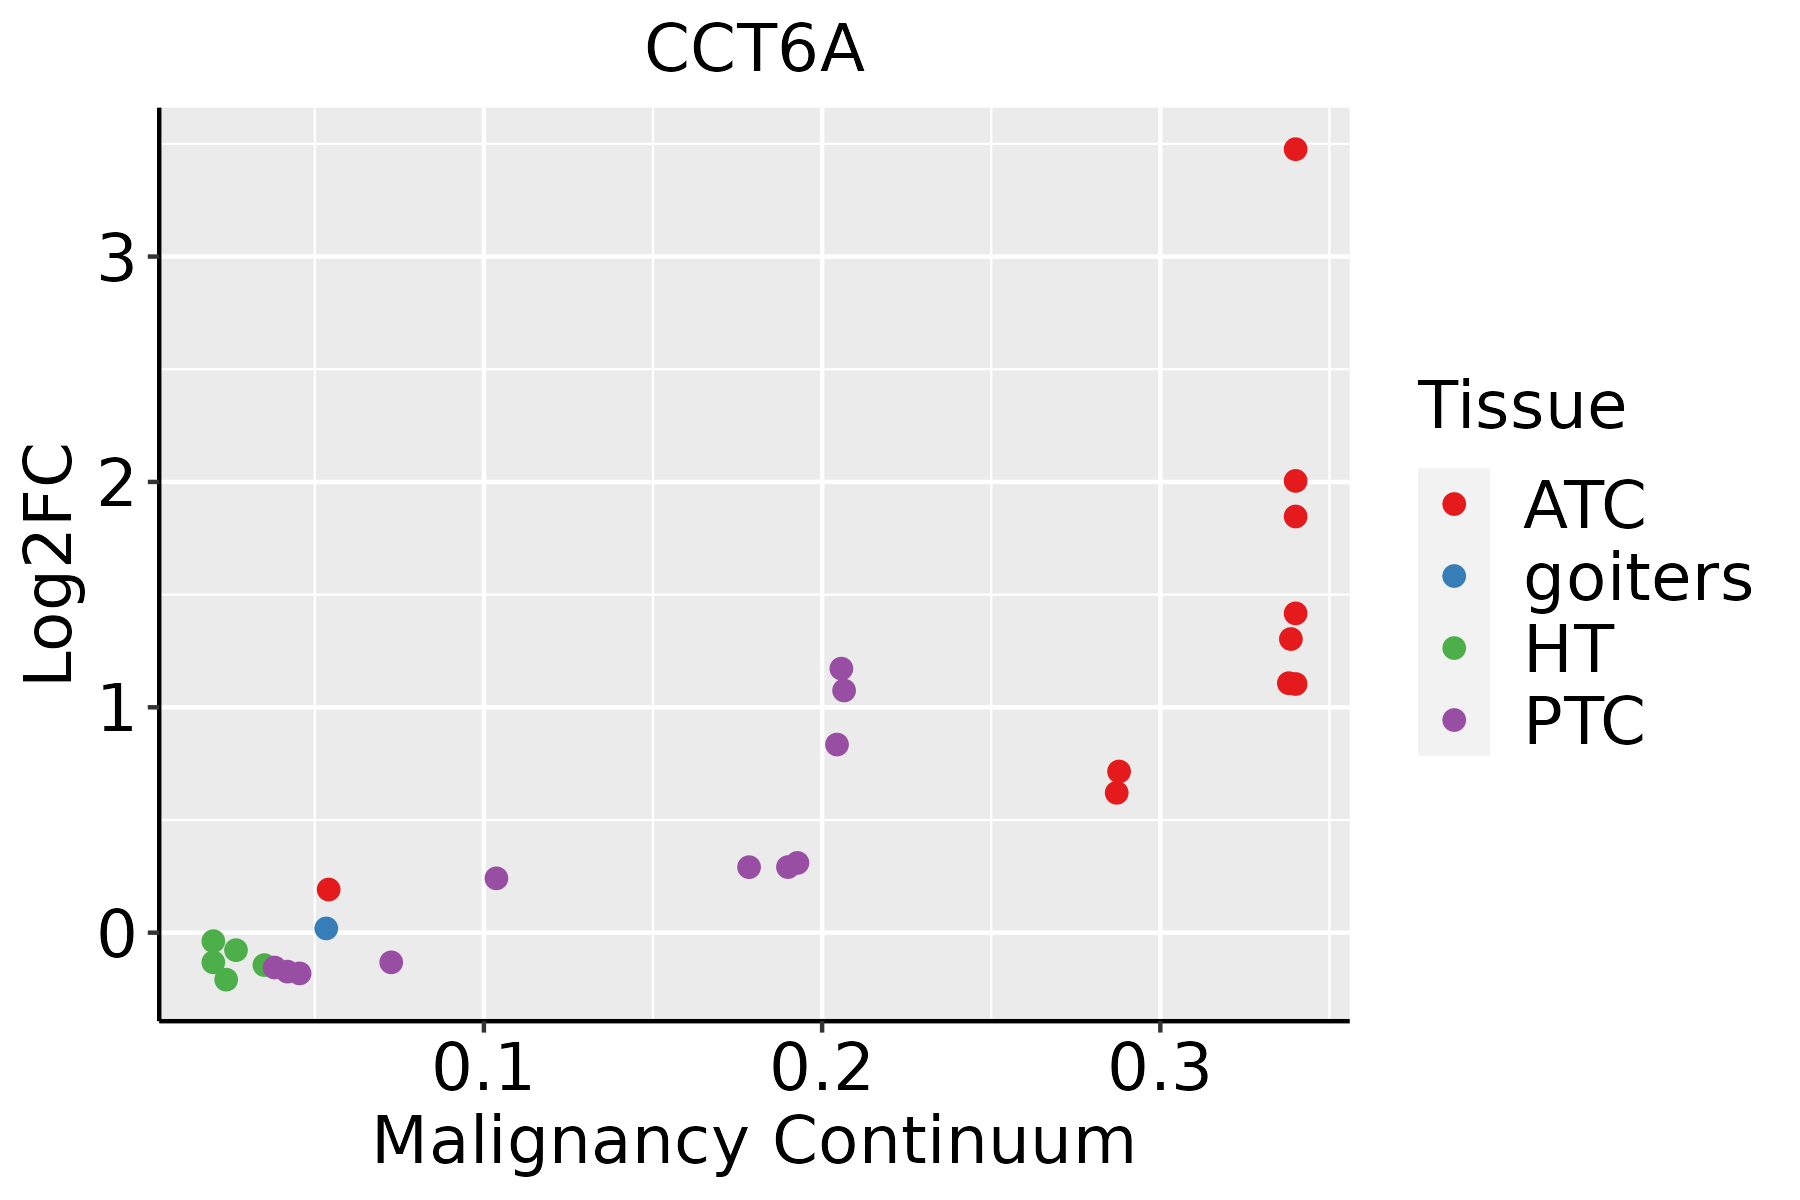 | ATC: Anaplastic thyroid cancer |
| HT: Hashimoto's thyroiditis | ||
| PTC: Papillary thyroid cancer |
| ∗log2FC in expression of this searched gene in stem-like cells from each diseased tissue sample relative to stem-like cells in normal samples in each tissue plotted against the malignancy continuum. Samples are colored based on if they are from different disease stage. |
Top |
Malignant transformation related pathway analysis |
| Find out the enriched GO biological processes and KEGG pathways involved in transition from healthy to precancer to cancer |
| Tissue | Disease Stage | Enriched GO biological Processes |
| Colorectum | AD |  |
| Colorectum | SER |  |
| Colorectum | MSS |  |
| Colorectum | MSI-H |  |
| Colorectum | FAP |  |
| ∗Top 15 enriched GO BP terms are showed in the bar plot of each disease state in each tissue. Each row represents a significant GO biological process which is colored according to the -log10(p.adjust). |
| Page: 1 2 3 4 5 6 7 8 9 |
| GO ID | Tissue | Disease Stage | Description | Gene Ratio | Bg Ratio | pvalue | p.adjust | Count |
| GO:00702035 | Endometrium | AEH | regulation of establishment of protein localization to telomere | 8/2100 | 11/18723 | 2.98e-06 | 8.33e-05 | 8 |
| GO:19048695 | Endometrium | AEH | regulation of protein localization to Cajal body | 8/2100 | 11/18723 | 2.98e-06 | 8.33e-05 | 8 |
| GO:19048715 | Endometrium | AEH | positive regulation of protein localization to Cajal body | 8/2100 | 11/18723 | 2.98e-06 | 8.33e-05 | 8 |
| GO:19901735 | Endometrium | AEH | protein localization to nucleoplasm | 9/2100 | 14/18723 | 3.26e-06 | 8.90e-05 | 9 |
| GO:19001828 | Endometrium | AEH | positive regulation of protein localization to nucleus | 25/2100 | 87/18723 | 6.36e-06 | 1.55e-04 | 25 |
| GO:19034054 | Endometrium | AEH | protein localization to nuclear body | 8/2100 | 12/18723 | 8.07e-06 | 1.91e-04 | 8 |
| GO:19048164 | Endometrium | AEH | positive regulation of protein localization to chromosome, telomeric region | 8/2100 | 12/18723 | 8.07e-06 | 1.91e-04 | 8 |
| GO:19048674 | Endometrium | AEH | protein localization to Cajal body | 8/2100 | 12/18723 | 8.07e-06 | 1.91e-04 | 8 |
| GO:00070048 | Endometrium | AEH | telomere maintenance via telomerase | 21/2100 | 69/18723 | 1.30e-05 | 2.82e-04 | 21 |
| GO:00345049 | Endometrium | AEH | protein localization to nucleus | 57/2100 | 290/18723 | 1.65e-05 | 3.42e-04 | 57 |
| GO:19043589 | Endometrium | AEH | positive regulation of telomere maintenance via telomere lengthening | 14/2100 | 37/18723 | 2.38e-05 | 4.51e-04 | 14 |
| GO:200027810 | Endometrium | AEH | regulation of DNA biosynthetic process | 27/2100 | 106/18723 | 3.12e-05 | 5.66e-04 | 27 |
| GO:19001809 | Endometrium | AEH | regulation of protein localization to nucleus | 32/2100 | 136/18723 | 3.42e-05 | 6.06e-04 | 32 |
| GO:19048144 | Endometrium | AEH | regulation of protein localization to chromosome, telomeric region | 8/2100 | 14/18723 | 3.98e-05 | 6.86e-04 | 8 |
| GO:00322127 | Endometrium | AEH | positive regulation of telomere maintenance via telomerase | 13/2100 | 34/18723 | 4.08e-05 | 6.97e-04 | 13 |
| GO:00062787 | Endometrium | AEH | RNA-dependent DNA biosynthetic process | 21/2100 | 75/18723 | 5.23e-05 | 8.36e-04 | 21 |
| GO:00108339 | Endometrium | AEH | telomere maintenance via telomere lengthening | 22/2100 | 81/18723 | 5.82e-05 | 9.12e-04 | 22 |
| GO:00322069 | Endometrium | AEH | positive regulation of telomere maintenance | 16/2100 | 52/18723 | 1.18e-04 | 1.66e-03 | 16 |
| GO:00702004 | Endometrium | AEH | establishment of protein localization to telomere | 8/2100 | 16/18723 | 1.38e-04 | 1.86e-03 | 8 |
| GO:00322105 | Endometrium | AEH | regulation of telomere maintenance via telomerase | 16/2100 | 53/18723 | 1.52e-04 | 2.00e-03 | 16 |
| Page: 1 2 3 4 5 6 7 8 9 10 11 12 13 14 15 16 17 18 19 20 21 22 23 24 25 26 27 28 29 30 31 32 33 34 35 36 37 38 39 40 |
| Pathway ID | Tissue | Disease Stage | Description | Gene Ratio | Bg Ratio | pvalue | p.adjust | qvalue | Count |
| Page: 1 |
Top |
Cell-cell communication analysis |
| Identification of potential cell-cell interactions between two cell types and their ligand-receptor pairs for different disease states |
| Ligand | Receptor | LRpair | Pathway | Tissue | Disease Stage |
| Page: 1 |
Top |
Single-cell gene regulatory network inference analysis |
| Find out the significant the regulons (TFs) and the target genes of each regulon across cell types for different disease states |
| TF | Cell Type | Tissue | Disease Stage | Target Gene | RSS | Regulon Activity |
| ∗The dot plots of a searched regulon are shown for all cell subpopulations in each disease state of each tissue based on the regulon specific score inferred using pySCENIC and by calculating the average expression. |
| Page: 1 |
Top |
Somatic mutation of malignant transformation related genes |
| Annotation of somatic variants for genes involved in malignant transformation |
| Hugo Symbol | Variant Class | Variant Classification | dbSNP RS | HGVSc | HGVSp | HGVSp Short | SWISSPROT | BIOTYPE | SIFT | PolyPhen | Tumor Sample Barcode | Tissue | Histology | Sex | Age | Stage | Therapy Types | Drugs | Outcome |
| CCT6A | SNV | Missense_Mutation | rs770231271 | c.1324N>A | p.Asp442Asn | p.D442N | P40227 | protein_coding | tolerated(0.2) | benign(0.012) | TCGA-A8-A094-01 | Breast | breast invasive carcinoma | Female | >=65 | I/II | Unknown | Unknown | SD |
| CCT6A | SNV | Missense_Mutation | c.1115N>C | p.Val372Ala | p.V372A | P40227 | protein_coding | tolerated(0.07) | possibly_damaging(0.588) | TCGA-AN-A0AK-01 | Breast | breast invasive carcinoma | Female | >=65 | I/II | Unknown | Unknown | SD | |
| CCT6A | SNV | Missense_Mutation | novel | c.867N>A | p.Phe289Leu | p.F289L | P40227 | protein_coding | deleterious(0.04) | possibly_damaging(0.85) | TCGA-DS-A1OC-01 | Cervix | cervical & endocervical cancer | Female | <65 | I/II | Chemotherapy | gemcitabine | SD |
| CCT6A | SNV | Missense_Mutation | novel | c.559N>A | p.Asp187Asn | p.D187N | P40227 | protein_coding | tolerated(0.06) | possibly_damaging(0.558) | TCGA-EA-A3HU-01 | Cervix | cervical & endocervical cancer | Female | <65 | I/II | Unknown | Unknown | SD |
| CCT6A | insertion | In_Frame_Ins | novel | c.869_870insCCTAAGATTTAACAG | p.Val290_Val291insLeuArgPheAsnSer | p.V290_V291insLRFNS | P40227 | protein_coding | TCGA-DS-A1OC-01 | Cervix | cervical & endocervical cancer | Female | <65 | I/II | Chemotherapy | gemcitabine | SD | ||
| CCT6A | SNV | Missense_Mutation | c.1268N>A | p.Ile423Asn | p.I423N | P40227 | protein_coding | tolerated(0.36) | benign(0.005) | TCGA-A6-6649-01 | Colorectum | colon adenocarcinoma | Male | >=65 | III/IV | Chemotherapy | fluorouracil | SD | |
| CCT6A | SNV | Missense_Mutation | c.464N>A | p.Ser155Tyr | p.S155Y | P40227 | protein_coding | deleterious(0) | probably_damaging(0.98) | TCGA-AA-A010-01 | Colorectum | colon adenocarcinoma | Female | <65 | I/II | Chemotherapy | folinic | CR | |
| CCT6A | SNV | Missense_Mutation | c.650G>A | p.Arg217Gln | p.R217Q | P40227 | protein_coding | deleterious(0.03) | possibly_damaging(0.884) | TCGA-AD-6964-01 | Colorectum | colon adenocarcinoma | Male | <65 | III/IV | Chemotherapy | folfox | PD | |
| CCT6A | SNV | Missense_Mutation | c.1240N>A | p.Val414Met | p.V414M | P40227 | protein_coding | deleterious(0) | possibly_damaging(0.556) | TCGA-AD-A5EJ-01 | Colorectum | colon adenocarcinoma | Female | >=65 | I/II | Unknown | Unknown | SD | |
| CCT6A | SNV | Missense_Mutation | c.1310T>C | p.Val437Ala | p.V437A | P40227 | protein_coding | deleterious(0.03) | benign(0.158) | TCGA-F4-6856-01 | Colorectum | colon adenocarcinoma | Male | <65 | I/II | Ancillary | leucovorin | CR |
| Page: 1 2 3 4 5 6 |
Top |
Related drugs of malignant transformation related genes |
| Identification of chemicals and drugs interact with genes involved in malignant transfromation |
| (DGIdb 4.0) |
| Entrez ID | Symbol | Category | Interaction Types | Drug Claim Name | Drug Name | PMIDs |
| Page: 1 |

Copyright 2023-Present -The University of Texas Health Science Center at Houston |