| Tissue | Expression Dynamics | Abbreviation |
| Colorectum (GSE201348) |  | FAP: Familial adenomatous polyposis |
| CRC: Colorectal cancer |
| Colorectum (HTA11) |  | AD: Adenomas |
| SER: Sessile serrated lesions |
| MSI-H: Microsatellite-high colorectal cancer |
| MSS: Microsatellite stable colorectal cancer |
| Esophagus |  | ESCC: Esophageal squamous cell carcinoma |
| HGIN: High-grade intraepithelial neoplasias |
| LGIN: Low-grade intraepithelial neoplasias |
| Liver | 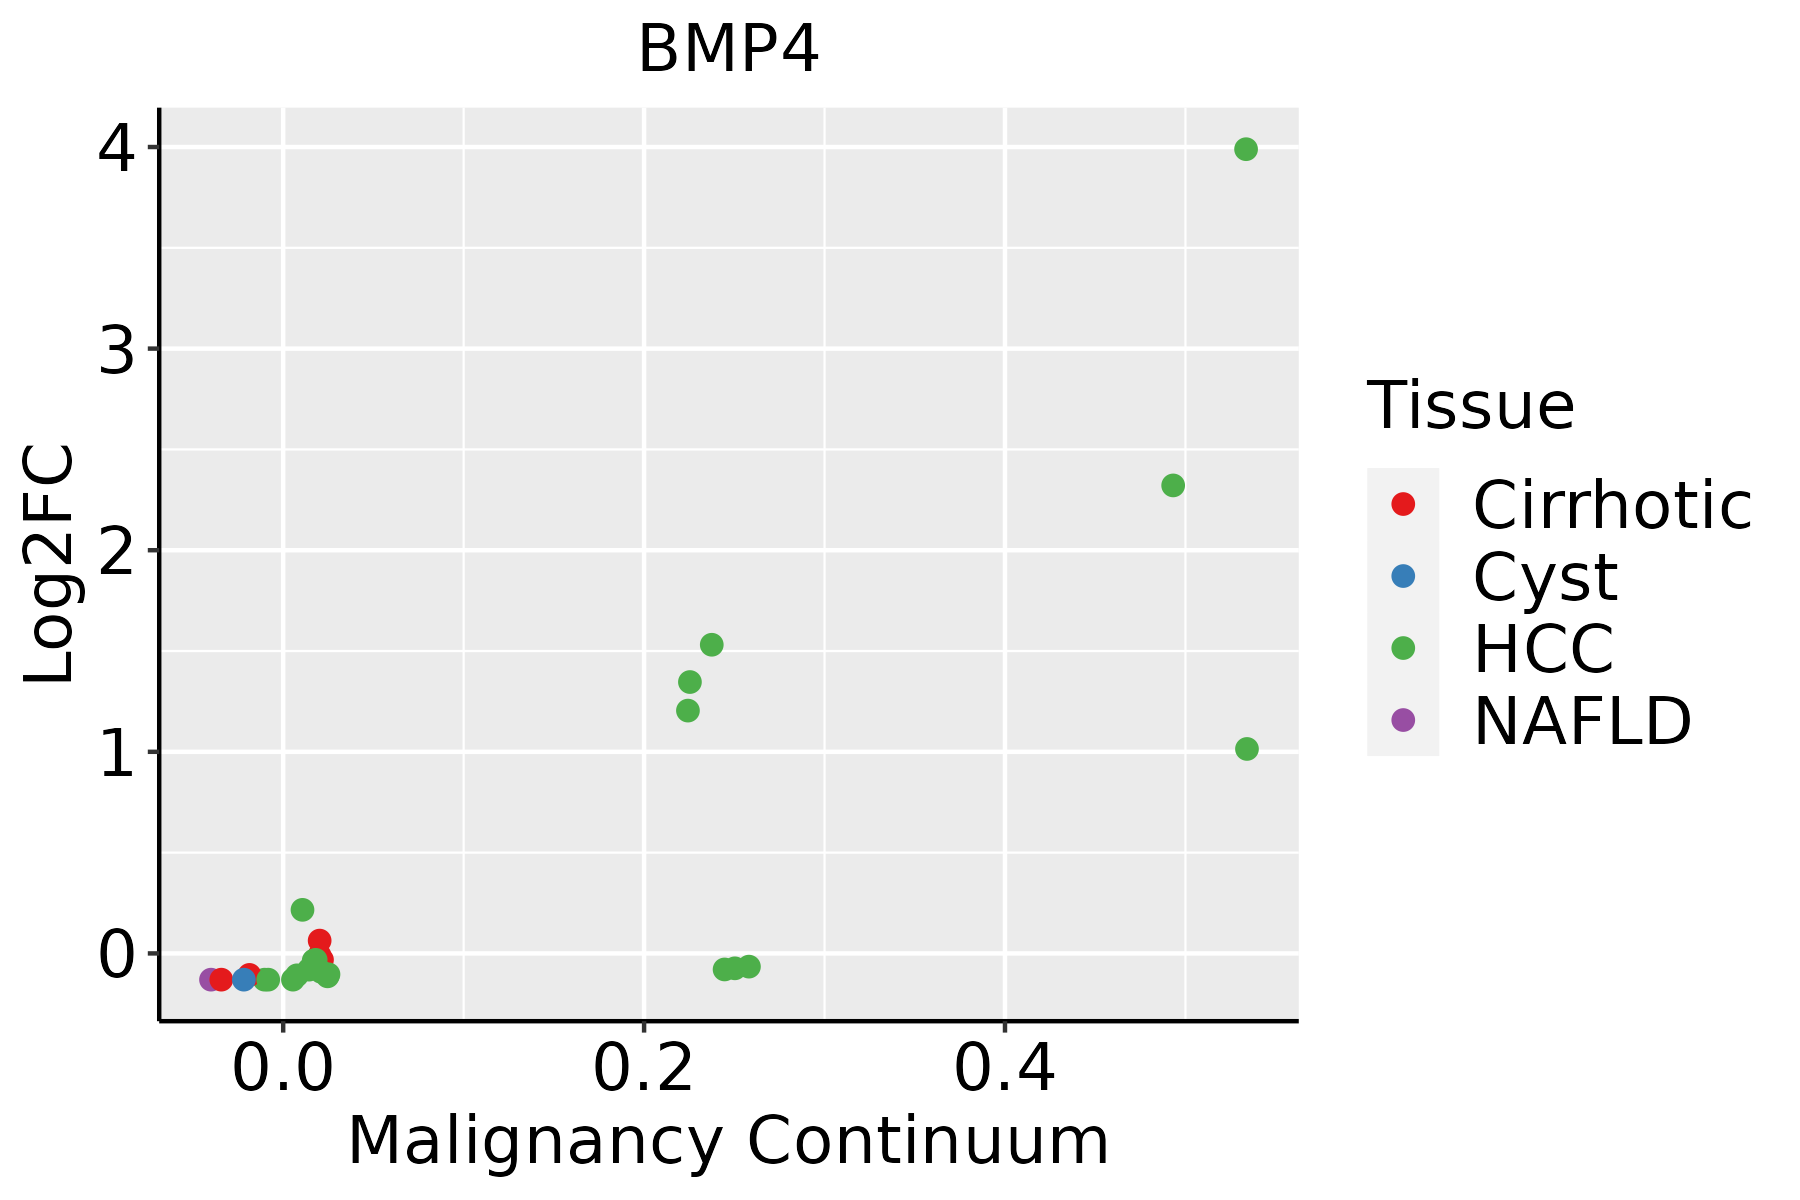 | HCC: Hepatocellular carcinoma |
| NAFLD: Non-alcoholic fatty liver disease |
| Oral Cavity |  | EOLP: Erosive Oral lichen planus |
| LP: leukoplakia |
| NEOLP: Non-erosive oral lichen planus |
| OSCC: Oral squamous cell carcinoma |
| GO ID | Tissue | Disease Stage | Description | Gene Ratio | Bg Ratio | pvalue | p.adjust | Count |
| GO:00435421 | Colorectum | SER | endothelial cell migration | 61/2897 | 279/18723 | 2.76e-03 | 2.47e-02 | 61 |
| GO:00459261 | Colorectum | SER | negative regulation of growth | 55/2897 | 249/18723 | 3.44e-03 | 2.92e-02 | 55 |
| GO:00073691 | Colorectum | SER | gastrulation | 43/2897 | 185/18723 | 3.44e-03 | 2.92e-02 | 43 |
| GO:00511701 | Colorectum | SER | import into nucleus | 38/2897 | 159/18723 | 3.48e-03 | 2.95e-02 | 38 |
| GO:00614581 | Colorectum | SER | reproductive system development | 87/2897 | 427/18723 | 3.69e-03 | 3.07e-02 | 87 |
| GO:00106341 | Colorectum | SER | positive regulation of epithelial cell migration | 41/2897 | 176/18723 | 4.03e-03 | 3.30e-02 | 41 |
| GO:00097911 | Colorectum | SER | post-embryonic development | 22/2897 | 80/18723 | 4.12e-03 | 3.36e-02 | 22 |
| GO:00310981 | Colorectum | SER | stress-activated protein kinase signaling cascade | 54/2897 | 247/18723 | 4.65e-03 | 3.67e-02 | 54 |
| GO:00719001 | Colorectum | SER | regulation of protein serine/threonine kinase activity | 74/2897 | 359/18723 | 5.22e-03 | 3.96e-02 | 74 |
| GO:00609641 | Colorectum | SER | regulation of gene silencing by miRNA | 15/2897 | 49/18723 | 5.70e-03 | 4.19e-02 | 15 |
| GO:00018411 | Colorectum | SER | neural tube formation | 26/2897 | 102/18723 | 5.87e-03 | 4.29e-02 | 26 |
| GO:00514031 | Colorectum | SER | stress-activated MAPK cascade | 52/2897 | 239/18723 | 5.96e-03 | 4.35e-02 | 52 |
| GO:0022408 | Colorectum | SER | negative regulation of cell-cell adhesion | 44/2897 | 196/18723 | 6.08e-03 | 4.42e-02 | 44 |
| GO:0035107 | Colorectum | SER | appendage morphogenesis | 33/2897 | 138/18723 | 6.10e-03 | 4.42e-02 | 33 |
| GO:0035108 | Colorectum | SER | limb morphogenesis | 33/2897 | 138/18723 | 6.10e-03 | 4.42e-02 | 33 |
| GO:00302241 | Colorectum | SER | monocyte differentiation | 12/2897 | 36/18723 | 6.11e-03 | 4.42e-02 | 12 |
| GO:00486081 | Colorectum | SER | reproductive structure development | 85/2897 | 424/18723 | 6.33e-03 | 4.56e-02 | 85 |
| GO:00226121 | Colorectum | SER | gland morphogenesis | 29/2897 | 118/18723 | 6.54e-03 | 4.68e-02 | 29 |
| GO:00015031 | Colorectum | SER | ossification | 82/2897 | 408/18723 | 6.76e-03 | 4.78e-02 | 82 |
| GO:00066061 | Colorectum | SER | protein import into nucleus | 36/2897 | 155/18723 | 7.07e-03 | 4.98e-02 | 36 |
| Pathway ID | Tissue | Disease Stage | Description | Gene Ratio | Bg Ratio | pvalue | p.adjust | qvalue | Count |
| hsa04919 | Colorectum | AD | Thyroid hormone signaling pathway | 51/2092 | 121/8465 | 1.71e-05 | 1.73e-04 | 1.10e-04 | 51 |
| hsa05418 | Colorectum | AD | Fluid shear stress and atherosclerosis | 54/2092 | 139/8465 | 1.41e-04 | 1.16e-03 | 7.37e-04 | 54 |
| hsa049191 | Colorectum | AD | Thyroid hormone signaling pathway | 51/2092 | 121/8465 | 1.71e-05 | 1.73e-04 | 1.10e-04 | 51 |
| hsa054181 | Colorectum | AD | Fluid shear stress and atherosclerosis | 54/2092 | 139/8465 | 1.41e-04 | 1.16e-03 | 7.37e-04 | 54 |
| hsa049192 | Colorectum | SER | Thyroid hormone signaling pathway | 40/1580 | 121/8465 | 1.02e-04 | 1.06e-03 | 7.67e-04 | 40 |
| hsa054182 | Colorectum | SER | Fluid shear stress and atherosclerosis | 40/1580 | 139/8465 | 2.28e-03 | 1.75e-02 | 1.27e-02 | 40 |
| hsa049193 | Colorectum | SER | Thyroid hormone signaling pathway | 40/1580 | 121/8465 | 1.02e-04 | 1.06e-03 | 7.67e-04 | 40 |
| hsa054183 | Colorectum | SER | Fluid shear stress and atherosclerosis | 40/1580 | 139/8465 | 2.28e-03 | 1.75e-02 | 1.27e-02 | 40 |
| hsa049194 | Colorectum | MSS | Thyroid hormone signaling pathway | 46/1875 | 121/8465 | 5.04e-05 | 4.97e-04 | 3.05e-04 | 46 |
| hsa054184 | Colorectum | MSS | Fluid shear stress and atherosclerosis | 51/1875 | 139/8465 | 6.06e-05 | 5.80e-04 | 3.55e-04 | 51 |
| hsa04390 | Colorectum | MSS | Hippo signaling pathway | 48/1875 | 157/8465 | 8.32e-03 | 3.10e-02 | 1.90e-02 | 48 |
| hsa049195 | Colorectum | MSS | Thyroid hormone signaling pathway | 46/1875 | 121/8465 | 5.04e-05 | 4.97e-04 | 3.05e-04 | 46 |
| hsa054185 | Colorectum | MSS | Fluid shear stress and atherosclerosis | 51/1875 | 139/8465 | 6.06e-05 | 5.80e-04 | 3.55e-04 | 51 |
| hsa043901 | Colorectum | MSS | Hippo signaling pathway | 48/1875 | 157/8465 | 8.32e-03 | 3.10e-02 | 1.90e-02 | 48 |
| hsa054186 | Colorectum | MSI-H | Fluid shear stress and atherosclerosis | 25/797 | 139/8465 | 1.11e-03 | 1.20e-02 | 1.01e-02 | 25 |
| hsa049196 | Colorectum | MSI-H | Thyroid hormone signaling pathway | 21/797 | 121/8465 | 4.18e-03 | 4.10e-02 | 3.44e-02 | 21 |
| hsa054187 | Colorectum | MSI-H | Fluid shear stress and atherosclerosis | 25/797 | 139/8465 | 1.11e-03 | 1.20e-02 | 1.01e-02 | 25 |
| hsa049197 | Colorectum | MSI-H | Thyroid hormone signaling pathway | 21/797 | 121/8465 | 4.18e-03 | 4.10e-02 | 3.44e-02 | 21 |
| hsa049198 | Colorectum | FAP | Thyroid hormone signaling pathway | 41/1404 | 121/8465 | 2.28e-06 | 4.28e-05 | 2.60e-05 | 41 |
| hsa054188 | Colorectum | FAP | Fluid shear stress and atherosclerosis | 45/1404 | 139/8465 | 3.05e-06 | 4.63e-05 | 2.81e-05 | 45 |
| Hugo Symbol | Variant Class | Variant Classification | dbSNP RS | HGVSc | HGVSp | HGVSp Short | SWISSPROT | BIOTYPE | SIFT | PolyPhen | Tumor Sample Barcode | Tissue | Histology | Sex | Age | Stage | Therapy Types | Drugs | Outcome |
| BMP4 | SNV | Missense_Mutation | | c.404A>T | p.Asn135Ile | p.N135I | P12644 | protein_coding | tolerated(0.12) | benign(0.1) | TCGA-AN-A0AR-01 | Breast | breast invasive carcinoma | Female | <65 | I/II | Unknown | Unknown | SD |
| BMP4 | SNV | Missense_Mutation | rs747238009 | c.340N>T | p.Ala114Ser | p.A114S | P12644 | protein_coding | deleterious(0.04) | probably_damaging(0.999) | TCGA-E9-A295-01 | Breast | breast invasive carcinoma | Female | >=65 | I/II | Hormone Therapy | tamoxiphen | SD |
| BMP4 | deletion | Frame_Shift_Del | novel | c.179delN | p.Thr60AsnfsTer58 | p.T60Nfs*58 | P12644 | protein_coding | | | TCGA-D8-A27V-01 | Breast | breast invasive carcinoma | Female | <65 | I/II | Hormone Therapy | tamoxiphen | SD |
| BMP4 | SNV | Missense_Mutation | rs750868626 | c.1223N>A | p.Arg408His | p.R408H | P12644 | protein_coding | deleterious(0) | probably_damaging(0.999) | TCGA-2W-A8YY-01 | Cervix | cervical & endocervical cancer | Female | <65 | I/II | Chemotherapy | cisplatin | CR |
| BMP4 | SNV | Missense_Mutation | rs773416502 | c.484N>T | p.Arg162Trp | p.R162W | P12644 | protein_coding | deleterious(0) | probably_damaging(1) | TCGA-2W-A8YY-01 | Cervix | cervical & endocervical cancer | Female | <65 | I/II | Chemotherapy | cisplatin | CR |
| BMP4 | SNV | Missense_Mutation | novel | c.646N>C | p.Asp216His | p.D216H | P12644 | protein_coding | deleterious(0) | probably_damaging(0.946) | TCGA-C5-A2LZ-01 | Cervix | cervical & endocervical cancer | Female | >=65 | III/IV | Unknown | Unknown | PD |
| BMP4 | SNV | Missense_Mutation | | c.464N>G | p.Ser155Cys | p.S155C | P12644 | protein_coding | deleterious(0.01) | probably_damaging(0.976) | TCGA-IR-A3LL-01 | Cervix | cervical & endocervical cancer | Female | <65 | I/II | Chemotherapy | cisplatin | CR |
| BMP4 | SNV | Missense_Mutation | | c.313N>C | p.Glu105Gln | p.E105Q | P12644 | protein_coding | tolerated(0.7) | benign(0.015) | TCGA-UC-A7PF-01 | Cervix | cervical & endocervical cancer | Female | <65 | I/II | Unknown | Unknown | SD |
| BMP4 | SNV | Missense_Mutation | novel | c.239N>T | p.Pro80Leu | p.P80L | P12644 | protein_coding | deleterious(0) | probably_damaging(0.995) | TCGA-VS-A959-01 | Cervix | cervical & endocervical cancer | Female | >=65 | I/II | Unknown | Unknown | SD |
| BMP4 | SNV | Missense_Mutation | novel | c.1154A>G | p.Tyr385Cys | p.Y385C | P12644 | protein_coding | deleterious(0) | probably_damaging(1) | TCGA-AA-3811-01 | Colorectum | colon adenocarcinoma | Female | >=65 | III/IV | Unknown | Unknown | PD |


