
|
|||||
|
 | |
| |
| |
| |
| |
| |
|
Gene: BASP1 |
Gene summary for BASP1 |
| Gene information | Species | Human | Gene symbol | BASP1 | Gene ID | 10409 |
| Gene name | brain abundant membrane attached signal protein 1 | |
| Gene Alias | CAP-23 | |
| Cytomap | 5p15.1 | |
| Gene Type | protein-coding | GO ID | GO:0000003 | UniProtAcc | P80723 |
Top |
Malignant transformation analysis |
| Identification of the aberrant gene expression in precancerous and cancerous lesions by comparing the gene expression of stem-like cells in diseased tissues with normal stem cells |
| Entrez ID | Symbol | Replicates | Species | Organ | Tissue | Adj P-value | Log2FC | Malignancy |
| 10409 | BASP1 | GSM4909281 | Human | Breast | IDC | 2.18e-11 | 3.13e-01 | 0.21 |
| 10409 | BASP1 | GSM4909285 | Human | Breast | IDC | 5.23e-25 | 5.22e-01 | 0.21 |
| 10409 | BASP1 | GSM4909286 | Human | Breast | IDC | 2.18e-23 | 4.24e-01 | 0.1081 |
| 10409 | BASP1 | GSM4909307 | Human | Breast | IDC | 1.69e-14 | 4.29e-01 | 0.1569 |
| 10409 | BASP1 | GSM4909308 | Human | Breast | IDC | 4.50e-57 | 9.22e-01 | 0.158 |
| 10409 | BASP1 | M5 | Human | Breast | IDC | 4.50e-02 | 5.14e-01 | 0.1598 |
| 10409 | BASP1 | HTA11_7663_2000001011 | Human | Colorectum | SER | 5.80e-03 | 6.62e-01 | 0.0131 |
| 10409 | BASP1 | HTA11_10623_2000001011 | Human | Colorectum | AD | 6.10e-05 | 5.20e-01 | -0.0177 |
| 10409 | BASP1 | AEH-subject2 | Human | Endometrium | AEH | 1.11e-02 | -1.31e-01 | -0.2525 |
| 10409 | BASP1 | AEH-subject4 | Human | Endometrium | AEH | 1.34e-02 | -1.17e-01 | -0.2657 |
| 10409 | BASP1 | AEH-subject5 | Human | Endometrium | AEH | 1.65e-02 | -2.85e-01 | -0.2953 |
| 10409 | BASP1 | EEC-subject1 | Human | Endometrium | EEC | 5.20e-04 | -8.52e-02 | -0.2682 |
| 10409 | BASP1 | EEC-subject2 | Human | Endometrium | EEC | 5.72e-19 | -4.93e-01 | -0.2607 |
| 10409 | BASP1 | EEC-subject3 | Human | Endometrium | EEC | 2.73e-22 | -2.17e-01 | -0.2525 |
| 10409 | BASP1 | EEC-subject4 | Human | Endometrium | EEC | 2.39e-11 | -4.03e-01 | -0.2571 |
| 10409 | BASP1 | EEC-subject5 | Human | Endometrium | EEC | 1.58e-17 | -4.94e-01 | -0.249 |
| 10409 | BASP1 | GSM5276934 | Human | Endometrium | EEC | 4.73e-02 | -8.56e-02 | -0.0913 |
| 10409 | BASP1 | GSM5276935 | Human | Endometrium | EEC | 6.05e-08 | 3.43e-01 | -0.123 |
| 10409 | BASP1 | GSM5276937 | Human | Endometrium | EEC | 1.28e-04 | -2.61e-01 | -0.0897 |
| 10409 | BASP1 | GSM6177620_NYU_UCEC1_lib1_lib1 | Human | Endometrium | EEC | 9.93e-33 | 7.74e-02 | -0.1869 |
| Page: 1 2 3 4 5 6 |
| Tissue | Expression Dynamics | Abbreviation |
| Breast |  | IDC: Invasive ductal carcinoma |
| DCIS: Ductal carcinoma in situ | ||
| Precancer(BRCA1-mut): Precancerous lesion from BRCA1 mutation carriers | ||
| Colorectum (GSE201348) | 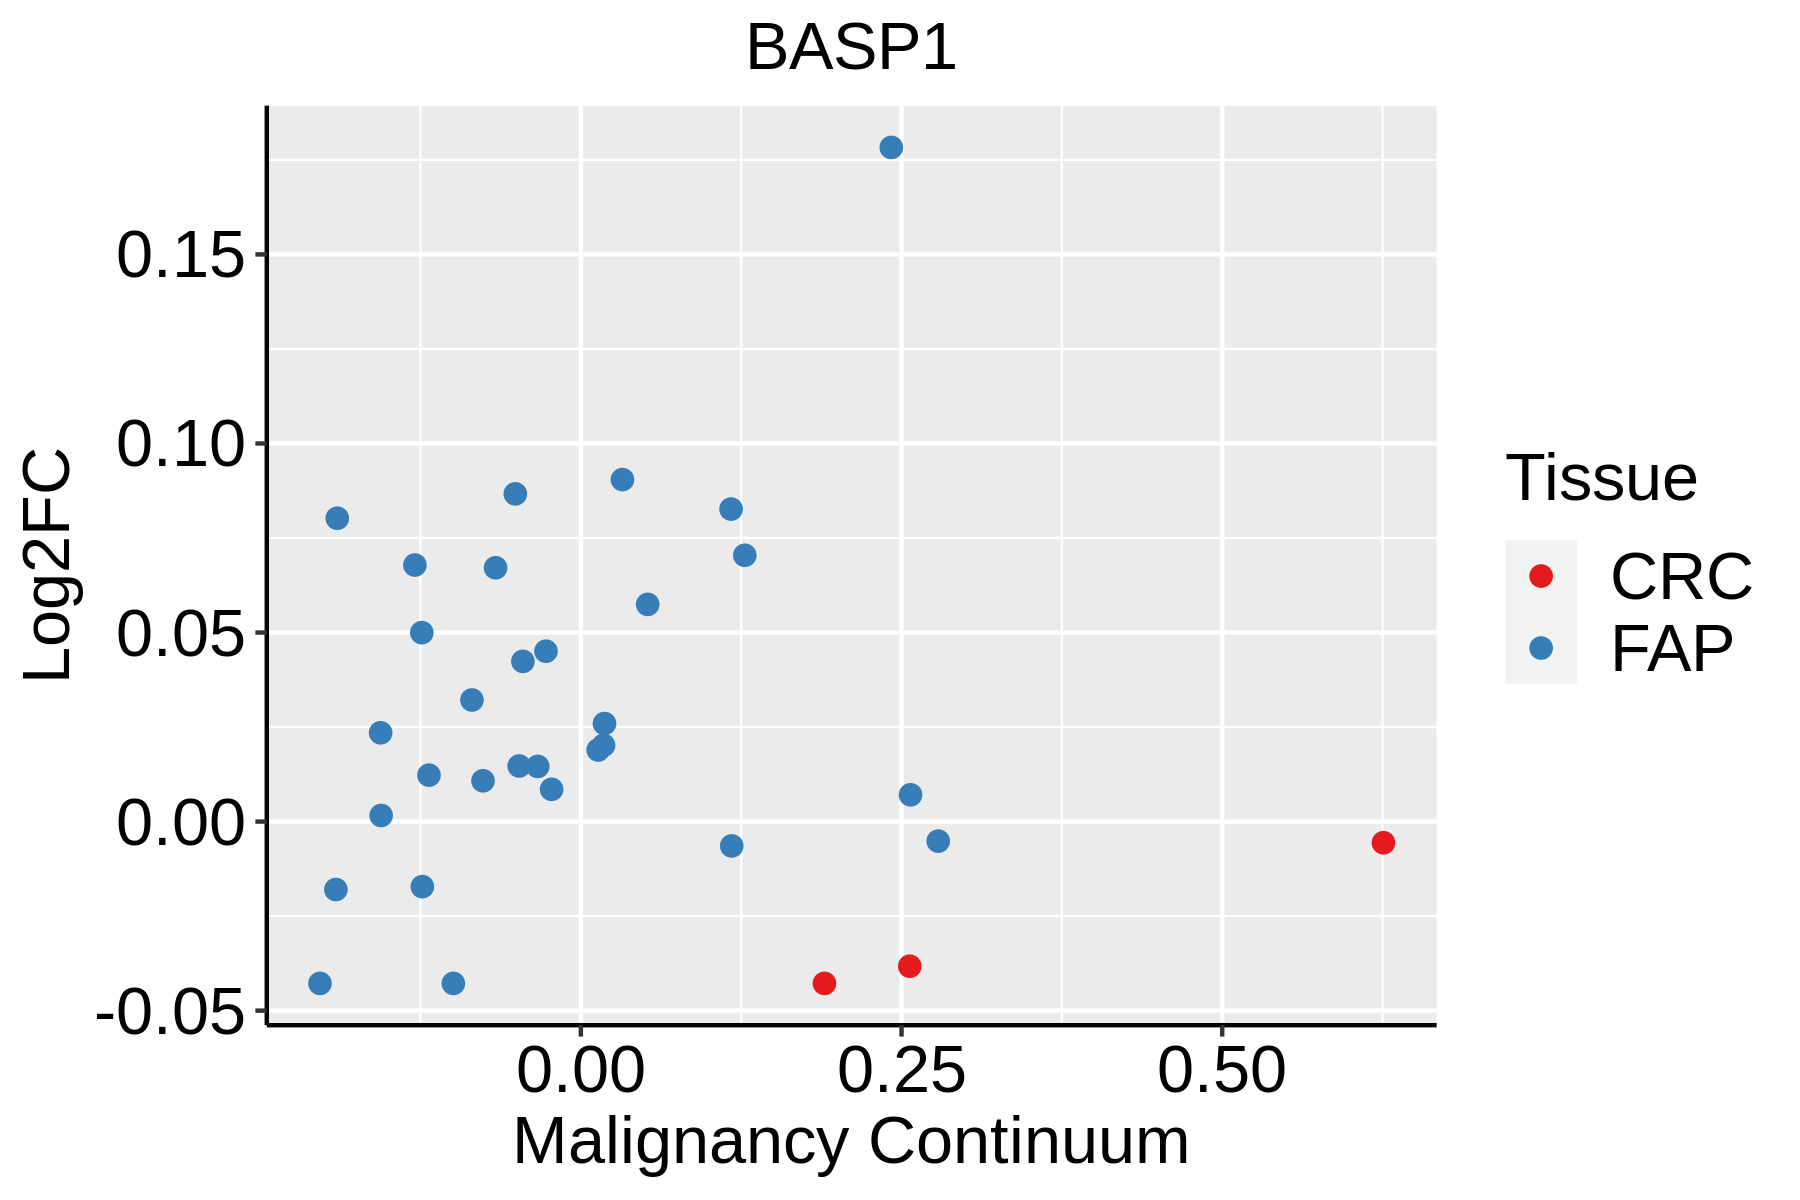 | FAP: Familial adenomatous polyposis |
| CRC: Colorectal cancer | ||
| Colorectum (HTA11) | 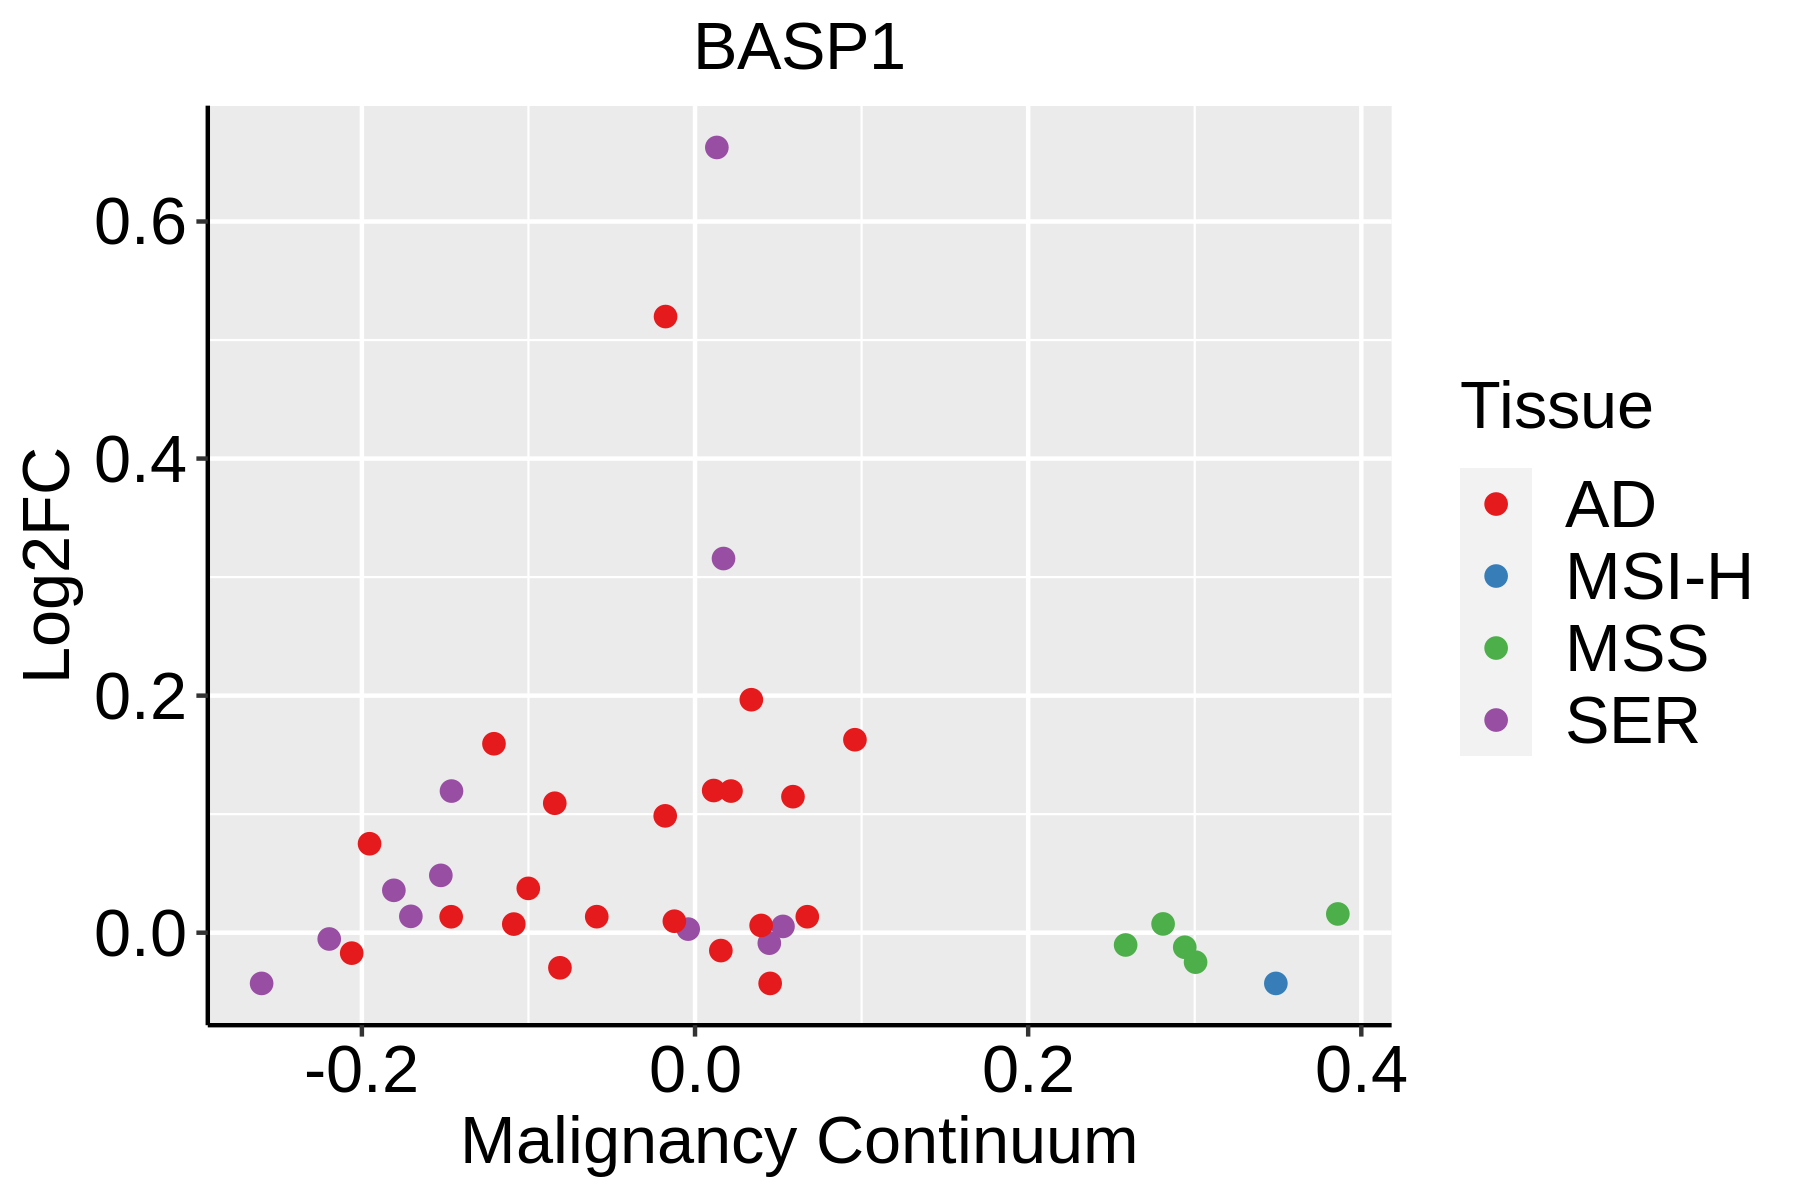 | AD: Adenomas |
| SER: Sessile serrated lesions | ||
| MSI-H: Microsatellite-high colorectal cancer | ||
| MSS: Microsatellite stable colorectal cancer | ||
| Endometrium |  | AEH: Atypical endometrial hyperplasia |
| EEC: Endometrioid Cancer | ||
| Esophagus |  | ESCC: Esophageal squamous cell carcinoma |
| HGIN: High-grade intraepithelial neoplasias | ||
| LGIN: Low-grade intraepithelial neoplasias | ||
| Oral Cavity | 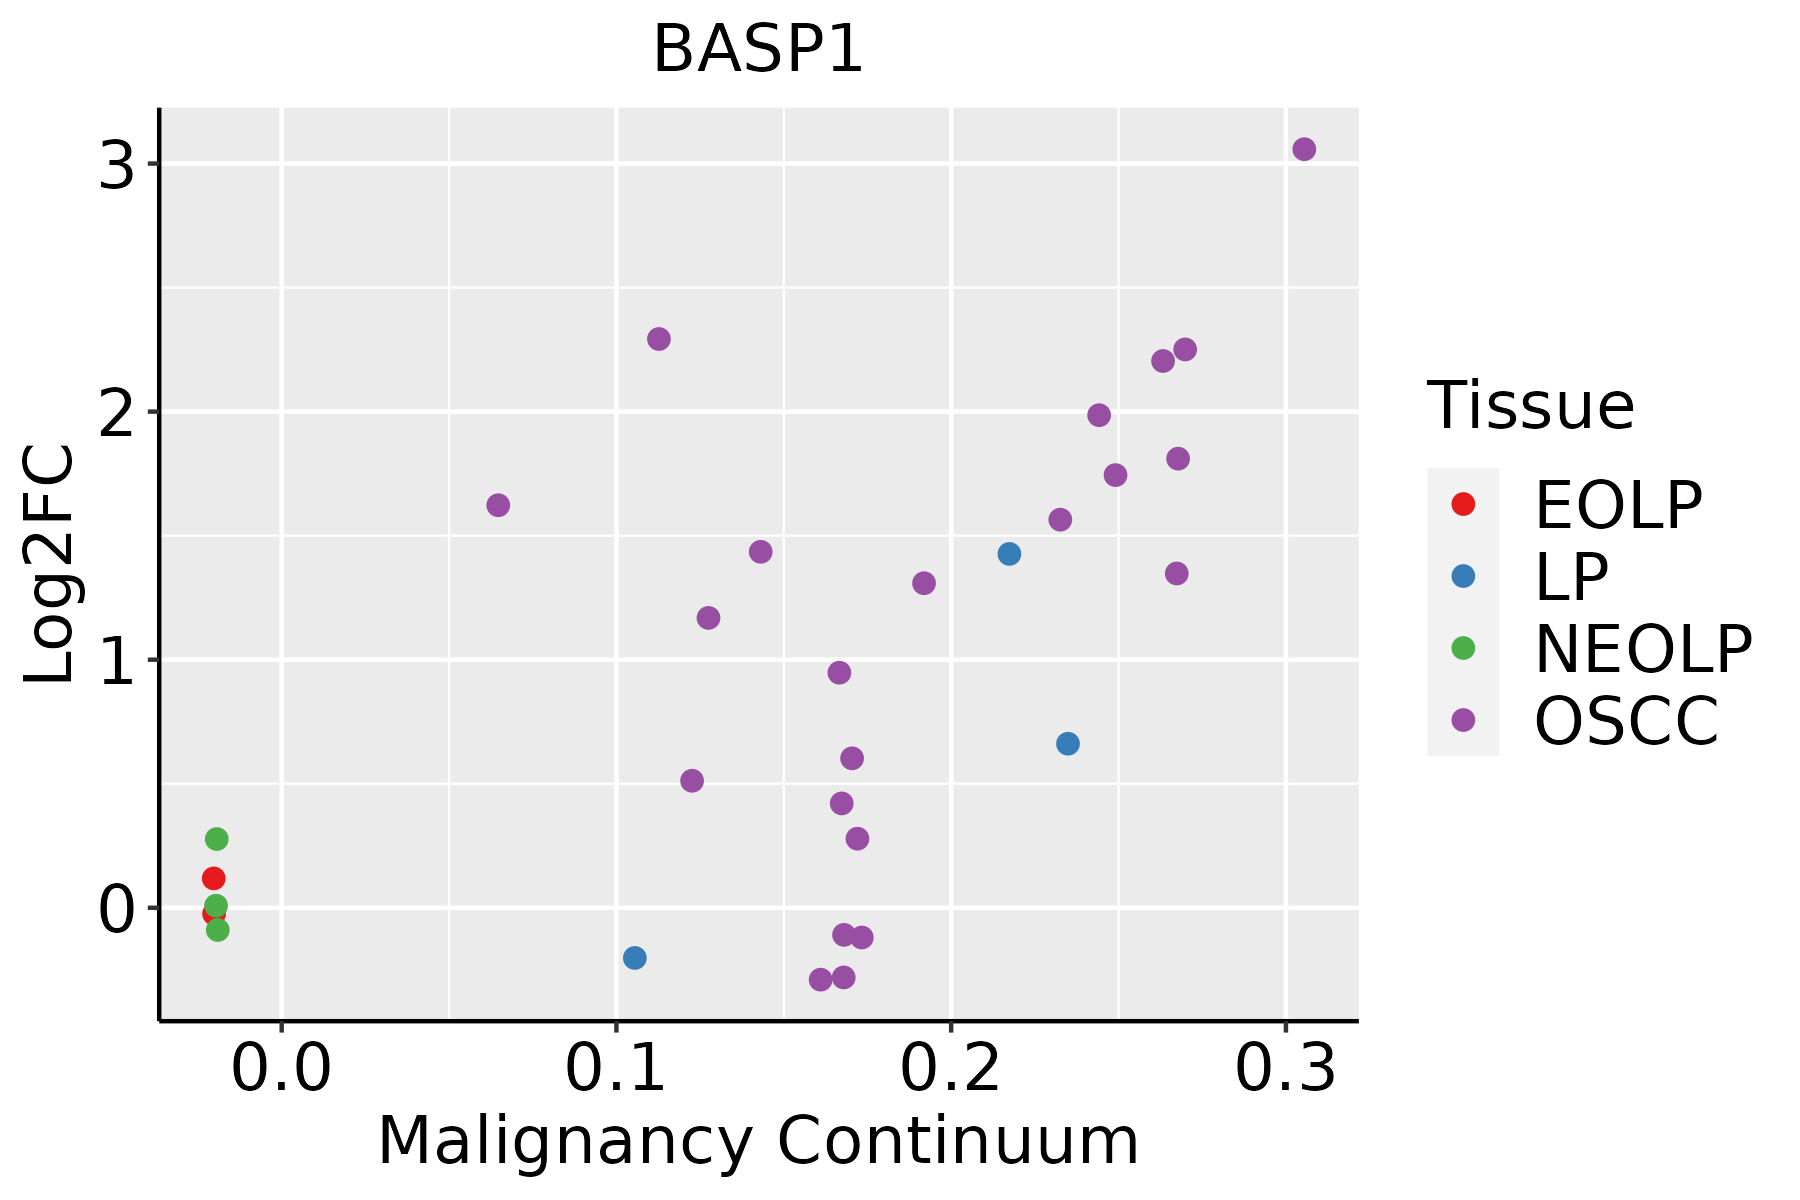 | EOLP: Erosive Oral lichen planus |
| LP: leukoplakia | ||
| NEOLP: Non-erosive oral lichen planus | ||
| OSCC: Oral squamous cell carcinoma | ||
| Prostate | 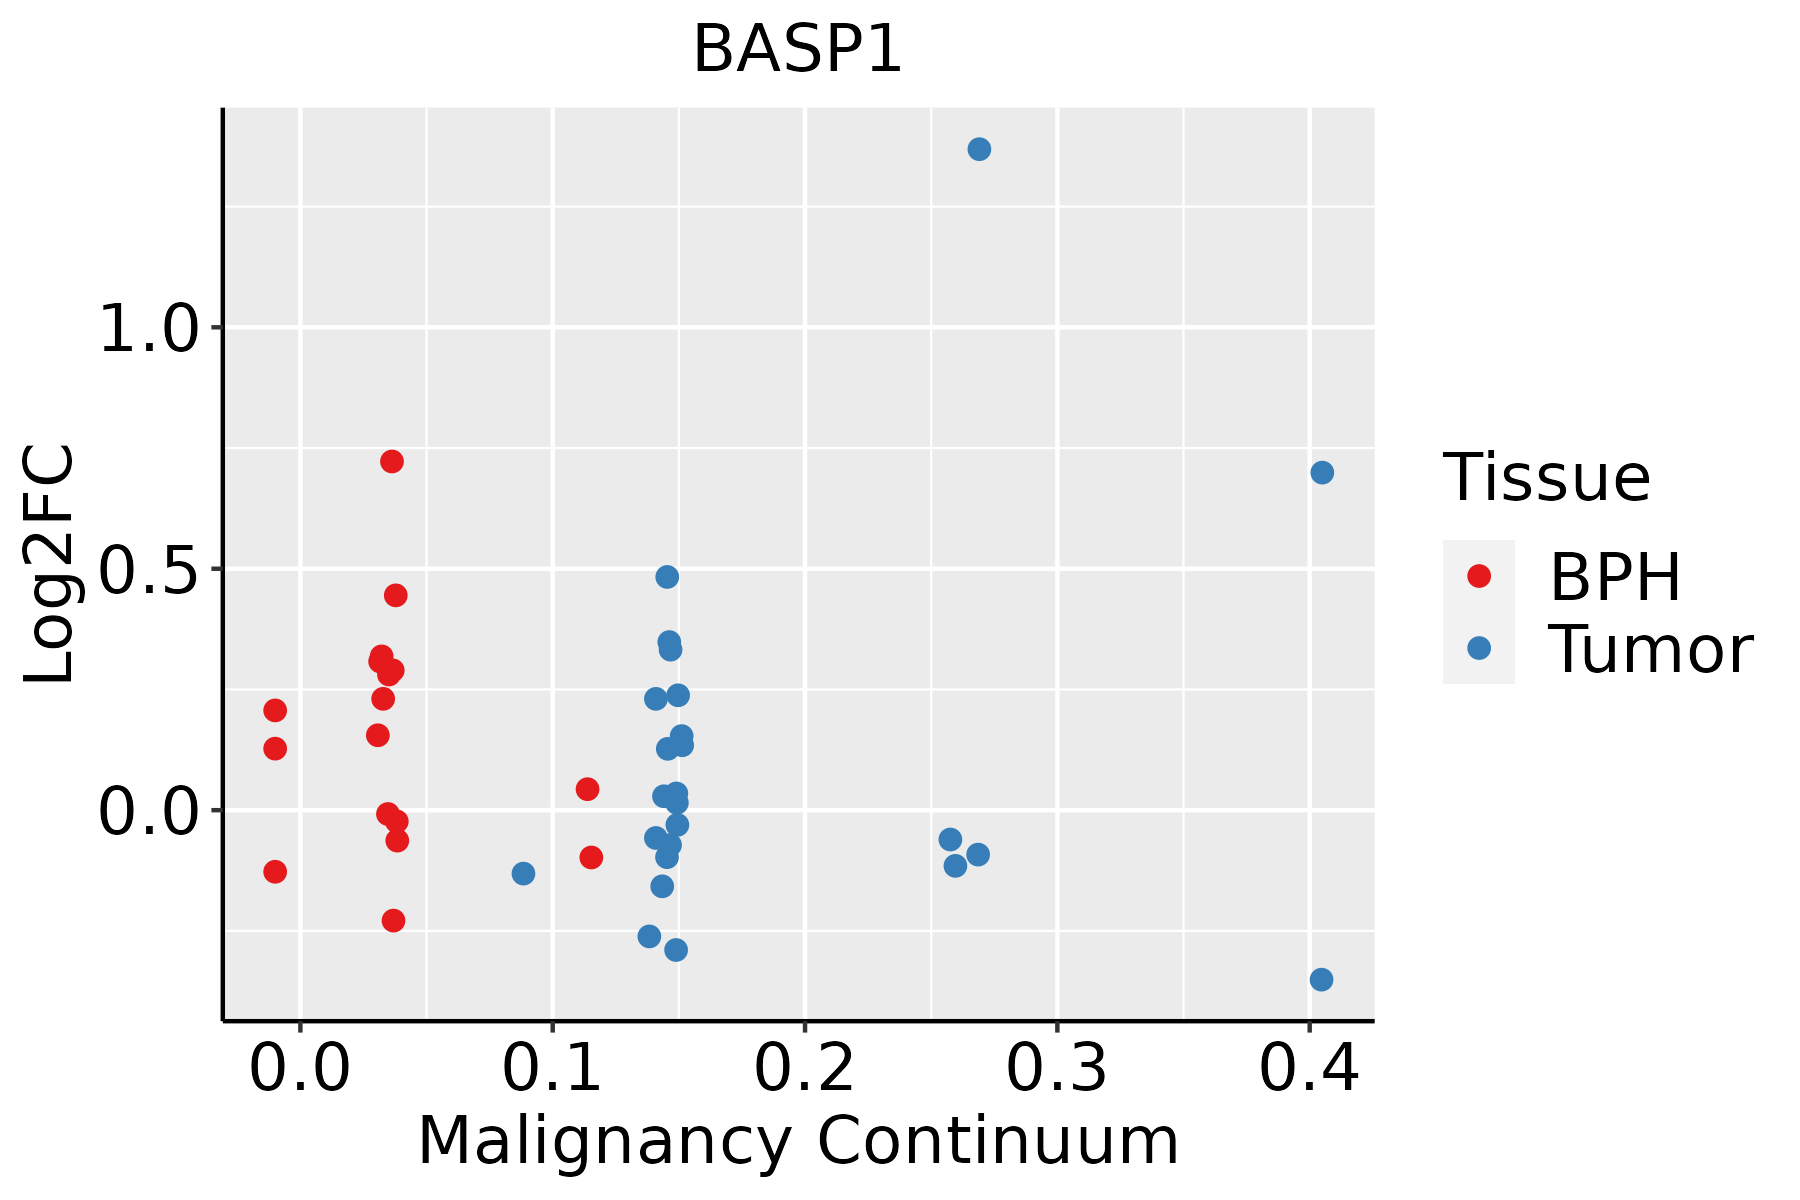 | BPH: Benign Prostatic Hyperplasia |
| Skin |  | AK: Actinic keratosis |
| cSCC: Cutaneous squamous cell carcinoma | ||
| SCCIS:squamous cell carcinoma in situ | ||
| Thyroid | 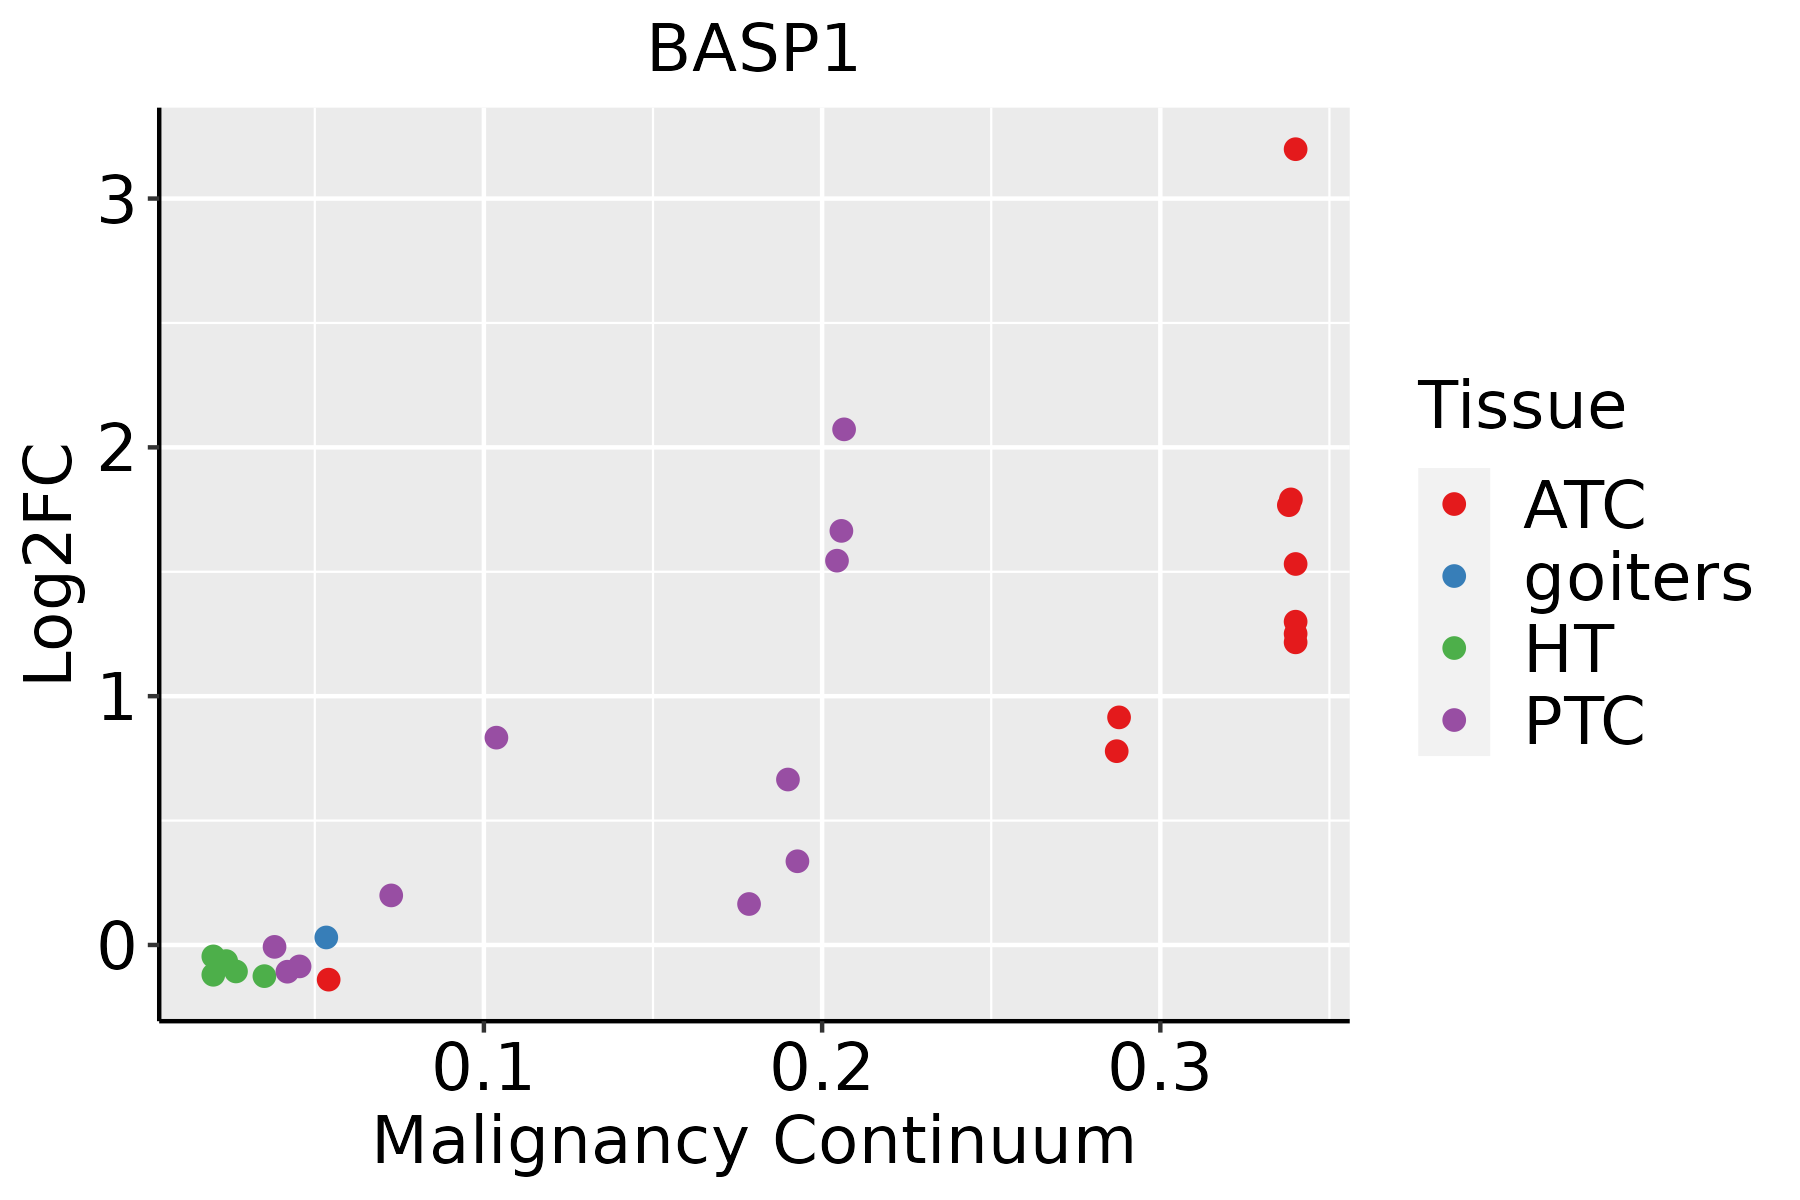 | ATC: Anaplastic thyroid cancer |
| HT: Hashimoto's thyroiditis | ||
| PTC: Papillary thyroid cancer |
| ∗log2FC in expression of this searched gene in stem-like cells from each diseased tissue sample relative to stem-like cells in normal samples in each tissue plotted against the malignancy continuum. Samples are colored based on if they are from different disease stage. |
Top |
Malignant transformation related pathway analysis |
| Find out the enriched GO biological processes and KEGG pathways involved in transition from healthy to precancer to cancer |
| Tissue | Disease Stage | Enriched GO biological Processes |
| Colorectum | AD |  |
| Colorectum | SER |  |
| Colorectum | MSS |  |
| Colorectum | MSI-H |  |
| Colorectum | FAP |  |
| ∗Top 15 enriched GO BP terms are showed in the bar plot of each disease state in each tissue. Each row represents a significant GO biological process which is colored according to the -log10(p.adjust). |
| Page: 1 2 3 4 5 6 7 8 9 |
| GO ID | Tissue | Disease Stage | Description | Gene Ratio | Bg Ratio | pvalue | p.adjust | Count |
| GO:000182213 | Prostate | Tumor | kidney development | 74/3246 | 293/18723 | 3.68e-04 | 2.87e-03 | 74 |
| GO:004592715 | Prostate | Tumor | positive regulation of growth | 66/3246 | 259/18723 | 5.73e-04 | 4.13e-03 | 66 |
| GO:007200113 | Prostate | Tumor | renal system development | 75/3246 | 302/18723 | 5.74e-04 | 4.13e-03 | 75 |
| GO:007200913 | Prostate | Tumor | nephron epithelium development | 31/3246 | 109/18723 | 2.70e-03 | 1.48e-02 | 31 |
| GO:006054113 | Prostate | Tumor | respiratory system development | 51/3246 | 203/18723 | 3.11e-03 | 1.64e-02 | 51 |
| GO:000165612 | Prostate | Tumor | metanephros development | 25/3246 | 85/18723 | 4.12e-03 | 2.08e-02 | 25 |
| GO:000165712 | Prostate | Tumor | ureteric bud development | 26/3246 | 91/18723 | 5.32e-03 | 2.54e-02 | 26 |
| GO:007200613 | Prostate | Tumor | nephron development | 37/3246 | 142/18723 | 5.73e-03 | 2.67e-02 | 37 |
| GO:000182312 | Prostate | Tumor | mesonephros development | 27/3246 | 96/18723 | 5.77e-03 | 2.68e-02 | 27 |
| GO:006053812 | Prostate | Tumor | skeletal muscle organ development | 42/3246 | 166/18723 | 5.98e-03 | 2.77e-02 | 42 |
| GO:007216312 | Prostate | Tumor | mesonephric epithelium development | 26/3246 | 92/18723 | 6.22e-03 | 2.87e-02 | 26 |
| GO:007216412 | Prostate | Tumor | mesonephric tubule development | 26/3246 | 92/18723 | 6.22e-03 | 2.87e-02 | 26 |
| GO:000751713 | Prostate | Tumor | muscle organ development | 74/3246 | 327/18723 | 8.03e-03 | 3.54e-02 | 74 |
| GO:004863813 | Prostate | Tumor | regulation of developmental growth | 74/3246 | 330/18723 | 1.00e-02 | 4.20e-02 | 74 |
| GO:003585012 | Prostate | Tumor | epithelial cell differentiation involved in kidney development | 15/3246 | 47/18723 | 1.07e-02 | 4.45e-02 | 15 |
| GO:002176225 | Skin | cSCC | substantia nigra development | 27/4864 | 44/18723 | 7.90e-07 | 1.46e-05 | 27 |
| GO:0030901110 | Skin | cSCC | midbrain development | 45/4864 | 90/18723 | 8.81e-07 | 1.63e-05 | 45 |
| GO:006145825 | Skin | cSCC | reproductive system development | 149/4864 | 427/18723 | 2.30e-05 | 2.65e-04 | 149 |
| GO:004860824 | Skin | cSCC | reproductive structure development | 148/4864 | 424/18723 | 2.40e-05 | 2.74e-04 | 148 |
| GO:004885719 | Skin | cSCC | neural nucleus development | 28/4864 | 64/18723 | 1.52e-03 | 9.52e-03 | 28 |
| Page: 1 2 3 4 5 6 7 8 9 10 11 12 |
| Pathway ID | Tissue | Disease Stage | Description | Gene Ratio | Bg Ratio | pvalue | p.adjust | qvalue | Count |
| Page: 1 |
Top |
Cell-cell communication analysis |
| Identification of potential cell-cell interactions between two cell types and their ligand-receptor pairs for different disease states |
| Ligand | Receptor | LRpair | Pathway | Tissue | Disease Stage |
| Page: 1 |
Top |
Single-cell gene regulatory network inference analysis |
| Find out the significant the regulons (TFs) and the target genes of each regulon across cell types for different disease states |
| TF | Cell Type | Tissue | Disease Stage | Target Gene | RSS | Regulon Activity |
| ∗The dot plots of a searched regulon are shown for all cell subpopulations in each disease state of each tissue based on the regulon specific score inferred using pySCENIC and by calculating the average expression. |
| Page: 1 |
Top |
Somatic mutation of malignant transformation related genes |
| Annotation of somatic variants for genes involved in malignant transformation |
| Hugo Symbol | Variant Class | Variant Classification | dbSNP RS | HGVSc | HGVSp | HGVSp Short | SWISSPROT | BIOTYPE | SIFT | PolyPhen | Tumor Sample Barcode | Tissue | Histology | Sex | Age | Stage | Therapy Types | Drugs | Outcome |
| BASP1 | SNV | Missense_Mutation | c.131N>A | p.Ala44Glu | p.A44E | P80723 | protein_coding | deleterious(0.02) | benign(0.033) | TCGA-WT-AB44-01 | Breast | breast invasive carcinoma | Female | >=65 | I/II | Hormone Therapy | arimidex | SD | |
| BASP1 | SNV | Missense_Mutation | novel | c.626C>A | p.Pro209His | p.P209H | P80723 | protein_coding | deleterious(0.03) | benign(0.382) | TCGA-2W-A8YY-01 | Cervix | cervical & endocervical cancer | Female | <65 | I/II | Chemotherapy | cisplatin | CR |
| BASP1 | SNV | Missense_Mutation | c.110C>T | p.Pro37Leu | p.P37L | P80723 | protein_coding | deleterious(0.01) | possibly_damaging(0.891) | TCGA-AA-3833-01 | Colorectum | colon adenocarcinoma | Female | <65 | I/II | Unknown | Unknown | SD | |
| BASP1 | SNV | Missense_Mutation | c.380C>T | p.Ala127Val | p.A127V | P80723 | protein_coding | tolerated(0.15) | benign(0.015) | TCGA-CM-6675-01 | Colorectum | colon adenocarcinoma | Male | <65 | I/II | Chemotherapy | fluorouracil | PD | |
| BASP1 | SNV | Missense_Mutation | c.215N>T | p.Glu72Val | p.E72V | P80723 | protein_coding | tolerated(0.13) | benign(0.026) | TCGA-D5-6928-01 | Colorectum | colon adenocarcinoma | Male | >=65 | I/II | Unknown | Unknown | SD | |
| BASP1 | SNV | Missense_Mutation | c.86N>T | p.Ala29Val | p.A29V | P80723 | protein_coding | deleterious(0.01) | possibly_damaging(0.494) | TCGA-G4-6302-01 | Colorectum | colon adenocarcinoma | Female | >=65 | I/II | Unknown | Unknown | SD | |
| BASP1 | SNV | Missense_Mutation | rs767831759 | c.184G>A | p.Ala62Thr | p.A62T | P80723 | protein_coding | tolerated(0.05) | benign(0.013) | TCGA-DC-4745-01 | Colorectum | rectum adenocarcinoma | Female | <65 | III/IV | Chemotherapy | 5-fluorouracil | SD |
| BASP1 | SNV | Missense_Mutation | novel | c.207G>T | p.Lys69Asn | p.K69N | P80723 | protein_coding | deleterious(0) | probably_damaging(0.985) | TCGA-A5-A7WJ-01 | Endometrium | uterine corpus endometrioid carcinoma | Female | <65 | I/II | Unknown | Unknown | SD |
| BASP1 | SNV | Missense_Mutation | c.11A>C | p.Lys4Thr | p.K4T | P80723 | protein_coding | deleterious(0) | probably_damaging(0.999) | TCGA-AP-A056-01 | Endometrium | uterine corpus endometrioid carcinoma | Female | <65 | I/II | Unknown | Unknown | SD | |
| BASP1 | SNV | Missense_Mutation | novel | c.77N>T | p.Ala26Val | p.A26V | P80723 | protein_coding | tolerated(0.09) | possibly_damaging(0.575) | TCGA-AX-A0J1-01 | Endometrium | uterine corpus endometrioid carcinoma | Female | >=65 | I/II | Unknown | Unknown | SD |
| Page: 1 2 3 |
Top |
Related drugs of malignant transformation related genes |
| Identification of chemicals and drugs interact with genes involved in malignant transfromation |
| (DGIdb 4.0) |
| Entrez ID | Symbol | Category | Interaction Types | Drug Claim Name | Drug Name | PMIDs |
| Page: 1 |

Copyright 2023-Present -The University of Texas Health Science Center at Houston |