
|
|||||
|
 | |
| |
| |
| |
| |
| |
|
Gene: ATP6AP2 |
Gene summary for ATP6AP2 |
| Gene information | Species | Human | Gene symbol | ATP6AP2 | Gene ID | 10159 |
| Gene name | ATPase H+ transporting accessory protein 2 | |
| Gene Alias | APT6M8-9 | |
| Cytomap | Xp11.4 | |
| Gene Type | protein-coding | GO ID | GO:0000165 | UniProtAcc | O75787 |
Top |
Malignant transformation analysis |
| Identification of the aberrant gene expression in precancerous and cancerous lesions by comparing the gene expression of stem-like cells in diseased tissues with normal stem cells |
| Entrez ID | Symbol | Replicates | Species | Organ | Tissue | Adj P-value | Log2FC | Malignancy |
| 10159 | ATP6AP2 | AEH-subject1 | Human | Endometrium | AEH | 6.07e-22 | -4.79e-01 | -0.3059 |
| 10159 | ATP6AP2 | AEH-subject2 | Human | Endometrium | AEH | 8.51e-16 | -4.00e-01 | -0.2525 |
| 10159 | ATP6AP2 | AEH-subject3 | Human | Endometrium | AEH | 1.22e-16 | -3.18e-01 | -0.2576 |
| 10159 | ATP6AP2 | AEH-subject4 | Human | Endometrium | AEH | 6.82e-11 | -3.10e-01 | -0.2657 |
| 10159 | ATP6AP2 | AEH-subject5 | Human | Endometrium | AEH | 6.45e-16 | -4.28e-01 | -0.2953 |
| 10159 | ATP6AP2 | EEC-subject1 | Human | Endometrium | EEC | 7.48e-15 | -3.68e-01 | -0.2682 |
| 10159 | ATP6AP2 | EEC-subject2 | Human | Endometrium | EEC | 5.58e-30 | -5.48e-01 | -0.2607 |
| 10159 | ATP6AP2 | EEC-subject3 | Human | Endometrium | EEC | 5.89e-39 | -4.97e-01 | -0.2525 |
| 10159 | ATP6AP2 | EEC-subject4 | Human | Endometrium | EEC | 5.07e-10 | -2.39e-01 | -0.2571 |
| 10159 | ATP6AP2 | EEC-subject5 | Human | Endometrium | EEC | 1.60e-08 | -2.93e-01 | -0.249 |
| 10159 | ATP6AP2 | GSM5276934 | Human | Endometrium | EEC | 2.93e-04 | -1.42e-01 | -0.0913 |
| 10159 | ATP6AP2 | GSM6177620_NYU_UCEC1_lib1_lib1 | Human | Endometrium | EEC | 2.48e-39 | -3.67e-01 | -0.1869 |
| 10159 | ATP6AP2 | GSM6177620_NYU_UCEC1_lib2_lib2 | Human | Endometrium | EEC | 2.29e-36 | -4.19e-01 | -0.1875 |
| 10159 | ATP6AP2 | GSM6177620_NYU_UCEC1_lib3_lib3 | Human | Endometrium | EEC | 1.09e-50 | -3.68e-01 | -0.1883 |
| 10159 | ATP6AP2 | GSM6177621_NYU_UCEC2_lib1_lib1 | Human | Endometrium | EEC | 6.99e-38 | -1.19e-01 | -0.1934 |
| 10159 | ATP6AP2 | GSM6177622_NYU_UCEC3_lib1_lib1 | Human | Endometrium | EEC | 2.54e-55 | -4.94e-01 | -0.1917 |
| 10159 | ATP6AP2 | GSM6177622_NYU_UCEC3_lib2_lib2 | Human | Endometrium | EEC | 2.29e-51 | -4.36e-01 | -0.1916 |
| 10159 | ATP6AP2 | GSM6177623_NYU_UCEC3_Vis | Human | Endometrium | EEC | 7.90e-06 | -4.37e-02 | -0.1269 |
| 10159 | ATP6AP2 | LZE4T | Human | Esophagus | ESCC | 1.54e-22 | 8.56e-01 | 0.0811 |
| 10159 | ATP6AP2 | LZE5T | Human | Esophagus | ESCC | 1.58e-03 | 5.73e-01 | 0.0514 |
| Page: 1 2 3 4 5 6 7 8 |
| Tissue | Expression Dynamics | Abbreviation |
| Endometrium | 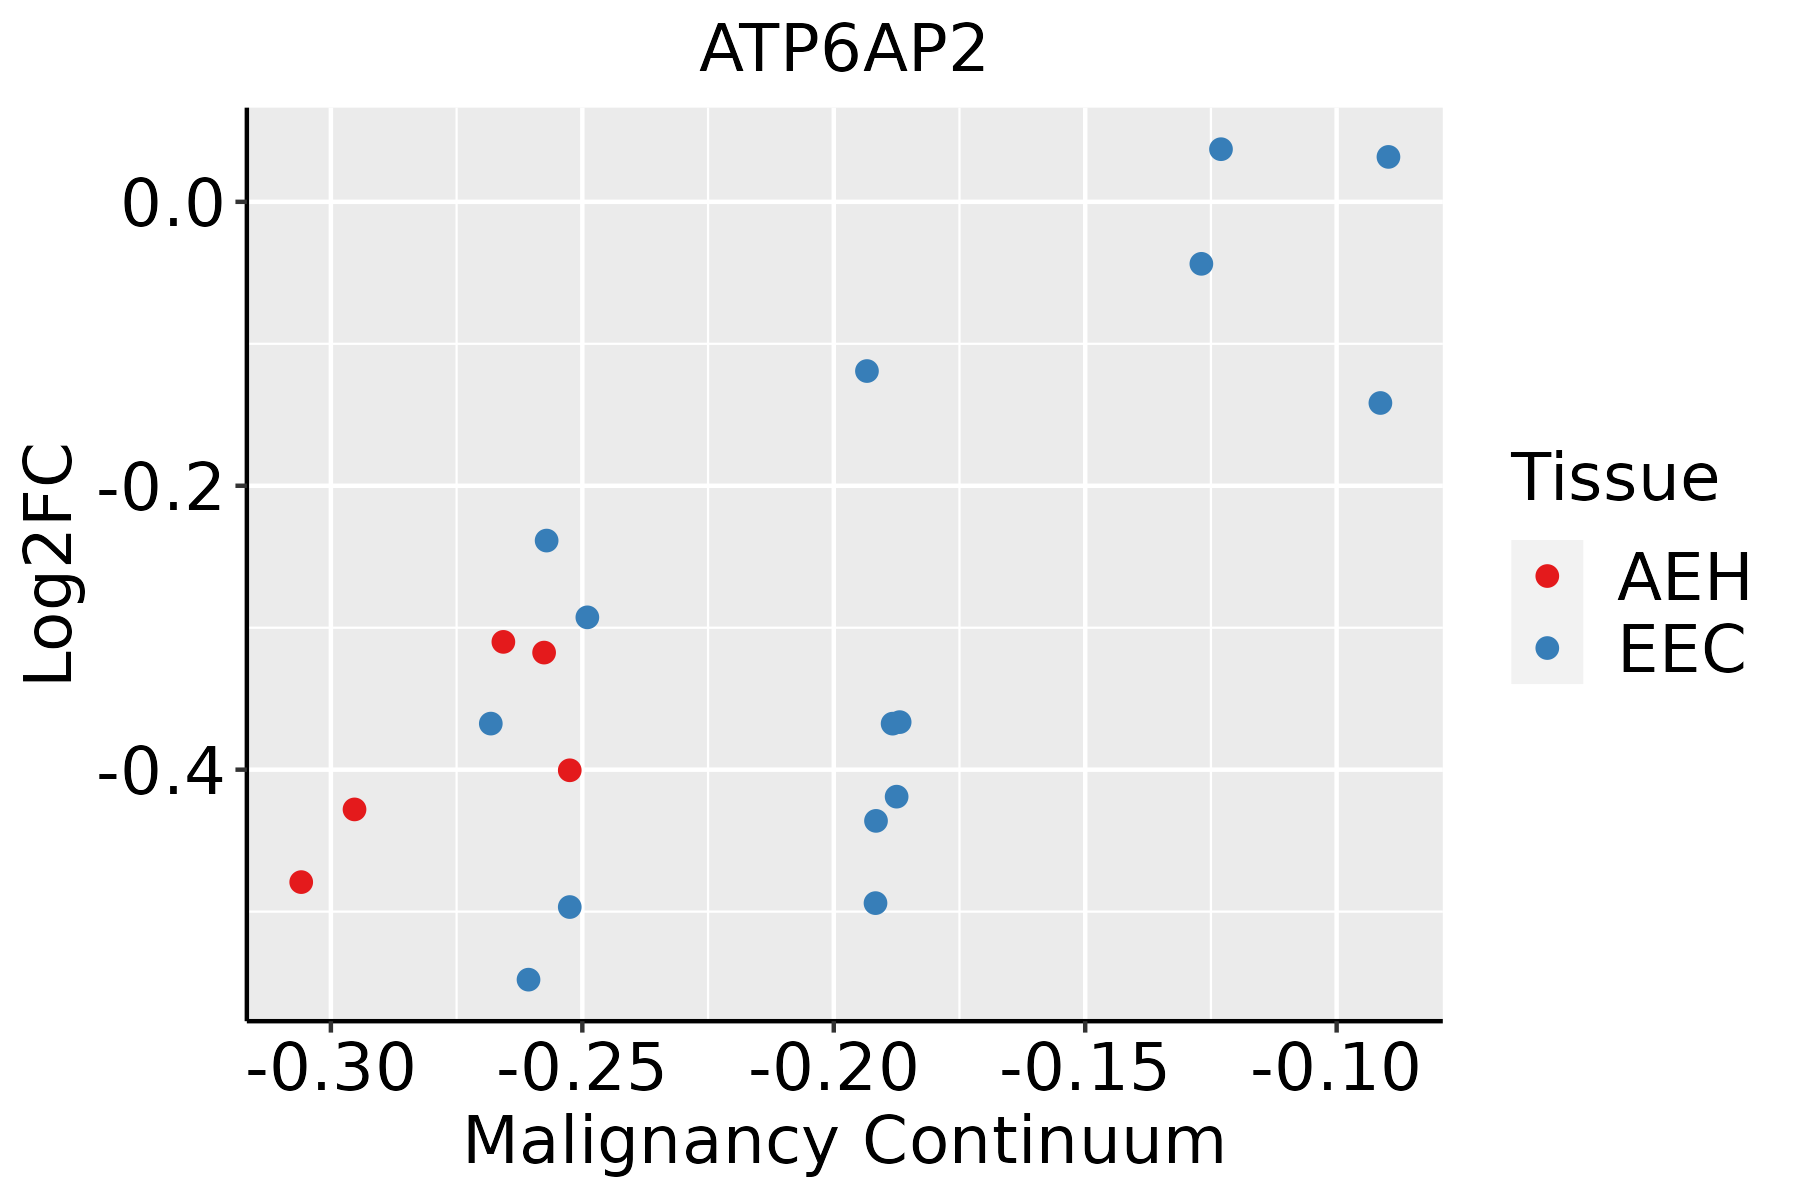 | AEH: Atypical endometrial hyperplasia |
| EEC: Endometrioid Cancer | ||
| Esophagus | 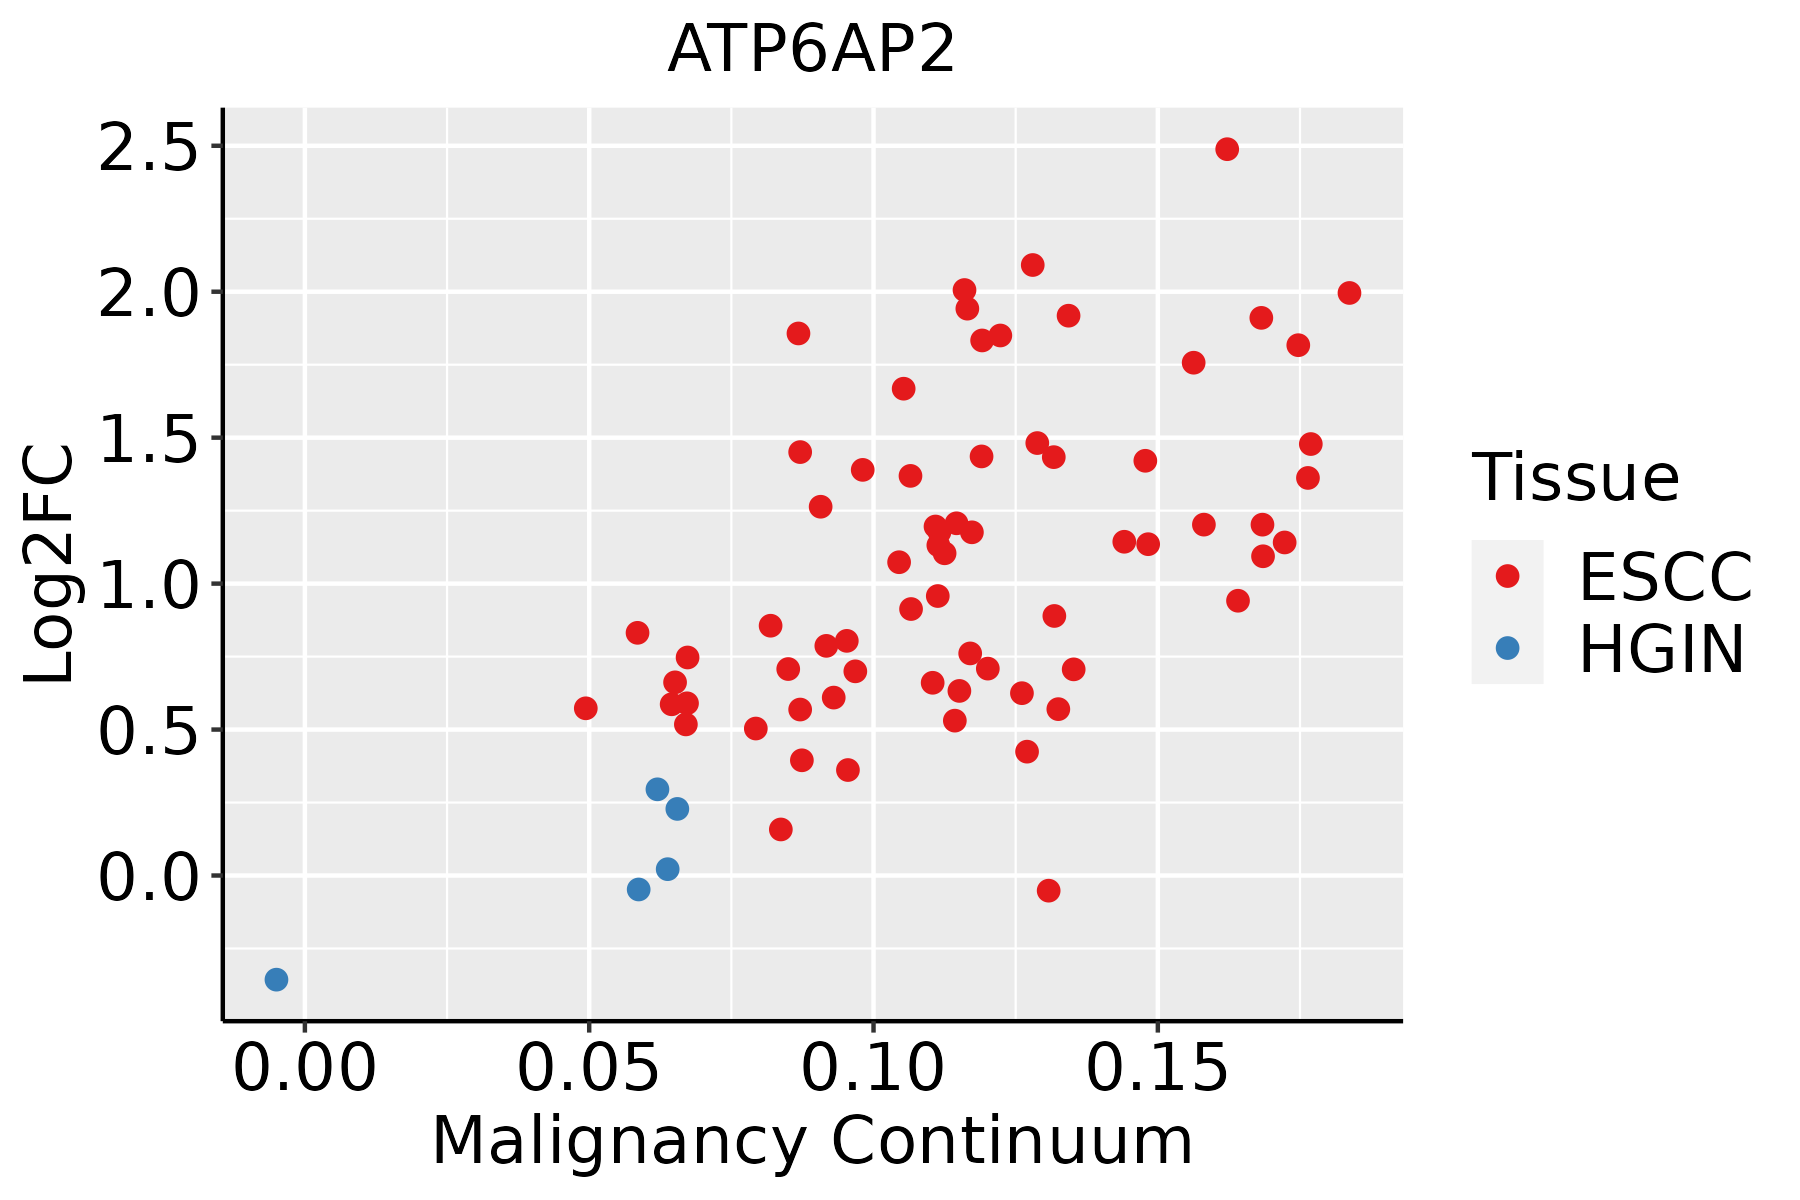 | ESCC: Esophageal squamous cell carcinoma |
| HGIN: High-grade intraepithelial neoplasias | ||
| LGIN: Low-grade intraepithelial neoplasias | ||
| Liver |  | HCC: Hepatocellular carcinoma |
| NAFLD: Non-alcoholic fatty liver disease | ||
| Oral Cavity | 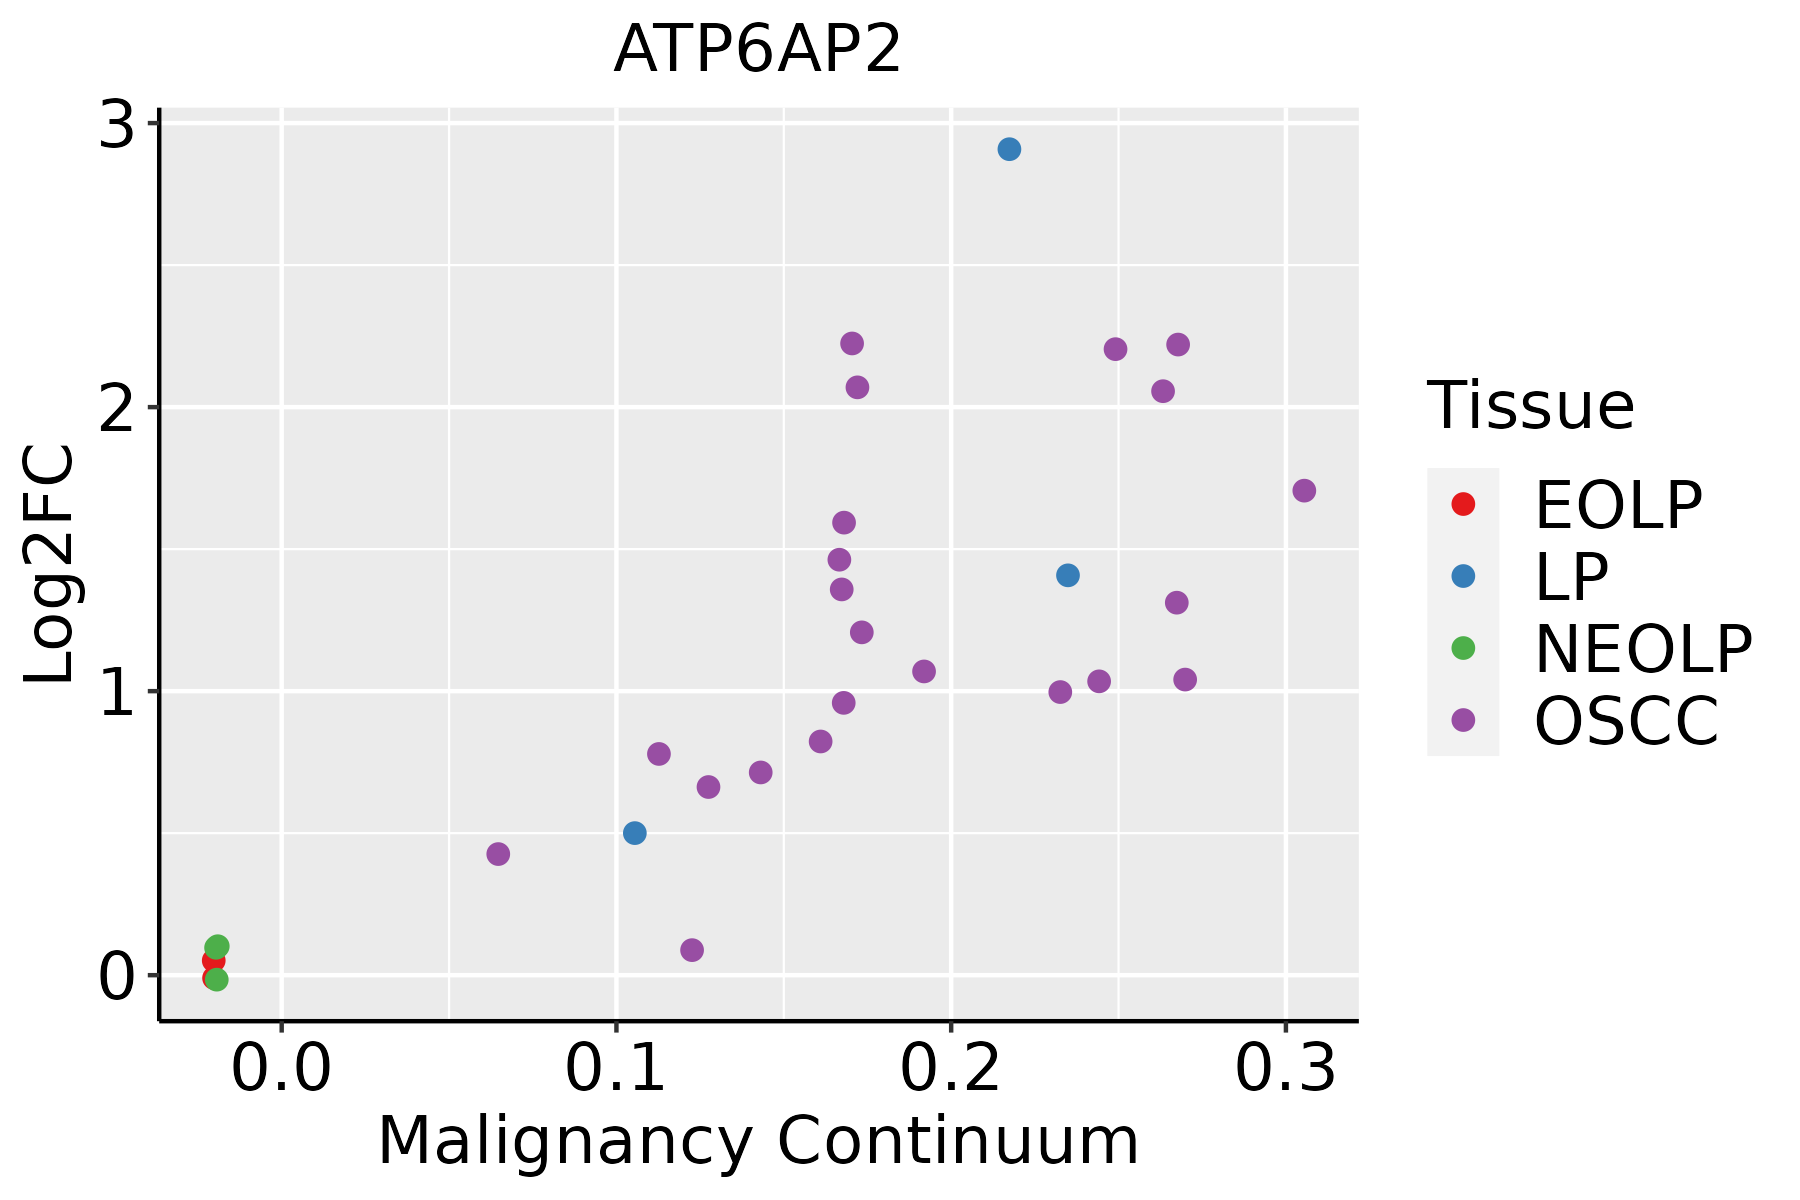 | EOLP: Erosive Oral lichen planus |
| LP: leukoplakia | ||
| NEOLP: Non-erosive oral lichen planus | ||
| OSCC: Oral squamous cell carcinoma | ||
| Skin | 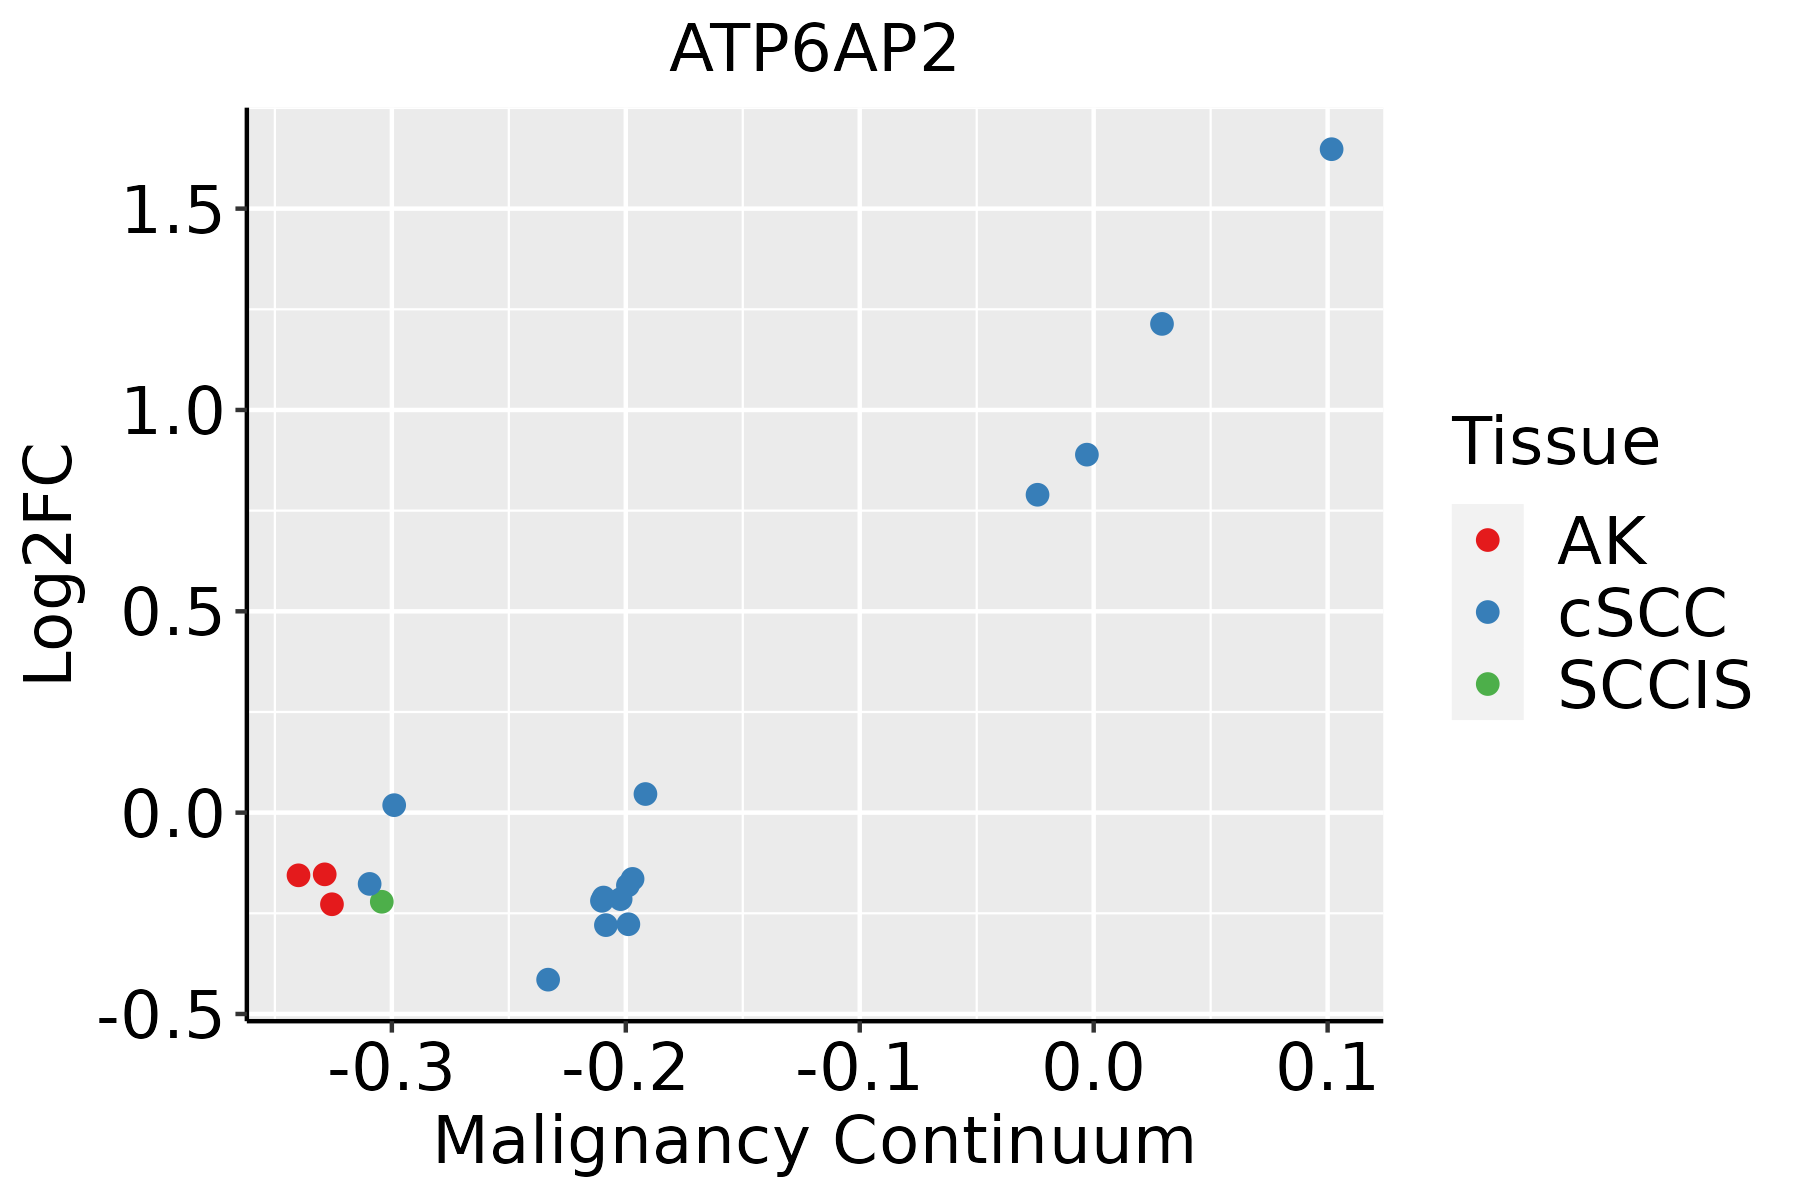 | AK: Actinic keratosis |
| cSCC: Cutaneous squamous cell carcinoma | ||
| SCCIS:squamous cell carcinoma in situ | ||
| Thyroid |  | ATC: Anaplastic thyroid cancer |
| HT: Hashimoto's thyroiditis | ||
| PTC: Papillary thyroid cancer |
| ∗log2FC in expression of this searched gene in stem-like cells from each diseased tissue sample relative to stem-like cells in normal samples in each tissue plotted against the malignancy continuum. Samples are colored based on if they are from different disease stage. |
Top |
Malignant transformation related pathway analysis |
| Find out the enriched GO biological processes and KEGG pathways involved in transition from healthy to precancer to cancer |
| Tissue | Disease Stage | Enriched GO biological Processes |
| Colorectum | AD |  |
| Colorectum | SER |  |
| Colorectum | MSS |  |
| Colorectum | MSI-H |  |
| Colorectum | FAP |  |
| ∗Top 15 enriched GO BP terms are showed in the bar plot of each disease state in each tissue. Each row represents a significant GO biological process which is colored according to the -log10(p.adjust). |
| Page: 1 2 3 4 5 6 7 8 9 |
| GO ID | Tissue | Disease Stage | Description | Gene Ratio | Bg Ratio | pvalue | p.adjust | Count |
| GO:019873820 | Thyroid | HT | cell-cell signaling by wnt | 48/1272 | 446/18723 | 1.07e-03 | 1.07e-02 | 48 |
| GO:00070338 | Thyroid | HT | vacuole organization | 24/1272 | 180/18723 | 1.17e-03 | 1.15e-02 | 24 |
| GO:00716349 | Thyroid | HT | regulation of transforming growth factor beta production | 9/1272 | 41/18723 | 1.45e-03 | 1.36e-02 | 9 |
| GO:00716048 | Thyroid | HT | transforming growth factor beta production | 9/1272 | 43/18723 | 2.06e-03 | 1.82e-02 | 9 |
| GO:006007019 | Thyroid | HT | canonical Wnt signaling pathway | 34/1272 | 303/18723 | 2.76e-03 | 2.27e-02 | 34 |
| GO:006082820 | Thyroid | HT | regulation of canonical Wnt signaling pathway | 29/1272 | 253/18723 | 4.01e-03 | 2.96e-02 | 29 |
| GO:003011120 | Thyroid | HT | regulation of Wnt signaling pathway | 35/1272 | 328/18723 | 5.41e-03 | 3.58e-02 | 35 |
| GO:0016055110 | Thyroid | PTC | Wnt signaling pathway | 217/5968 | 444/18723 | 3.71e-14 | 2.30e-12 | 217 |
| GO:0198738110 | Thyroid | PTC | cell-cell signaling by wnt | 217/5968 | 446/18723 | 6.68e-14 | 3.73e-12 | 217 |
| GO:0030111110 | Thyroid | PTC | regulation of Wnt signaling pathway | 163/5968 | 328/18723 | 1.05e-11 | 4.29e-10 | 163 |
| GO:000703315 | Thyroid | PTC | vacuole organization | 96/5968 | 180/18723 | 1.80e-09 | 5.13e-08 | 96 |
| GO:0060828110 | Thyroid | PTC | regulation of canonical Wnt signaling pathway | 123/5968 | 253/18723 | 1.83e-08 | 4.26e-07 | 123 |
| GO:0060070110 | Thyroid | PTC | canonical Wnt signaling pathway | 141/5968 | 303/18723 | 5.71e-08 | 1.21e-06 | 141 |
| GO:003017719 | Thyroid | PTC | positive regulation of Wnt signaling pathway | 72/5968 | 140/18723 | 1.16e-06 | 1.69e-05 | 72 |
| GO:005160420 | Thyroid | PTC | protein maturation | 132/5968 | 294/18723 | 1.71e-06 | 2.39e-05 | 132 |
| GO:002191514 | Thyroid | PTC | neural tube development | 76/5968 | 152/18723 | 2.40e-06 | 3.17e-05 | 76 |
| GO:009026319 | Thyroid | PTC | positive regulation of canonical Wnt signaling pathway | 55/5968 | 106/18723 | 1.45e-05 | 1.55e-04 | 55 |
| GO:00070405 | Thyroid | PTC | lysosome organization | 38/5968 | 74/18723 | 3.84e-04 | 2.58e-03 | 38 |
| GO:00801715 | Thyroid | PTC | lytic vacuole organization | 38/5968 | 74/18723 | 3.84e-04 | 2.58e-03 | 38 |
| GO:00164859 | Thyroid | PTC | protein processing | 95/5968 | 225/18723 | 6.60e-04 | 4.15e-03 | 95 |
| Page: 1 2 3 4 5 6 7 8 9 10 11 |
| Pathway ID | Tissue | Disease Stage | Description | Gene Ratio | Bg Ratio | pvalue | p.adjust | qvalue | Count |
| Page: 1 |
Top |
Cell-cell communication analysis |
| Identification of potential cell-cell interactions between two cell types and their ligand-receptor pairs for different disease states |
| Ligand | Receptor | LRpair | Pathway | Tissue | Disease Stage |
| Page: 1 |
Top |
Single-cell gene regulatory network inference analysis |
| Find out the significant the regulons (TFs) and the target genes of each regulon across cell types for different disease states |
| TF | Cell Type | Tissue | Disease Stage | Target Gene | RSS | Regulon Activity |
| ∗The dot plots of a searched regulon are shown for all cell subpopulations in each disease state of each tissue based on the regulon specific score inferred using pySCENIC and by calculating the average expression. |
| Page: 1 |
Top |
Somatic mutation of malignant transformation related genes |
| Annotation of somatic variants for genes involved in malignant transformation |
| Hugo Symbol | Variant Class | Variant Classification | dbSNP RS | HGVSc | HGVSp | HGVSp Short | SWISSPROT | BIOTYPE | SIFT | PolyPhen | Tumor Sample Barcode | Tissue | Histology | Sex | Age | Stage | Therapy Types | Drugs | Outcome |
| ATP6AP2 | SNV | Missense_Mutation | rs745734335 | c.454N>T | p.Arg152Cys | p.R152C | O75787 | protein_coding | deleterious(0) | possibly_damaging(0.644) | TCGA-A8-A081-01 | Breast | breast invasive carcinoma | Female | >=65 | I/II | Unknown | Unknown | SD |
| ATP6AP2 | SNV | Missense_Mutation | c.515C>A | p.Ser172Tyr | p.S172Y | O75787 | protein_coding | deleterious(0) | probably_damaging(0.965) | TCGA-AN-A046-01 | Breast | breast invasive carcinoma | Female | >=65 | I/II | Unknown | Unknown | SD | |
| ATP6AP2 | SNV | Missense_Mutation | c.1017T>G | p.Ile339Met | p.I339M | O75787 | protein_coding | deleterious(0) | probably_damaging(0.991) | TCGA-FU-A3HZ-01 | Cervix | cervical & endocervical cancer | Female | <65 | I/II | Chemotherapy | cisplatin | CR | |
| ATP6AP2 | SNV | Missense_Mutation | rs375148460 | c.262N>G | p.Leu88Val | p.L88V | O75787 | protein_coding | deleterious(0.01) | benign(0.05) | TCGA-VS-A9UH-01 | Cervix | cervical & endocervical cancer | Female | <65 | I/II | Chemotherapy | cisplatin | CR |
| ATP6AP2 | SNV | Missense_Mutation | c.133N>A | p.Val45Met | p.V45M | O75787 | protein_coding | deleterious(0.02) | benign(0.054) | TCGA-AA-3492-01 | Colorectum | colon adenocarcinoma | Female | >=65 | I/II | Unknown | Unknown | SD | |
| ATP6AP2 | SNV | Missense_Mutation | c.152G>C | p.Gly51Ala | p.G51A | O75787 | protein_coding | deleterious(0.02) | probably_damaging(0.966) | TCGA-AA-3856-01 | Colorectum | colon adenocarcinoma | Male | <65 | I/II | Unknown | Unknown | SD | |
| ATP6AP2 | SNV | Missense_Mutation | novel | c.406A>G | p.Met136Val | p.M136V | O75787 | protein_coding | tolerated(0.36) | benign(0.046) | TCGA-CA-6717-01 | Colorectum | colon adenocarcinoma | Male | <65 | I/II | Chemotherapy | oxaliplatin | CR |
| ATP6AP2 | SNV | Missense_Mutation | c.739N>C | p.Phe247Leu | p.F247L | O75787 | protein_coding | deleterious(0.03) | benign(0.028) | TCGA-NH-A50T-01 | Colorectum | colon adenocarcinoma | Female | >=65 | I/II | Unknown | Unknown | SD | |
| ATP6AP2 | SNV | Missense_Mutation | c.1043N>A | p.Arg348Gln | p.R348Q | O75787 | protein_coding | tolerated(0.05) | possibly_damaging(0.756) | TCGA-F5-6814-01 | Colorectum | rectum adenocarcinoma | Male | <65 | I/II | Unknown | Unknown | SD | |
| ATP6AP2 | SNV | Missense_Mutation | novel | c.662N>T | p.Glu221Val | p.E221V | O75787 | protein_coding | tolerated(0.05) | benign(0.034) | TCGA-A5-A0G2-01 | Endometrium | uterine corpus endometrioid carcinoma | Female | <65 | III/IV | Unknown | Unknown | SD |
| Page: 1 2 3 4 |
Top |
Related drugs of malignant transformation related genes |
| Identification of chemicals and drugs interact with genes involved in malignant transfromation |
| (DGIdb 4.0) |
| Entrez ID | Symbol | Category | Interaction Types | Drug Claim Name | Drug Name | PMIDs |
| Page: 1 |

Copyright 2023-Present -The University of Texas Health Science Center at Houston |