Schematic overview of the cellular and molecular mechanisms involved in the cancer progression, including the proposed cellular and molecular mechanisms in cancer cells trajectory. AT1: alveolar type 1 cells; AT2: alveolar type 2 cells; AAH: atypical adenomatous hyperplasia; AIS: adenocarcinoma in situ; MIA: minimally invasive adenocarcinoma; IA: invasive adenocarcinoma; EMT: epithelial-mesenchymal transition

Home

Download

Statistics

Help

Contact

Center for Computational Systems Medicine
leaf

Gene summary

leaf

Malignant transformation analysis

leaf

Malignant transformation related pathway analysis

leaf

Cell-cell communication analysis

leaf

Single-cell gene regulatory network inference analysis

leaf

Somatic mutation of malignant transformation related genes

leaf

Related drugs of malignant transformation related genes

Gene: ATF7

Gene summary for ATF7

check button Gene summary.

Gene informationSpeciesHuman
Gene symbol

ATF7

Gene ID

11016

Gene nameactivating transcription factor 7
Gene AliasATFA
Cytomap12q13.13
Gene Typeprotein-coding
GO ID

GO:0006139

UniProtAcc

P17544


Top

Malignant transformation analysis

check button Identification of the aberrant gene expression in precancerous and cancerous lesions by comparing the gene expression of stem-like cells in diseased tissues with normal stem cells
check button Malignant transformation involving gene list.
Entrez IDSymbolReplicatesSpeciesOrganTissueAdj P-valueLog2FCMalignancy
11016ATF7LZE4THumanEsophagusESCC8.33e-061.78e-010.0811
11016ATF7LZE5THumanEsophagusESCC5.67e-032.33e-010.0514
11016ATF7LZE7THumanEsophagusESCC1.28e-083.44e-010.0667
11016ATF7LZE8THumanEsophagusESCC1.41e-026.48e-020.067
11016ATF7LZE20THumanEsophagusESCC1.52e-041.69e-010.0662
11016ATF7LZE22THumanEsophagusESCC6.65e-031.78e-010.068
11016ATF7LZE24THumanEsophagusESCC5.53e-123.42e-010.0596
11016ATF7LZE21THumanEsophagusESCC1.55e-031.04e-010.0655
11016ATF7P1T-EHumanEsophagusESCC1.10e-083.13e-010.0875
11016ATF7P2T-EHumanEsophagusESCC1.64e-255.50e-010.1177
11016ATF7P4T-EHumanEsophagusESCC1.17e-214.11e-010.1323
11016ATF7P5T-EHumanEsophagusESCC1.88e-131.94e-010.1327
11016ATF7P8T-EHumanEsophagusESCC3.25e-244.23e-010.0889
11016ATF7P9T-EHumanEsophagusESCC1.30e-123.16e-010.1131
11016ATF7P10T-EHumanEsophagusESCC1.17e-252.38e-010.116
11016ATF7P11T-EHumanEsophagusESCC5.33e-236.03e-010.1426
11016ATF7P12T-EHumanEsophagusESCC7.44e-111.96e-010.1122
11016ATF7P15T-EHumanEsophagusESCC6.95e-183.32e-010.1149
11016ATF7P16T-EHumanEsophagusESCC1.99e-202.83e-010.1153
11016ATF7P17T-EHumanEsophagusESCC2.40e-103.80e-010.1278
Page: 1 2 3 4 5 6 

check button Transcriptomic changes along malignancy continuum.
TissueExpression DynamicsAbbreviation
EsophagusThe image shows the transcriptomic changes along malignancy continuum.log2FC in expression of this searched gene in stem-like cells from each diseased tissue sample relative to stem-like cells in normal samples in each tissue plotted against the malignancy continuum. Samples are colored based on if they are from different disease stage.
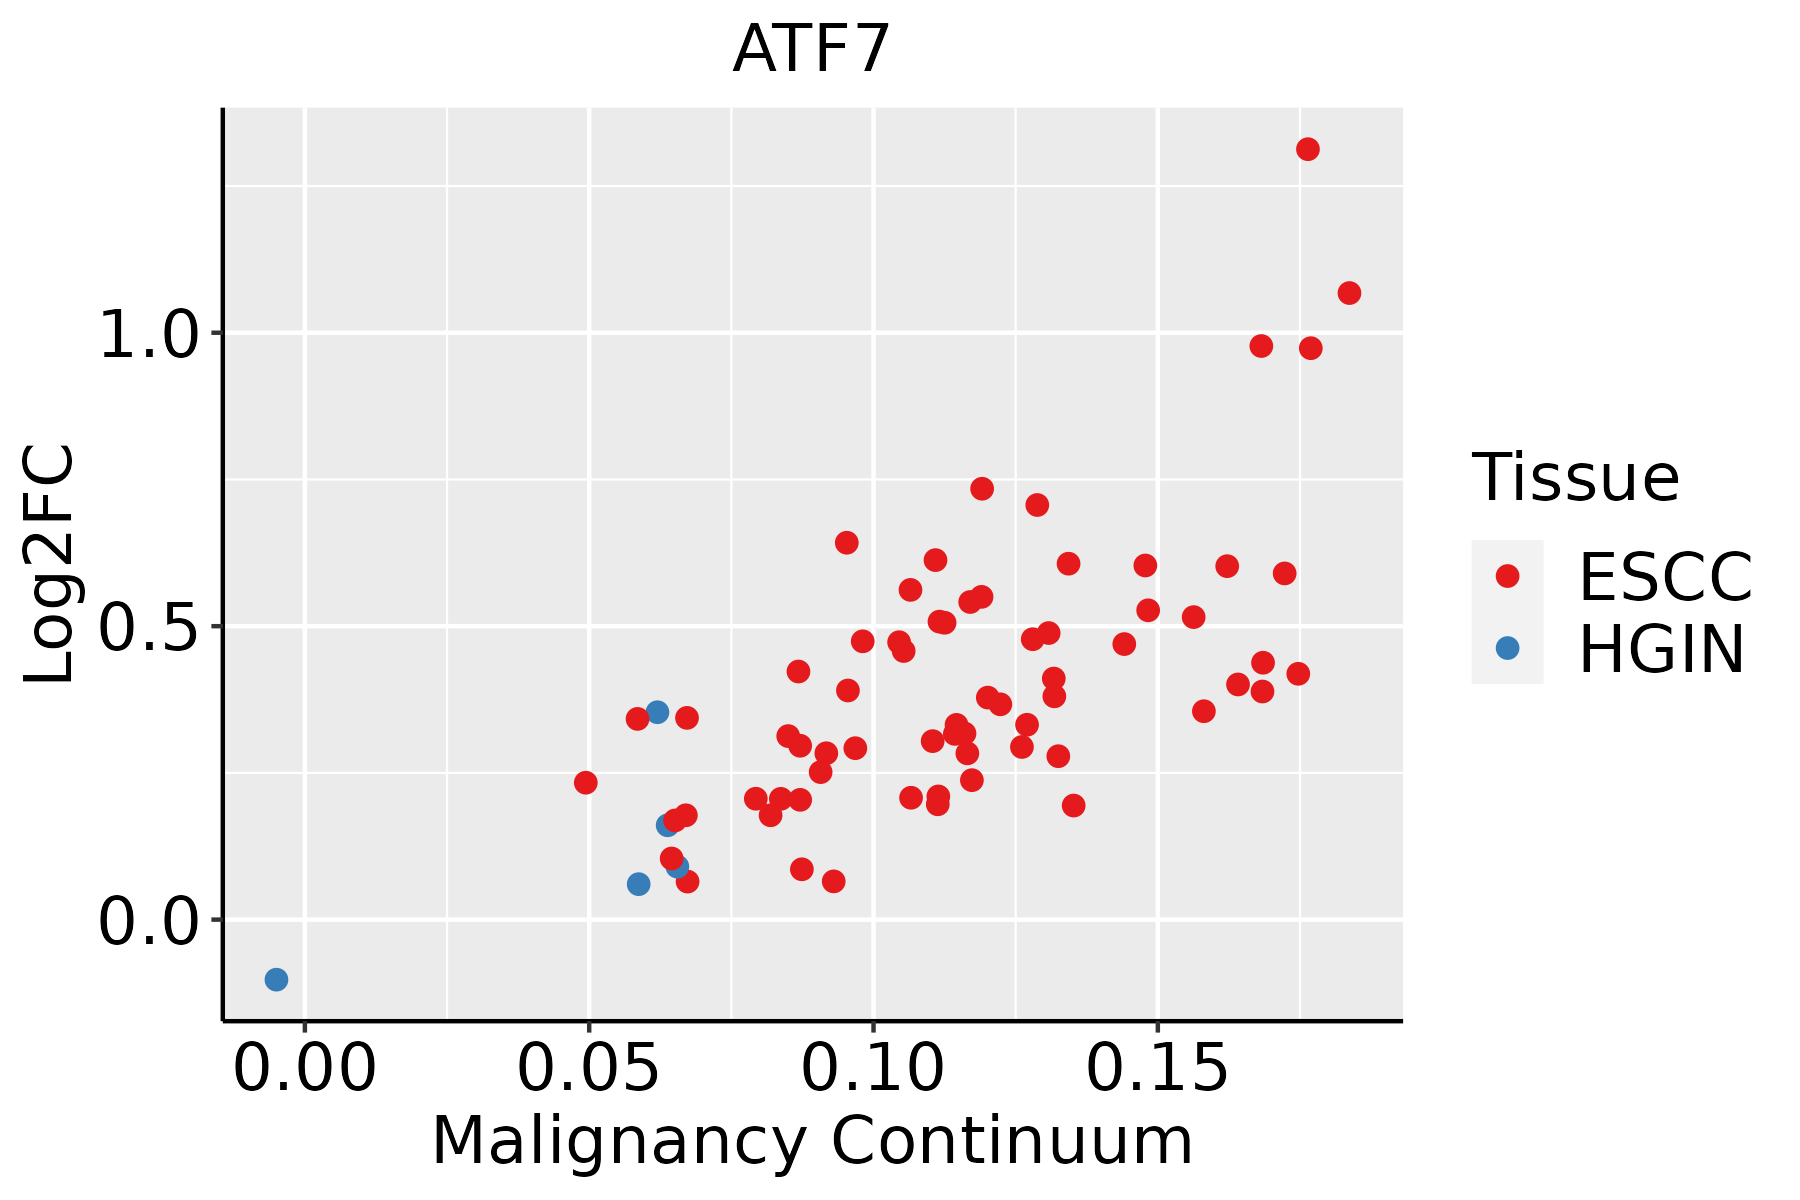
ESCC: Esophageal squamous cell carcinoma
HGIN: High-grade intraepithelial neoplasias
LGIN: Low-grade intraepithelial neoplasias
LiverThe image shows the transcriptomic changes along malignancy continuum.log2FC in expression of this searched gene in stem-like cells from each diseased tissue sample relative to stem-like cells in normal samples in each tissue plotted against the malignancy continuum. Samples are colored based on if they are from different disease stage.
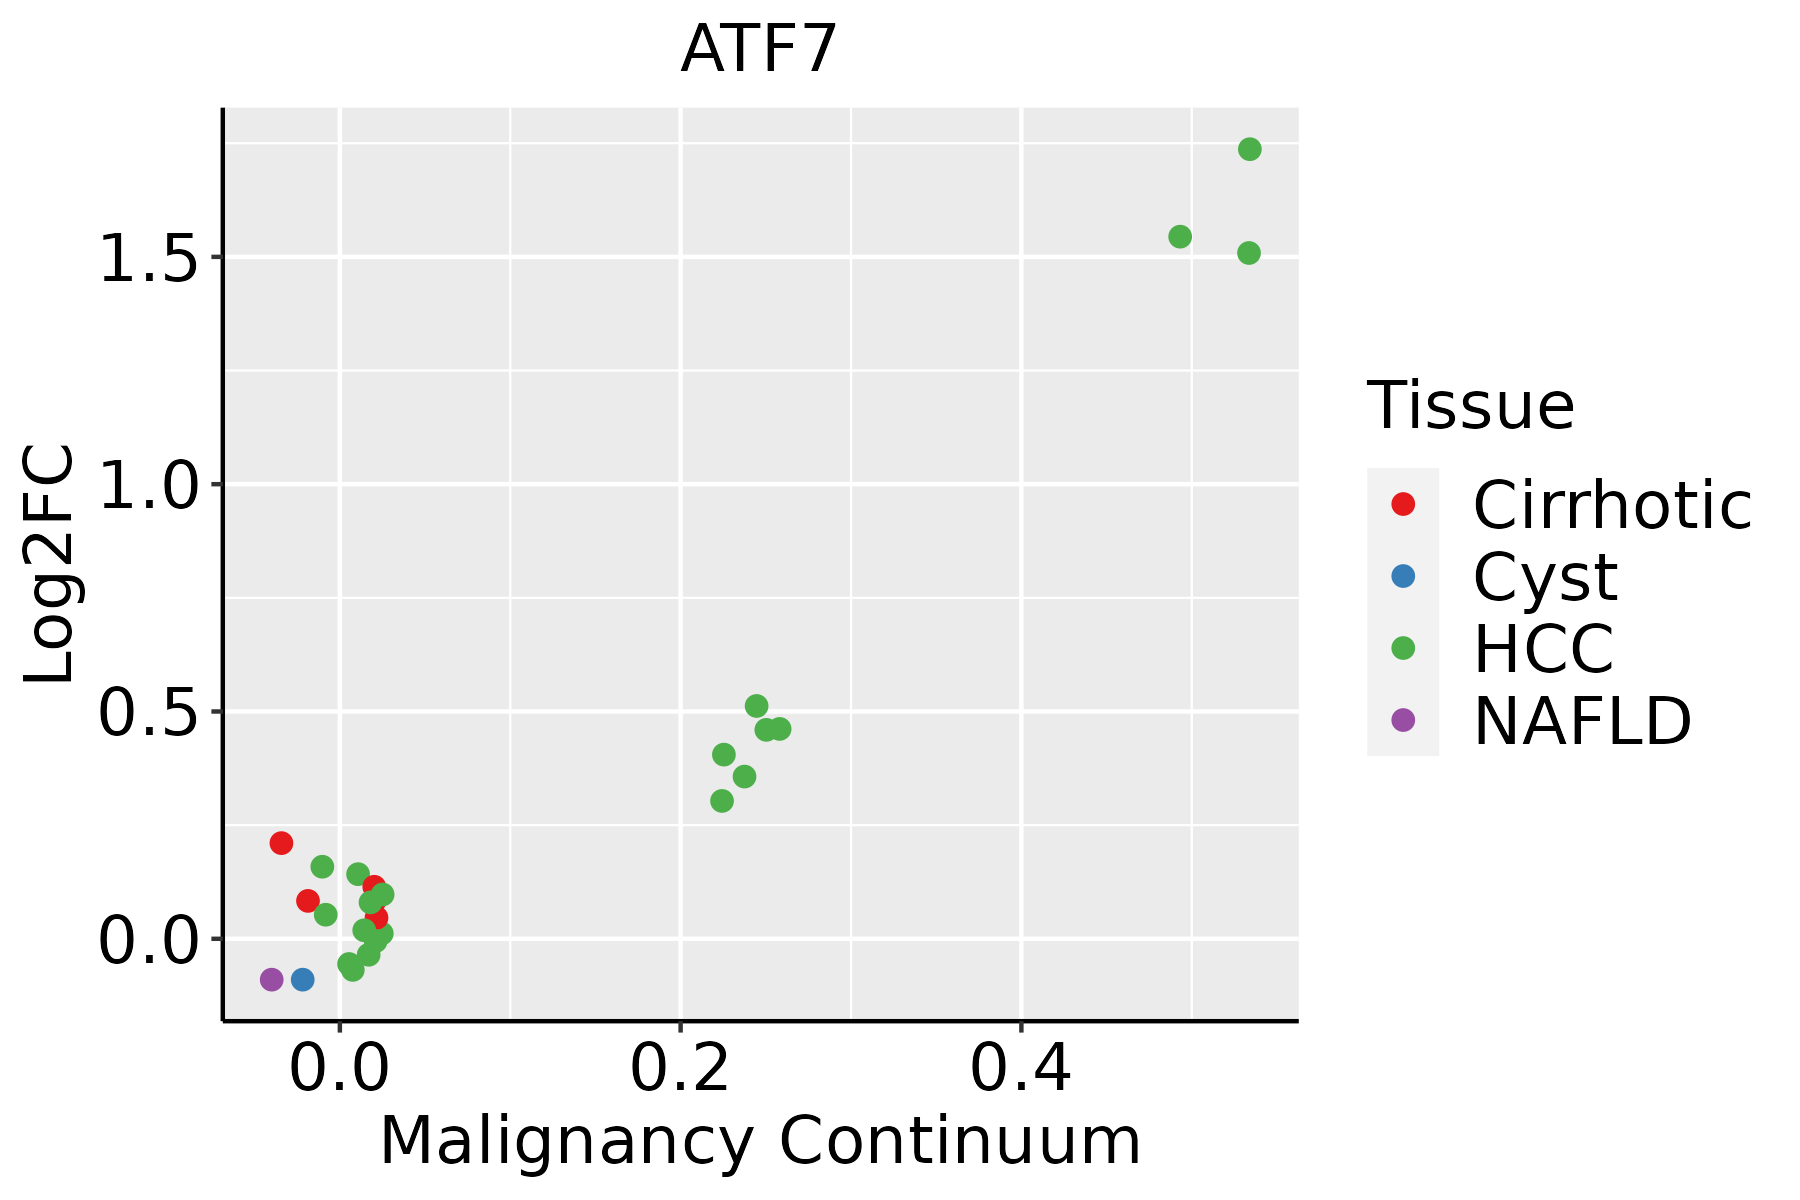
HCC: Hepatocellular carcinoma
NAFLD: Non-alcoholic fatty liver disease
LungThe image shows the transcriptomic changes along malignancy continuum.log2FC in expression of this searched gene in stem-like cells from each diseased tissue sample relative to stem-like cells in normal samples in each tissue plotted against the malignancy continuum. Samples are colored based on if they are from different disease stage.
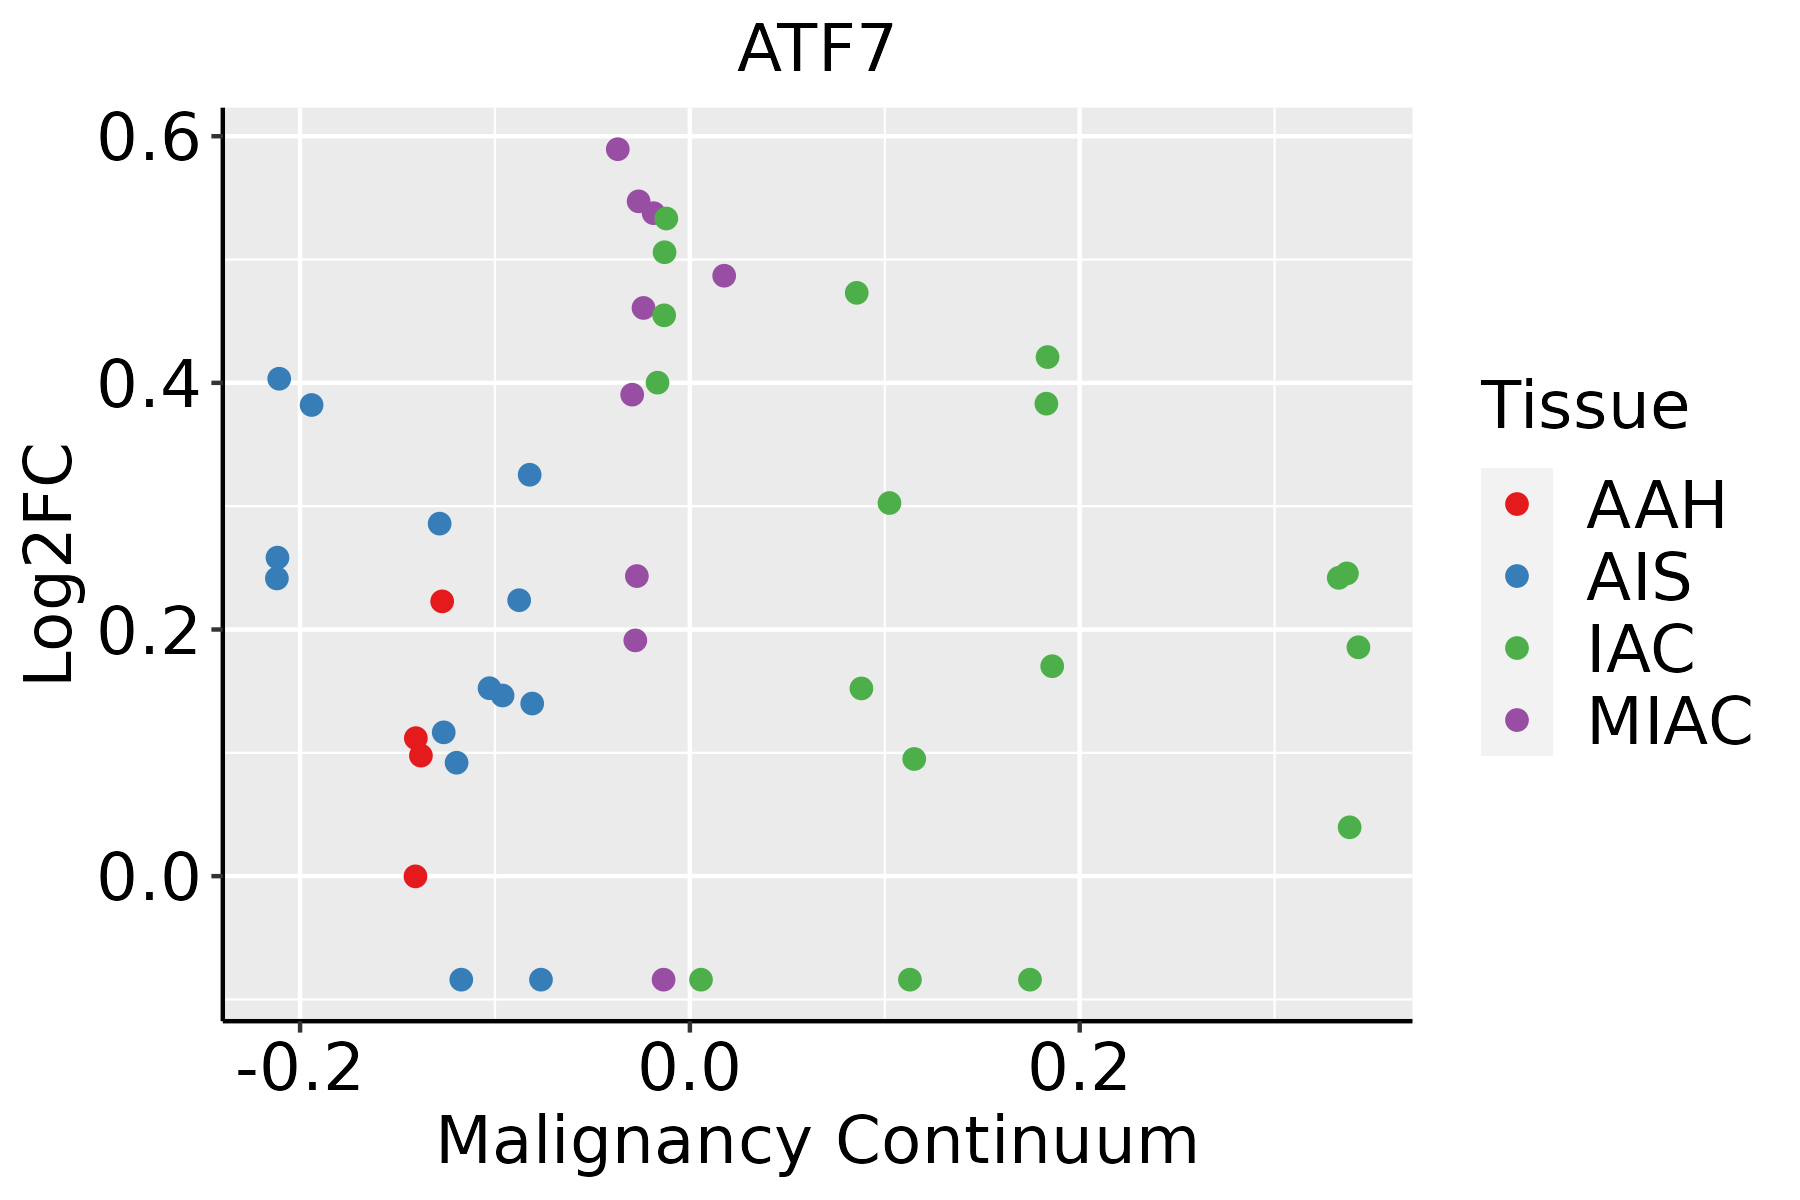
AAH: Atypical adenomatous hyperplasia
AIS: Adenocarcinoma in situ
IAC: Invasive lung adenocarcinoma
MIA: Minimally invasive adenocarcinoma
Oral CavityThe image shows the transcriptomic changes along malignancy continuum.log2FC in expression of this searched gene in stem-like cells from each diseased tissue sample relative to stem-like cells in normal samples in each tissue plotted against the malignancy continuum. Samples are colored based on if they are from different disease stage.
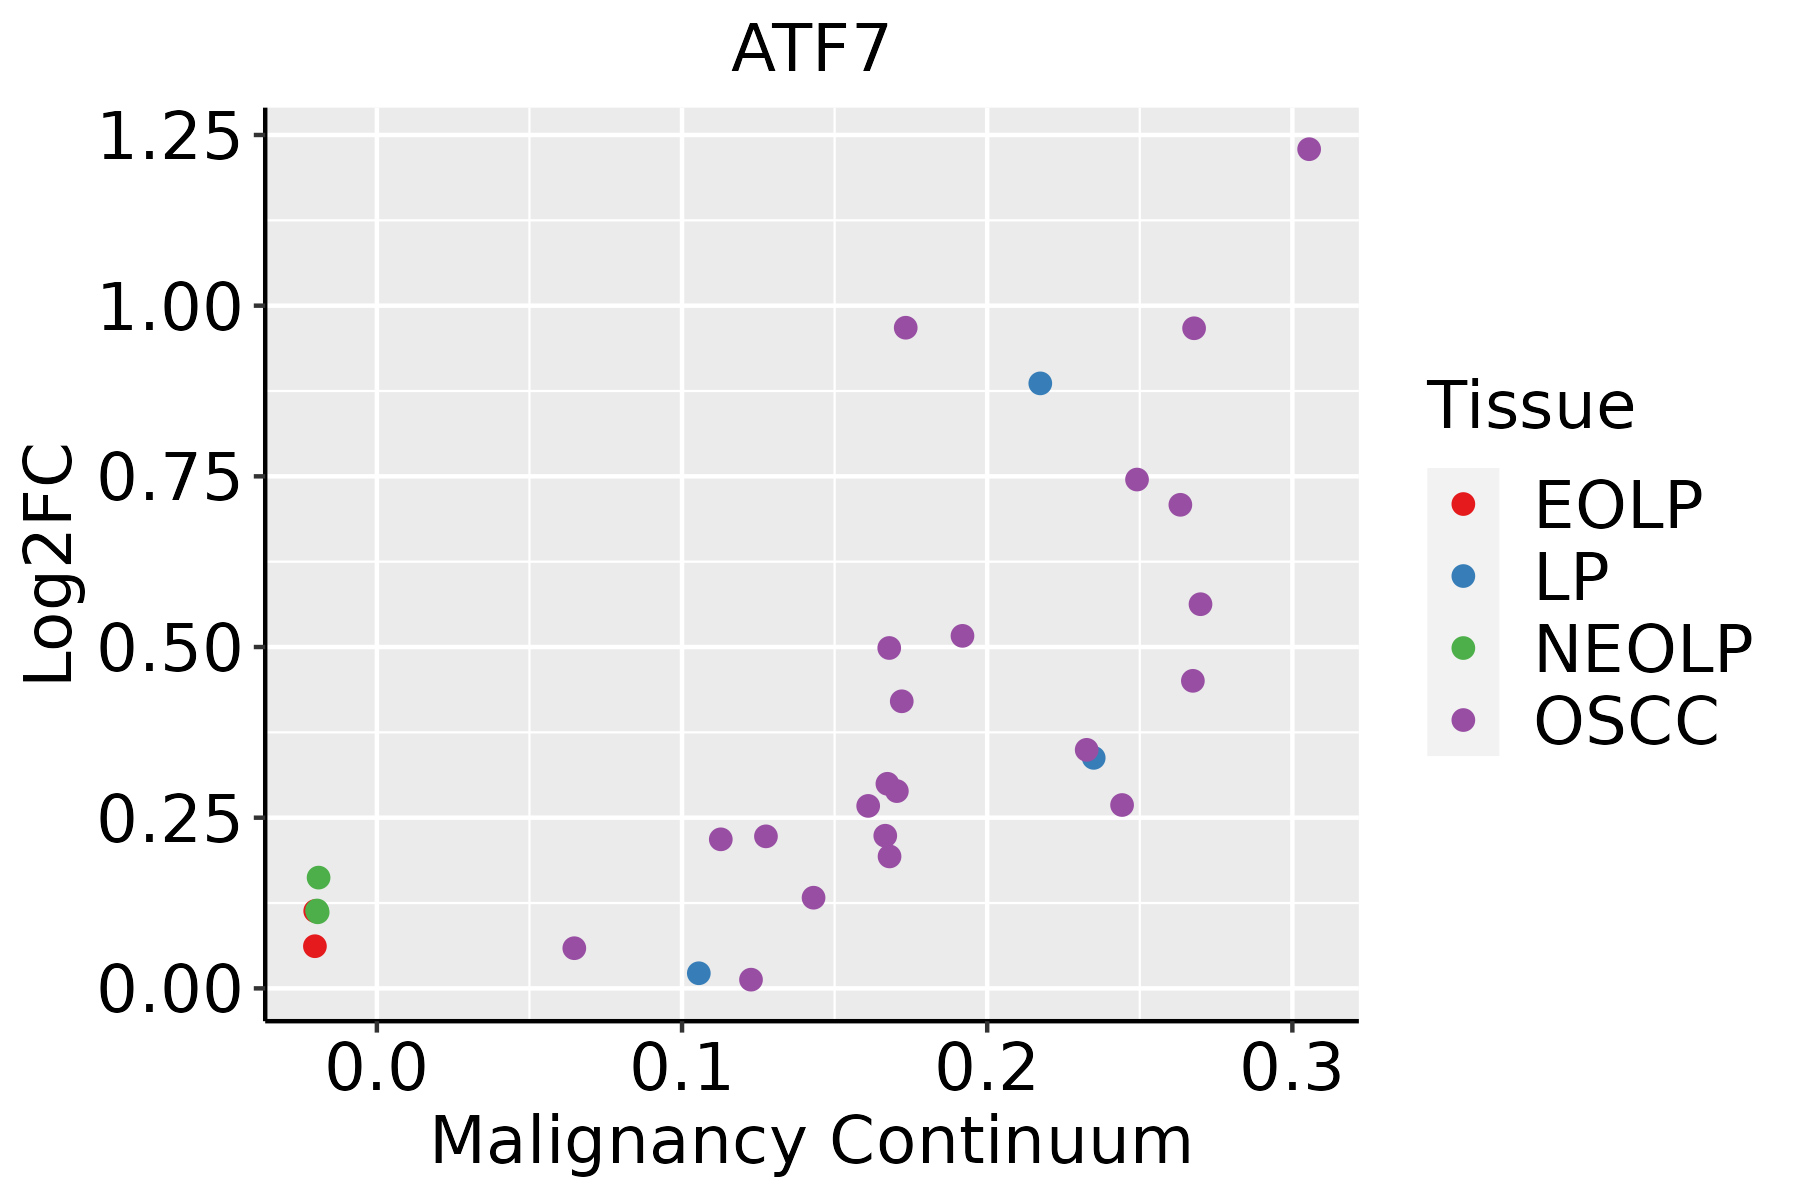
EOLP: Erosive Oral lichen planus
LP: leukoplakia
NEOLP: Non-erosive oral lichen planus
OSCC: Oral squamous cell carcinoma
ThyroidThe image shows the transcriptomic changes along malignancy continuum.log2FC in expression of this searched gene in stem-like cells from each diseased tissue sample relative to stem-like cells in normal samples in each tissue plotted against the malignancy continuum. Samples are colored based on if they are from different disease stage.ATC: Anaplastic thyroid cancer
HT: Hashimoto's thyroiditis
PTC: Papillary thyroid cancer
∗log2FC in expression of this searched gene in stem-like cells from each diseased tissue sample relative to stem-like cells in normal samples in each tissue plotted against the malignancy continuum. Samples are colored based on if they are from different disease stage.

Top

Malignant transformation related pathway analysis

check buttonFind out the enriched GO biological processes and KEGG pathways involved in transition from healthy to precancer to cancer
check button Figure of enriched GO biological processes.
TissueDisease StageEnriched GO biological Processes
ColorectumADGO analysis - Figure of enriched GO biological processes: Top 15 enriched GO BP terms are showed in the bar plot of each disease state in each tissue. Each row represents a significant GO biological process which is colored according to the -log10(p.adjust).
ColorectumSERGO analysis - Figure of enriched GO biological processes: Top 15 enriched GO BP terms are showed in the bar plot of each disease state in each tissue. Each row represents a significant GO biological process which is colored according to the -log10(p.adjust).
ColorectumMSSGO analysis - Figure of enriched GO biological processes: Top 15 enriched GO BP terms are showed in the bar plot of each disease state in each tissue. Each row represents a significant GO biological process which is colored according to the -log10(p.adjust).
ColorectumMSI-HGO analysis - Figure of enriched GO biological processes: Top 15 enriched GO BP terms are showed in the bar plot of each disease state in each tissue. Each row represents a significant GO biological process which is colored according to the -log10(p.adjust).
ColorectumFAPGO analysis - Figure of enriched GO biological processes: Top 15 enriched GO BP terms are showed in the bar plot of each disease state in each tissue. Each row represents a significant GO biological process which is colored according to the -log10(p.adjust).
∗Top 15 enriched GO BP terms are showed in the bar plot of each disease state in each tissue. Each row represents a significant GO biological process which is colored according to the -log10(p.adjust).
Page: 1 2 3 4 5 6 7 8 9 

check button Enriched GO biological processes.
GO IDTissueDisease StageDescriptionGene RatioBg Ratiopvaluep.adjustCount
GO:00063525ThyroidPTCDNA-templated transcription, initiation63/5968130/187235.72e-055.05e-0463
GO:00708975ThyroidPTCtranscription preinitiation complex assembly22/596836/187232.85e-042.02e-0322
GO:00322594ThyroidPTCmethylation146/5968364/187234.99e-043.26e-03146
GO:00434145ThyroidPTCmacromolecule methylation127/5968316/187231.02e-036.07e-03127
GO:0031507ThyroidPTCheterochromatin assembly22/596839/187231.32e-037.47e-0322
GO:00511234ThyroidPTCRNA polymerase II preinitiation complex assembly15/596824/187231.95e-031.05e-0215
GO:00458142ThyroidPTCnegative regulation of gene expression, epigenetic26/596850/187232.44e-031.27e-0226
GO:00708282ThyroidPTCheterochromatin organization24/596846/187233.34e-031.63e-0224
GO:20001426ThyroidPTCregulation of DNA-templated transcription, initiation21/596840/187235.37e-032.47e-0221
GO:00602604ThyroidPTCregulation of transcription initiation from RNA polymerase II promoter18/596833/187235.77e-032.60e-0218
GO:00609688ThyroidPTCregulation of gene silencing36/596881/187231.18e-024.64e-0236
GO:003164734ThyroidATCregulation of protein stability177/6293298/187234.08e-206.46e-18177
GO:003304423ThyroidATCregulation of chromosome organization119/6293187/187233.55e-173.40e-15119
GO:0043254210ThyroidATCregulation of protein-containing complex assembly225/6293428/187232.72e-162.33e-14225
GO:005082134ThyroidATCprotein stabilization117/6293191/187233.98e-152.71e-13117
GO:0006325110ThyroidATCchromatin organization189/6293409/187236.40e-081.13e-06189
GO:200125224ThyroidATCpositive regulation of chromosome organization49/629382/187231.07e-061.39e-0549
GO:004002913ThyroidATCregulation of gene expression, epigenetic57/6293105/187231.01e-051.00e-0457
GO:000636712ThyroidATCtranscription initiation from RNA polymerase II promoter44/629377/187231.86e-051.70e-0444
GO:000635213ThyroidATCDNA-templated transcription, initiation64/6293130/187231.60e-041.10e-0364
Page: 1 2 3 4 5 6 7 8 9 10 

check button Enriched KEGG pathways.
Pathway IDTissueDisease StageDescriptionGene RatioBg Ratiopvaluep.adjustqvalueCount
Page: 1 

Top

Cell-cell communication analysis

check buttonIdentification of potential cell-cell interactions between two cell types and their ligand-receptor pairs for different disease states
LigandReceptorLRpairPathwayTissueDisease Stage
Page: 1 

Top

Single-cell gene regulatory network inference analysis

check buttonFind out the significant the regulons (TFs) and the target genes of each regulon across cell types for different disease states
TFCell TypeTissueDisease StageTarget GeneRSSRegulon Activity
ATF7MSCEsophagusHealthyMAP2,ZNF554,NCK1-AS1, etc.9.64e-03The dot plots of a searched regulon are shown for all cell subpopulations in each disease state of each tissue based on the regulon specific score inferred using pySCENIC and by calculating the average expression.
ATF7CD8TEFFProstateADJDCAF17,VSIG10,NFYA, etc.2.58e-02The dot plots of a searched regulon are shown for all cell subpopulations in each disease state of each tissue based on the regulon specific score inferred using pySCENIC and by calculating the average expression.
∗The dot plots of a searched regulon are shown for all cell subpopulations in each disease state of each tissue based on the regulon specific score inferred using pySCENIC and by calculating the average expression.
Page: 1 

Top

Somatic mutation of malignant transformation related genes

check buttonAnnotation of somatic variants for genes involved in malignant transformation
Hugo SymbolVariant ClassVariant ClassificationdbSNP RSHGVScHGVSpHGVSp ShortSWISSPROTBIOTYPESIFTPolyPhenTumor Sample BarcodeTissueHistologySexAgeStageTherapy TypesDrugsOutcome
ATF7SNVMissense_Mutationrs754866750c.733A>Cp.Ile245Leup.I245LP17544protein_codingtolerated(0.66)benign(0)TCGA-A2-A1G4-01Breastbreast invasive carcinomaFemale>=65III/IVChemotherapyadriamycinSD
ATF7SNVMissense_Mutationrs754866750c.733N>Cp.Ile245Leup.I245LP17544protein_codingtolerated(0.66)benign(0)TCGA-AN-A0XR-01Breastbreast invasive carcinomaFemale<65III/IVUnknownUnknownSD
ATF7SNVMissense_Mutationrs754866750c.733A>Cp.Ile245Leup.I245LP17544protein_codingtolerated(0.66)benign(0)TCGA-B6-A1KN-01Breastbreast invasive carcinomaFemale<65III/IVUnknownUnknownSD
ATF7SNVMissense_Mutationrs764112606c.896N>Cp.His299Prop.H299PP17544protein_codingdeleterious(0.03)benign(0.133)TCGA-BH-A0B7-01Breastbreast invasive carcinomaFemale<65I/IIChemotherapyadriamycinCR
ATF7SNVMissense_Mutationrs754866750c.733A>Cp.Ile245Leup.I245LP17544protein_codingtolerated(0.66)benign(0)TCGA-BH-A1FH-01Breastbreast invasive carcinomaFemale<65III/IVUnknownUnknownPD
ATF7SNVMissense_Mutationrs754866750c.733A>Cp.Ile245Leup.I245LP17544protein_codingtolerated(0.66)benign(0)TCGA-C8-A273-01Breastbreast invasive carcinomaFemale<65I/IIHormone TherapytamoxiphenSD
ATF7SNVMissense_Mutationrs754866750c.733N>Cp.Ile245Leup.I245LP17544protein_codingtolerated(0.66)benign(0)TCGA-D8-A1JK-01Breastbreast invasive carcinomaFemale>=65I/IIUnknownUnknownSD
ATF7SNVMissense_Mutationrs754866750c.733A>Cp.Ile245Leup.I245LP17544protein_codingtolerated(0.66)benign(0)TCGA-D8-A1JT-01Breastbreast invasive carcinomaFemale>=65I/IIHormone TherapyarimidexSD
ATF7SNVMissense_Mutationrs754866750c.733A>Cp.Ile245Leup.I245LP17544protein_codingtolerated(0.66)benign(0)TCGA-D8-A1XG-01Breastbreast invasive carcinomaFemale>=65III/IVUnknownUnknownSD
ATF7SNVMissense_Mutationc.61N>Cp.Glu21Glnp.E21QP17544protein_codingdeleterious(0)probably_damaging(0.983)TCGA-E2-A1L7-01Breastbreast invasive carcinomaFemale<65III/IVChemotherapycyclophosphamidePD
Page: 1 2 3 4 5 

Top

Related drugs of malignant transformation related genes

check buttonIdentification of chemicals and drugs interact with genes involved in malignant transfromation
(DGIdb 4.0)
Entrez IDSymbolCategoryInteraction TypesDrug Claim NameDrug NamePMIDs
Page: 1