
|
|||||
|
 | |
| |
| |
| |
| |
| |
|
Gene: ARL8B |
Gene summary for ARL8B |
| Gene information | Species | Human | Gene symbol | ARL8B | Gene ID | 55207 |
| Gene name | ADP ribosylation factor like GTPase 8B | |
| Gene Alias | ARL10C | |
| Cytomap | 3p26.1 | |
| Gene Type | protein-coding | GO ID | GO:0001778 | UniProtAcc | A0A024R2D4 |
Top |
Malignant transformation analysis |
| Identification of the aberrant gene expression in precancerous and cancerous lesions by comparing the gene expression of stem-like cells in diseased tissues with normal stem cells |
| Entrez ID | Symbol | Replicates | Species | Organ | Tissue | Adj P-value | Log2FC | Malignancy |
| 55207 | ARL8B | CCI_1 | Human | Cervix | CC | 1.98e-02 | 5.86e-01 | 0.528 |
| 55207 | ARL8B | CCI_2 | Human | Cervix | CC | 3.38e-05 | 8.49e-01 | 0.5249 |
| 55207 | ARL8B | CCI_3 | Human | Cervix | CC | 2.20e-06 | 9.81e-01 | 0.516 |
| 55207 | ARL8B | sample3 | Human | Cervix | CC | 4.99e-04 | 1.84e-01 | 0.1387 |
| 55207 | ARL8B | T3 | Human | Cervix | CC | 9.18e-04 | 2.03e-01 | 0.1389 |
| 55207 | ARL8B | LZE4T | Human | Esophagus | ESCC | 1.37e-17 | 7.25e-01 | 0.0811 |
| 55207 | ARL8B | LZE7T | Human | Esophagus | ESCC | 5.00e-03 | 2.78e-01 | 0.0667 |
| 55207 | ARL8B | LZE8T | Human | Esophagus | ESCC | 7.27e-04 | 4.46e-02 | 0.067 |
| 55207 | ARL8B | LZE20T | Human | Esophagus | ESCC | 6.17e-07 | 2.10e-01 | 0.0662 |
| 55207 | ARL8B | LZE24T | Human | Esophagus | ESCC | 3.92e-10 | 3.23e-01 | 0.0596 |
| 55207 | ARL8B | LZE21T | Human | Esophagus | ESCC | 3.54e-02 | 2.40e-02 | 0.0655 |
| 55207 | ARL8B | LZE6T | Human | Esophagus | ESCC | 1.16e-02 | 1.09e-01 | 0.0845 |
| 55207 | ARL8B | P2T-E | Human | Esophagus | ESCC | 1.27e-25 | 1.06e-01 | 0.1177 |
| 55207 | ARL8B | P4T-E | Human | Esophagus | ESCC | 3.63e-29 | 9.03e-01 | 0.1323 |
| 55207 | ARL8B | P5T-E | Human | Esophagus | ESCC | 2.37e-68 | 1.63e+00 | 0.1327 |
| 55207 | ARL8B | P8T-E | Human | Esophagus | ESCC | 7.72e-27 | 1.40e-01 | 0.0889 |
| 55207 | ARL8B | P9T-E | Human | Esophagus | ESCC | 4.25e-11 | 3.60e-01 | 0.1131 |
| 55207 | ARL8B | P10T-E | Human | Esophagus | ESCC | 1.46e-16 | 2.92e-01 | 0.116 |
| 55207 | ARL8B | P11T-E | Human | Esophagus | ESCC | 1.19e-06 | 5.70e-01 | 0.1426 |
| 55207 | ARL8B | P12T-E | Human | Esophagus | ESCC | 3.38e-24 | 7.13e-01 | 0.1122 |
| Page: 1 2 3 4 5 6 7 |
| Tissue | Expression Dynamics | Abbreviation |
| Cervix | 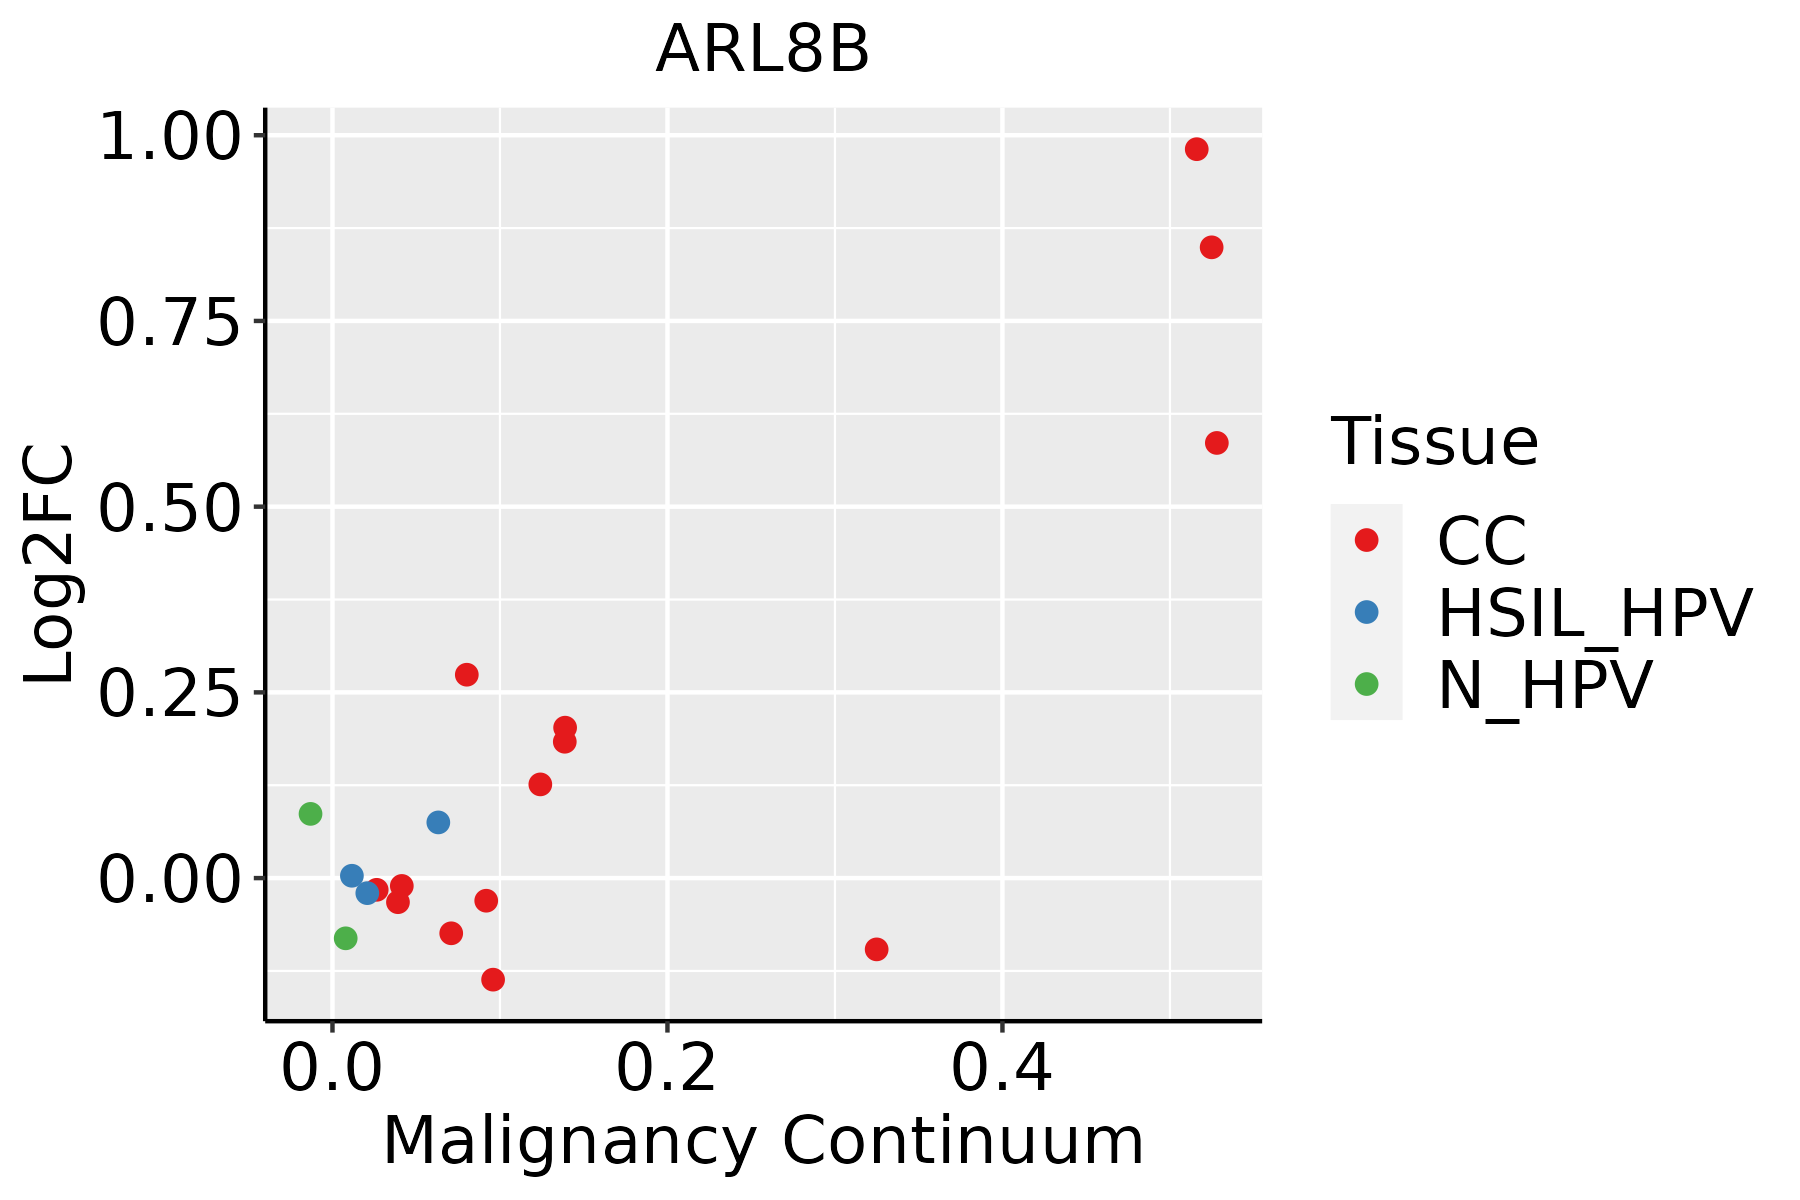 | CC: Cervix cancer |
| HSIL_HPV: HPV-infected high-grade squamous intraepithelial lesions | ||
| N_HPV: HPV-infected normal cervix | ||
| Esophagus | 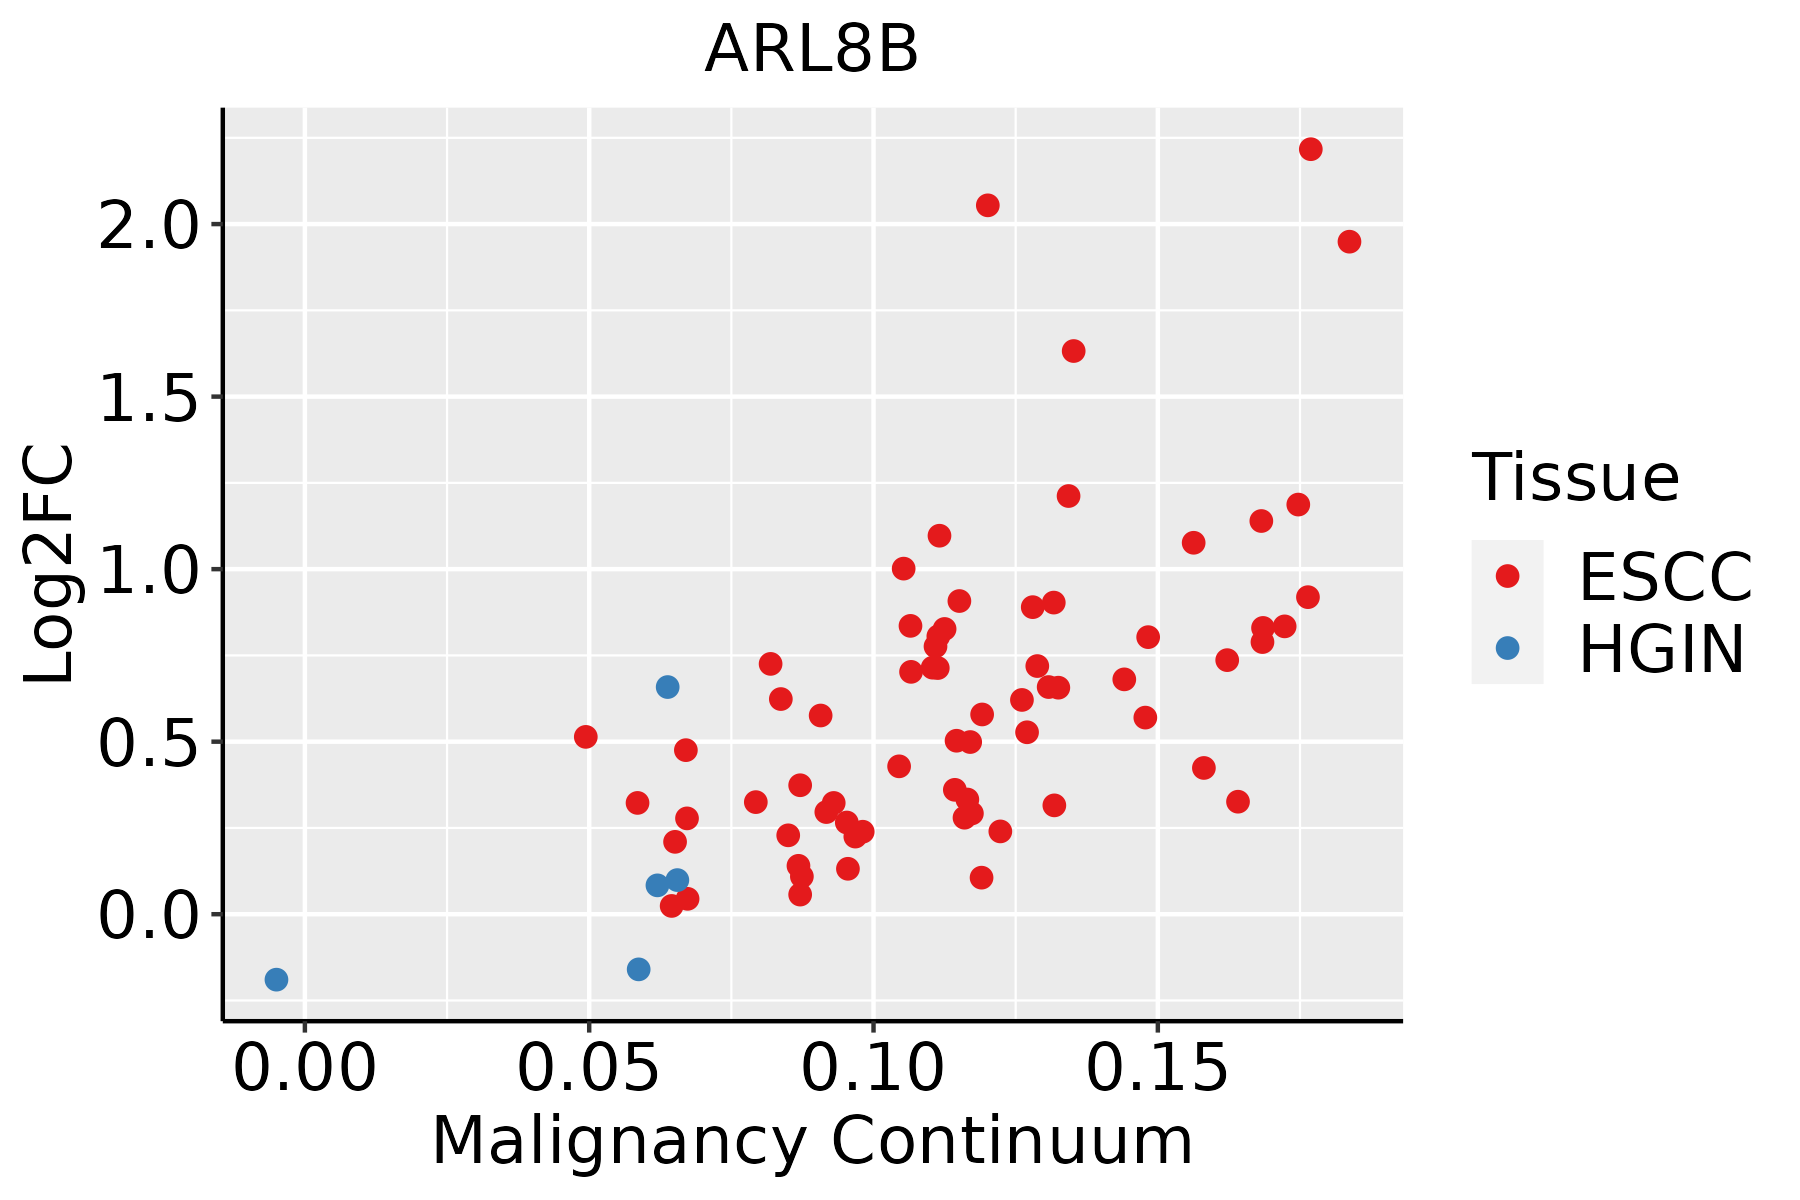 | ESCC: Esophageal squamous cell carcinoma |
| HGIN: High-grade intraepithelial neoplasias | ||
| LGIN: Low-grade intraepithelial neoplasias | ||
| Liver | 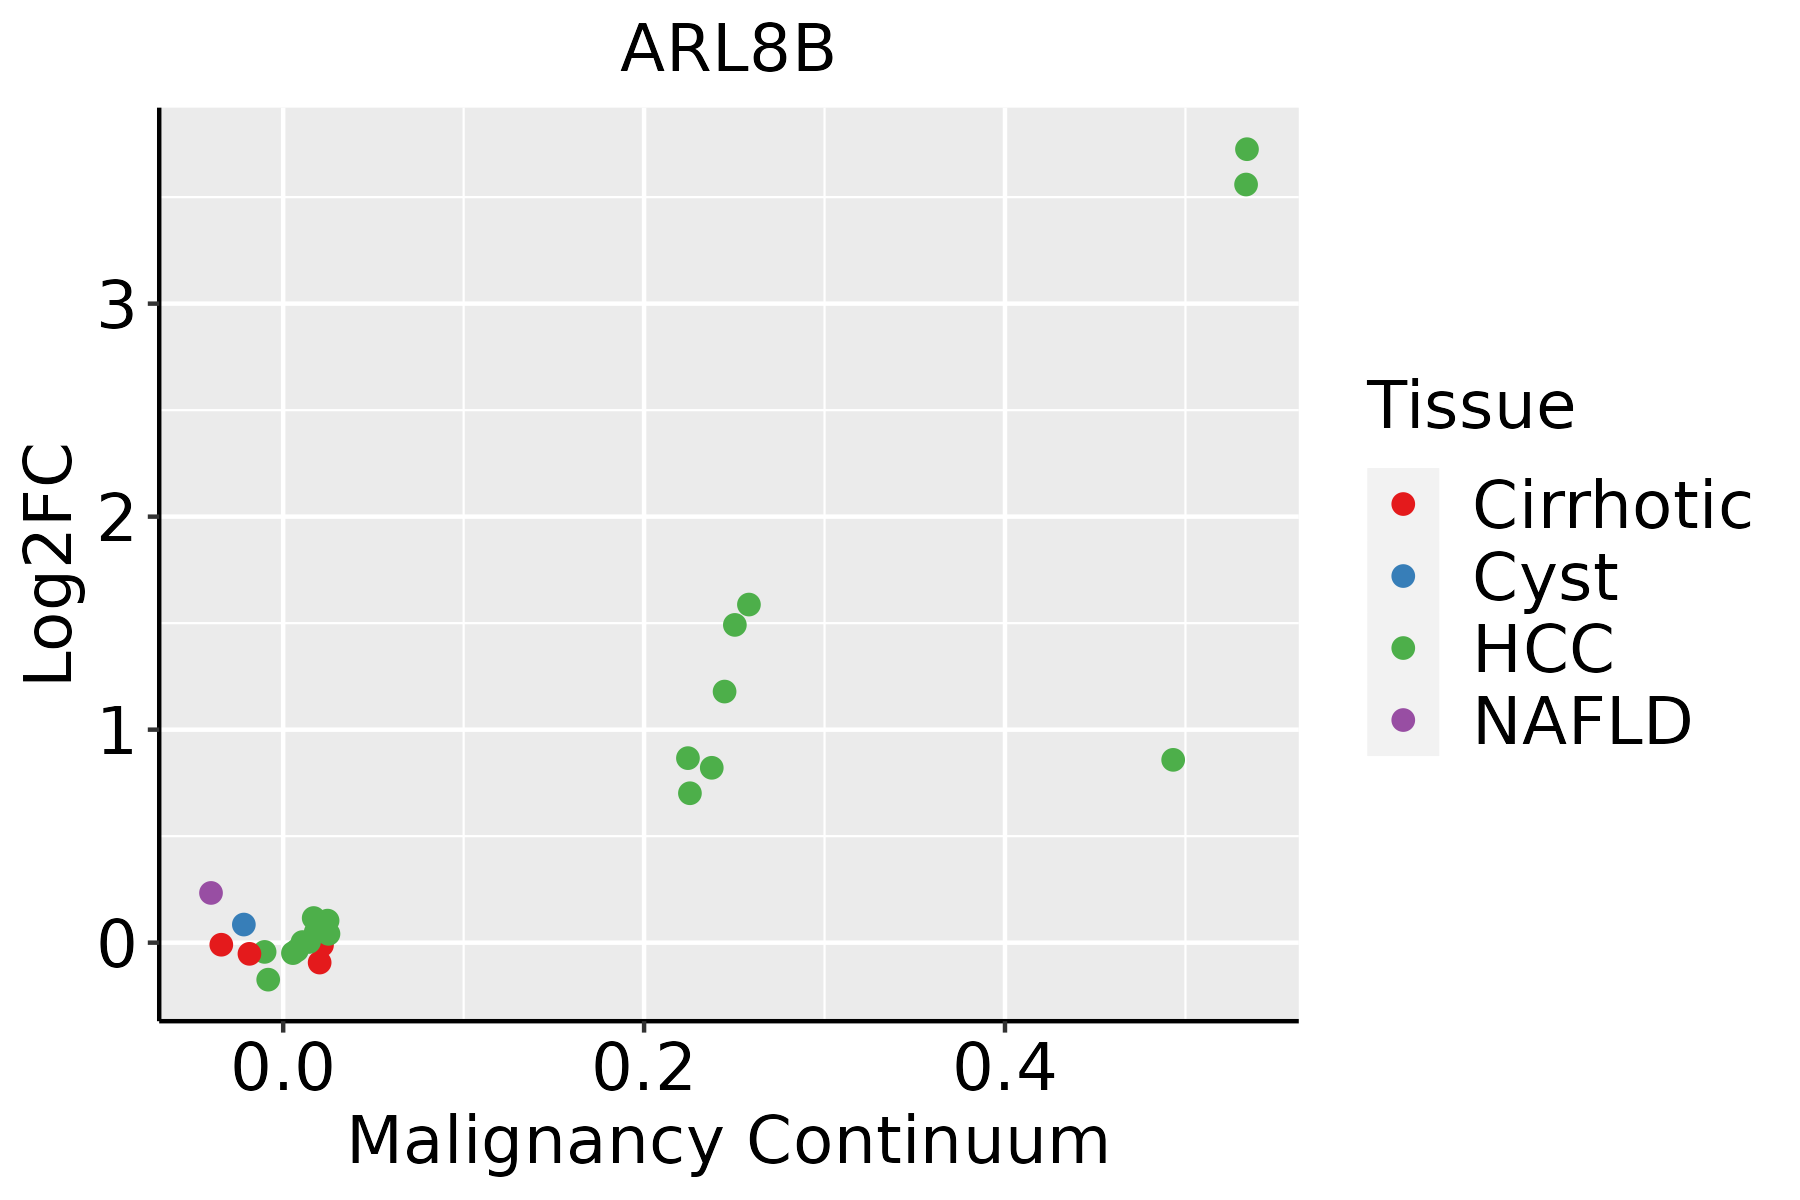 | HCC: Hepatocellular carcinoma |
| NAFLD: Non-alcoholic fatty liver disease | ||
| Lung |  | AAH: Atypical adenomatous hyperplasia |
| AIS: Adenocarcinoma in situ | ||
| IAC: Invasive lung adenocarcinoma | ||
| MIA: Minimally invasive adenocarcinoma | ||
| Oral Cavity | 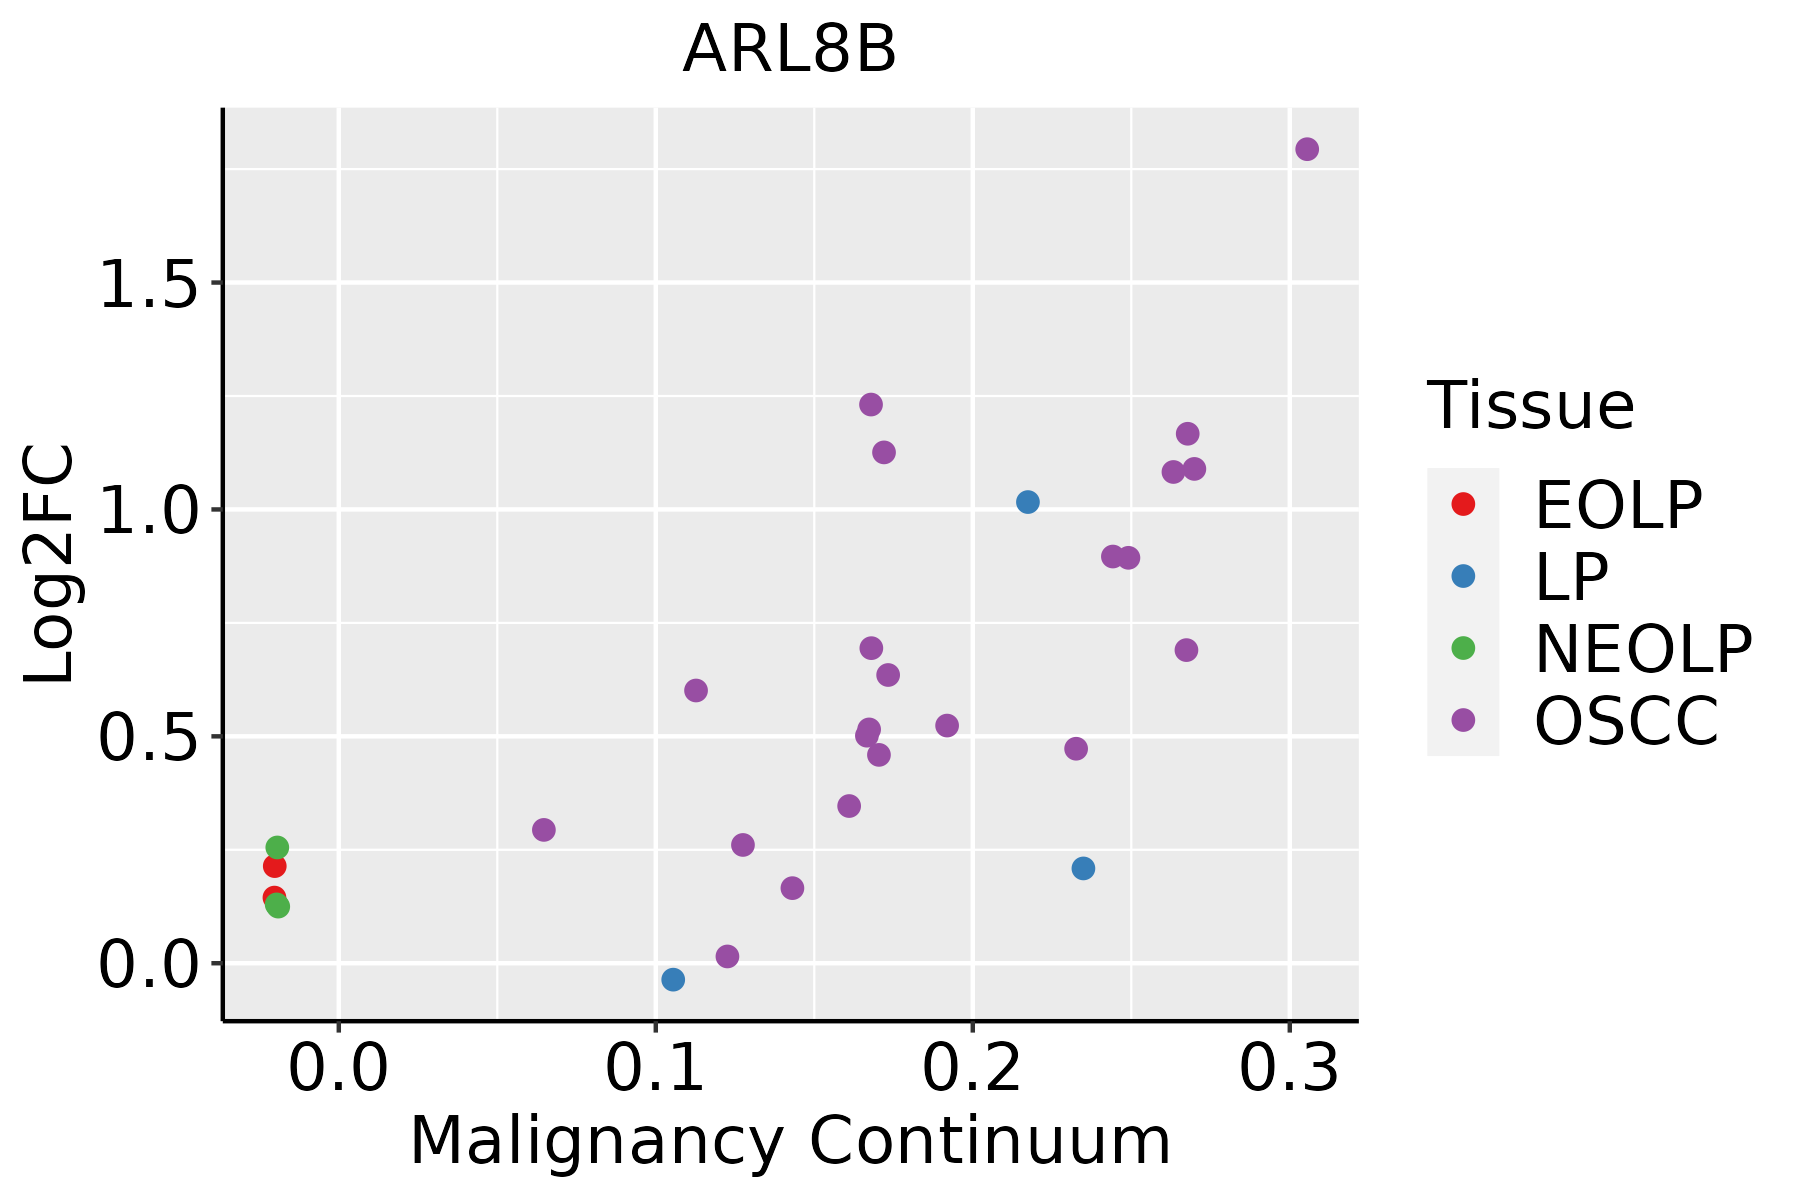 | EOLP: Erosive Oral lichen planus |
| LP: leukoplakia | ||
| NEOLP: Non-erosive oral lichen planus | ||
| OSCC: Oral squamous cell carcinoma | ||
| Skin | 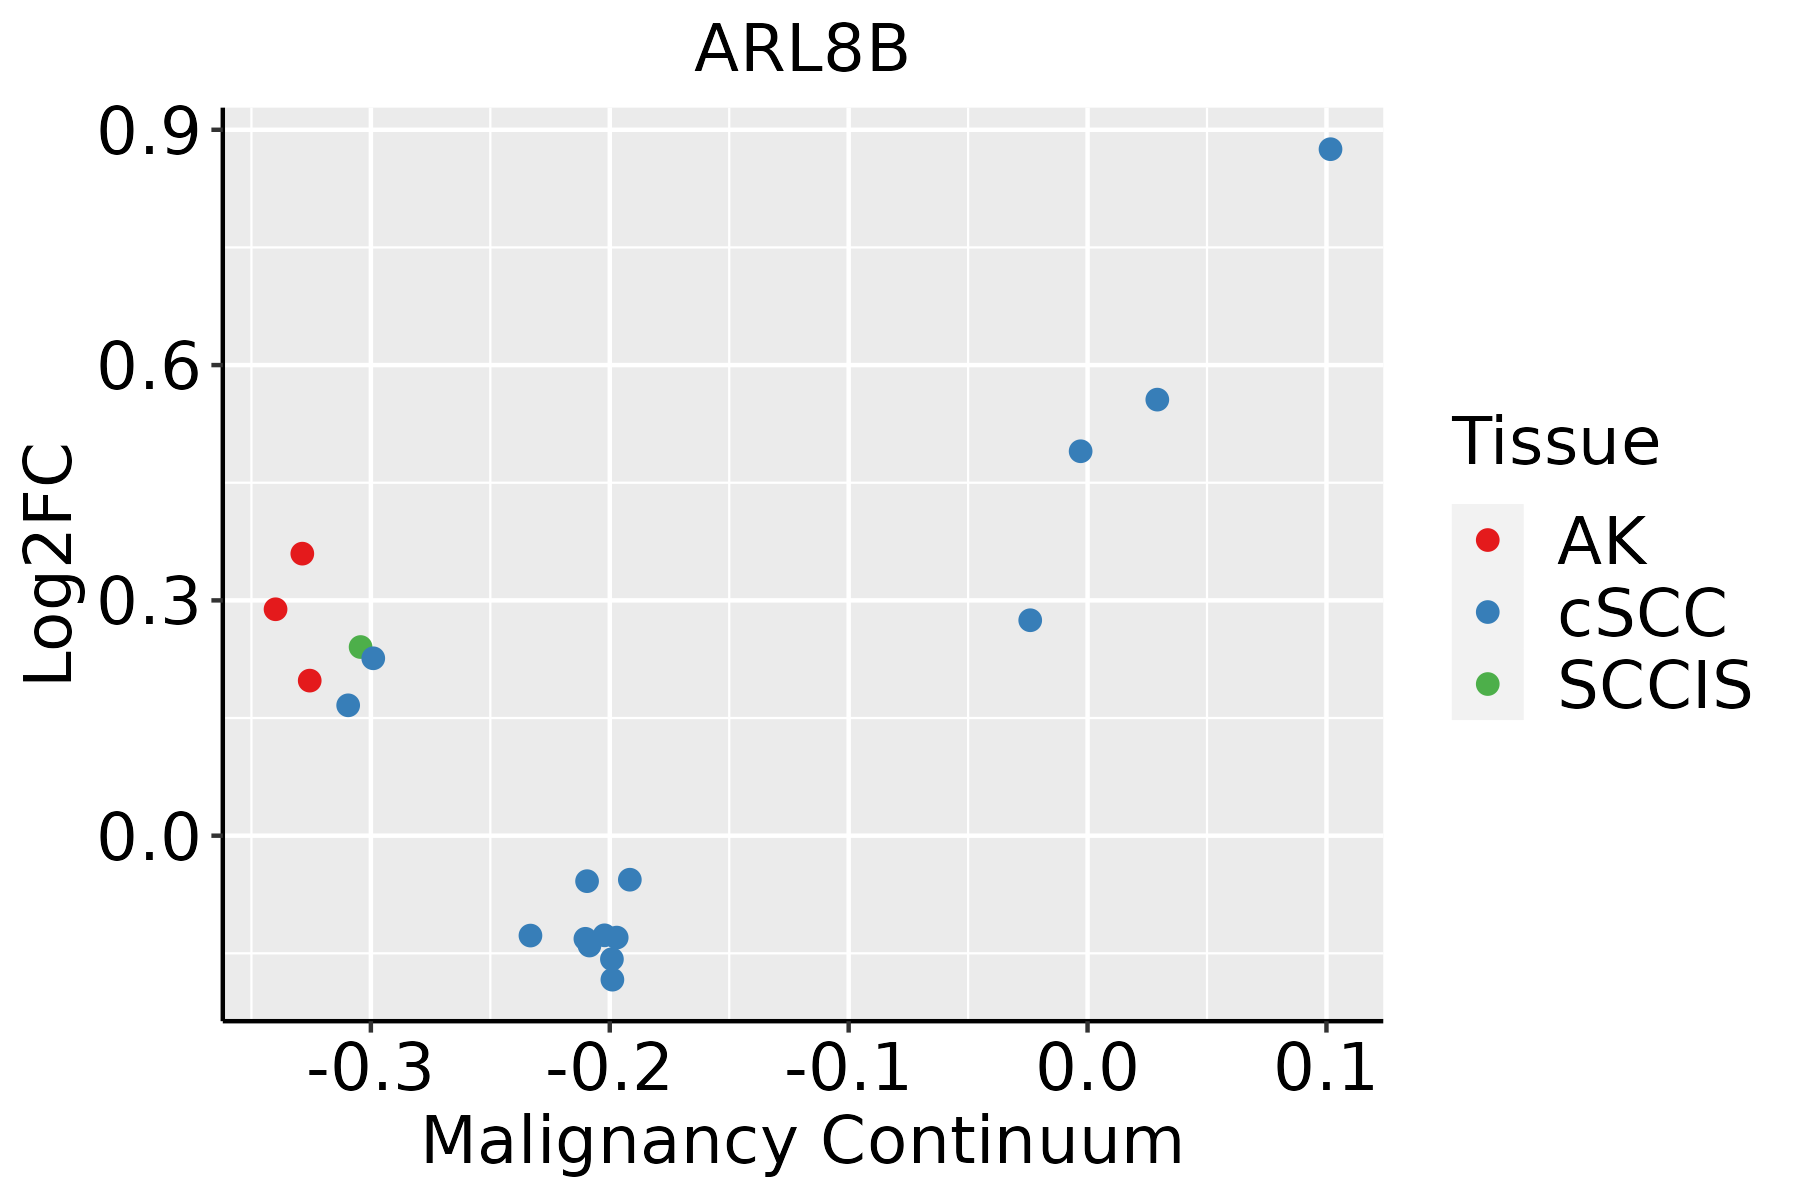 | AK: Actinic keratosis |
| cSCC: Cutaneous squamous cell carcinoma | ||
| SCCIS:squamous cell carcinoma in situ | ||
| Thyroid | 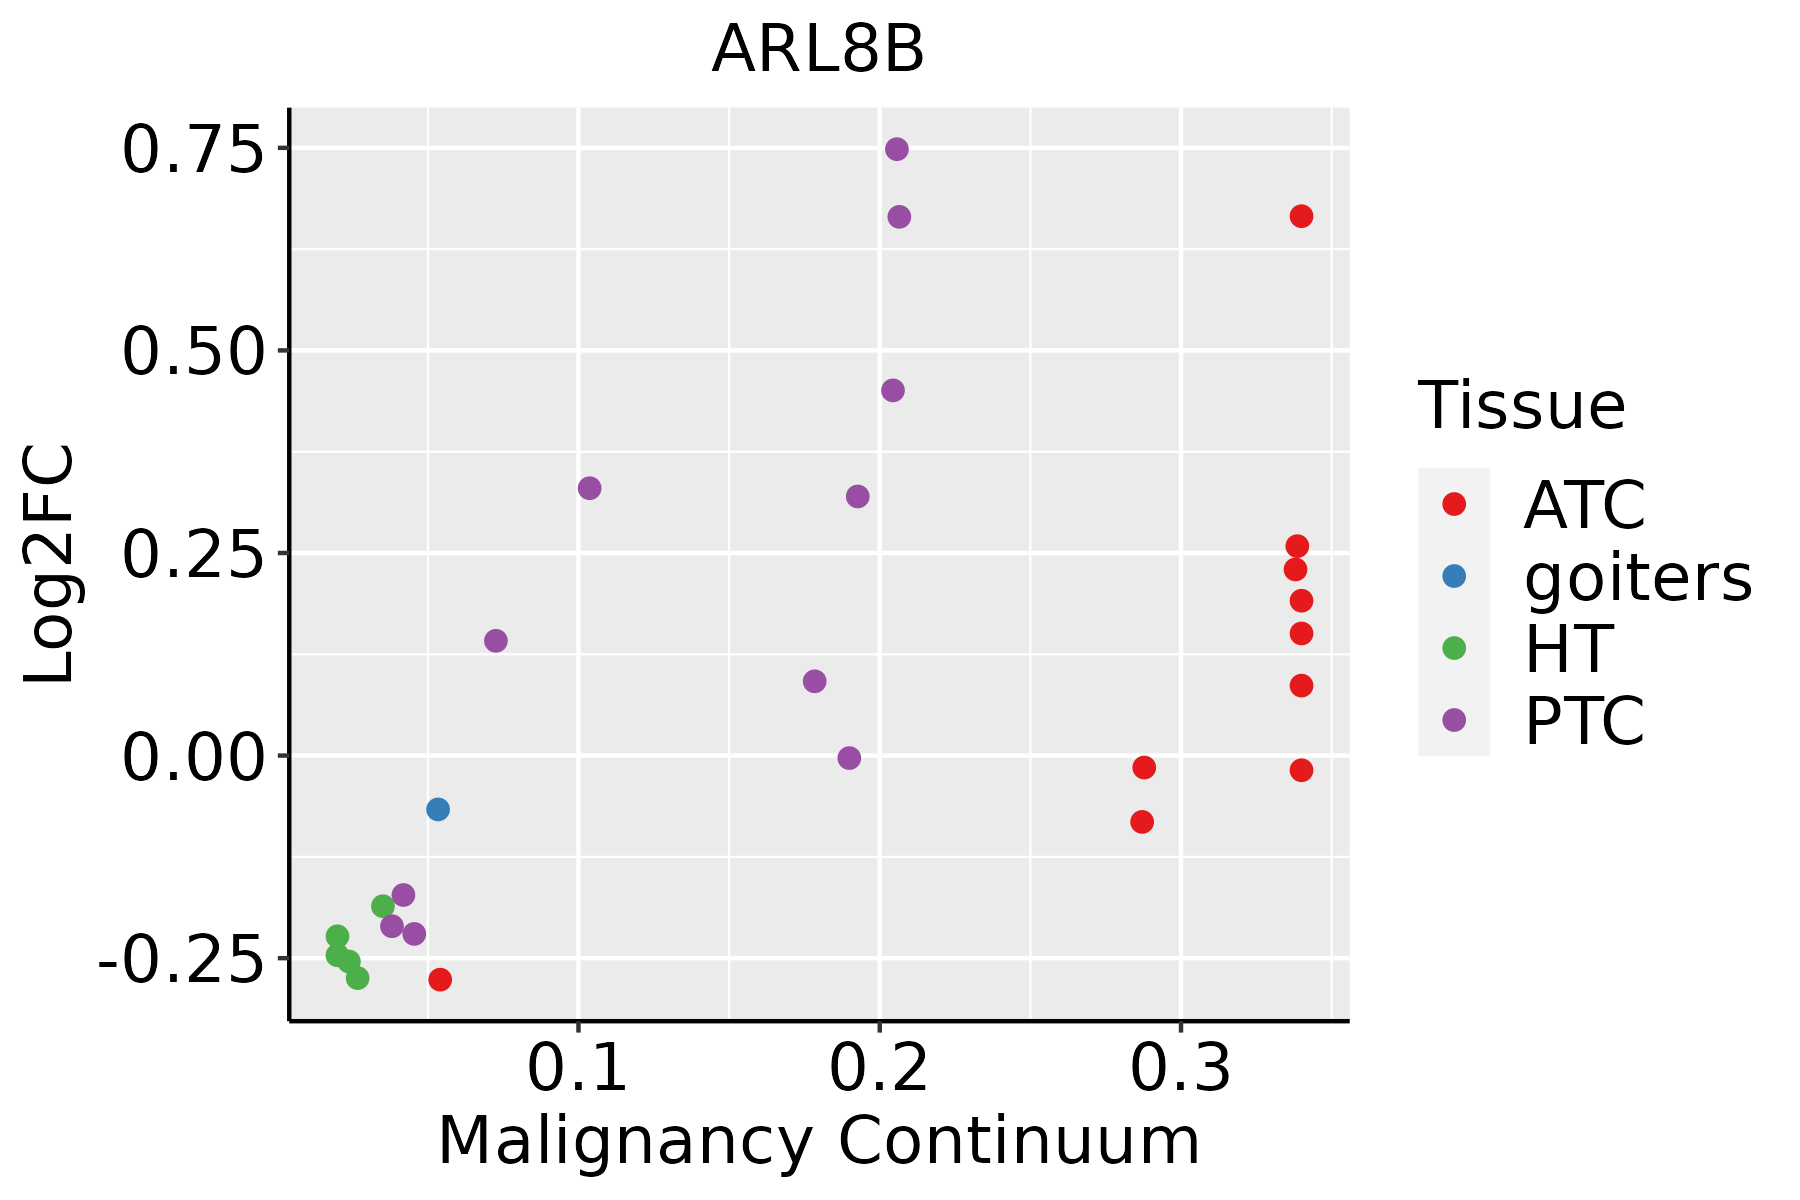 | ATC: Anaplastic thyroid cancer |
| HT: Hashimoto's thyroiditis | ||
| PTC: Papillary thyroid cancer |
| ∗log2FC in expression of this searched gene in stem-like cells from each diseased tissue sample relative to stem-like cells in normal samples in each tissue plotted against the malignancy continuum. Samples are colored based on if they are from different disease stage. |
Top |
Malignant transformation related pathway analysis |
| Find out the enriched GO biological processes and KEGG pathways involved in transition from healthy to precancer to cancer |
| Tissue | Disease Stage | Enriched GO biological Processes |
| Colorectum | AD |  |
| Colorectum | SER |  |
| Colorectum | MSS |  |
| Colorectum | MSI-H |  |
| Colorectum | FAP |  |
| ∗Top 15 enriched GO BP terms are showed in the bar plot of each disease state in each tissue. Each row represents a significant GO biological process which is colored according to the -log10(p.adjust). |
| Page: 1 2 3 4 5 6 7 8 9 |
| GO ID | Tissue | Disease Stage | Description | Gene Ratio | Bg Ratio | pvalue | p.adjust | Count |
| GO:00991113 | Oral cavity | OSCC | microtubule-based transport | 96/7305 | 190/18723 | 7.92e-04 | 4.27e-03 | 96 |
| GO:00083332 | Oral cavity | OSCC | endosome to lysosome transport | 33/7305 | 55/18723 | 1.30e-03 | 6.46e-03 | 33 |
| GO:000250410 | Oral cavity | OSCC | antigen processing and presentation of peptide or polysaccharide antigen via MHC class II | 23/7305 | 36/18723 | 2.19e-03 | 9.95e-03 | 23 |
| GO:00080891 | Oral cavity | OSCC | anterograde axonal transport | 29/7305 | 50/18723 | 5.01e-03 | 1.96e-02 | 29 |
| GO:0032366 | Oral cavity | OSCC | intracellular sterol transport | 18/7305 | 29/18723 | 1.00e-02 | 3.49e-02 | 18 |
| GO:0032367 | Oral cavity | OSCC | intracellular cholesterol transport | 18/7305 | 29/18723 | 1.00e-02 | 3.49e-02 | 18 |
| GO:0016032110 | Oral cavity | LP | viral process | 211/4623 | 415/18723 | 4.06e-31 | 3.18e-28 | 211 |
| GO:0019058110 | Oral cavity | LP | viral life cycle | 161/4623 | 317/18723 | 5.99e-24 | 2.21e-21 | 161 |
| GO:001623615 | Oral cavity | LP | macroautophagy | 135/4623 | 291/18723 | 4.71e-16 | 6.70e-14 | 135 |
| GO:0051701110 | Oral cavity | LP | biological process involved in interaction with host | 100/4623 | 203/18723 | 2.72e-14 | 3.10e-12 | 100 |
| GO:0044403110 | Oral cavity | LP | biological process involved in symbiotic interaction | 130/4623 | 290/18723 | 4.23e-14 | 4.64e-12 | 130 |
| GO:0052126110 | Oral cavity | LP | movement in host environment | 87/4623 | 175/18723 | 6.65e-13 | 5.79e-11 | 87 |
| GO:001605013 | Oral cavity | LP | vesicle organization | 128/4623 | 300/18723 | 4.96e-12 | 3.98e-10 | 128 |
| GO:000703415 | Oral cavity | LP | vacuolar transport | 74/4623 | 157/18723 | 7.85e-10 | 3.70e-08 | 74 |
| GO:001619714 | Oral cavity | LP | endosomal transport | 98/4623 | 230/18723 | 1.65e-09 | 7.50e-08 | 98 |
| GO:000703313 | Oral cavity | LP | vacuole organization | 79/4623 | 180/18723 | 1.26e-08 | 4.74e-07 | 79 |
| GO:001907613 | Oral cavity | LP | viral release from host cell | 23/4623 | 34/18723 | 1.54e-07 | 4.84e-06 | 23 |
| GO:003589013 | Oral cavity | LP | exit from host | 23/4623 | 34/18723 | 1.54e-07 | 4.84e-06 | 23 |
| GO:003589113 | Oral cavity | LP | exit from host cell | 23/4623 | 34/18723 | 1.54e-07 | 4.84e-06 | 23 |
| GO:001648214 | Oral cavity | LP | cytosolic transport | 69/4623 | 168/18723 | 2.03e-06 | 4.65e-05 | 69 |
| Page: 1 2 3 4 5 6 7 8 9 10 11 12 13 14 15 16 17 |
| Pathway ID | Tissue | Disease Stage | Description | Gene Ratio | Bg Ratio | pvalue | p.adjust | qvalue | Count |
| hsa0513220 | Cervix | CC | Salmonella infection | 74/1267 | 249/8465 | 1.33e-09 | 2.54e-08 | 1.50e-08 | 74 |
| hsa05132110 | Cervix | CC | Salmonella infection | 74/1267 | 249/8465 | 1.33e-09 | 2.54e-08 | 1.50e-08 | 74 |
| hsa05132211 | Esophagus | ESCC | Salmonella infection | 191/4205 | 249/8465 | 6.51e-19 | 5.45e-17 | 2.79e-17 | 191 |
| hsa05132310 | Esophagus | ESCC | Salmonella infection | 191/4205 | 249/8465 | 6.51e-19 | 5.45e-17 | 2.79e-17 | 191 |
| hsa0513242 | Liver | HCC | Salmonella infection | 178/4020 | 249/8465 | 5.90e-15 | 1.98e-13 | 1.10e-13 | 178 |
| hsa0513252 | Liver | HCC | Salmonella infection | 178/4020 | 249/8465 | 5.90e-15 | 1.98e-13 | 1.10e-13 | 178 |
| hsa0513216 | Lung | IAC | Salmonella infection | 52/1053 | 249/8465 | 9.46e-05 | 1.28e-03 | 8.50e-04 | 52 |
| hsa0513217 | Lung | IAC | Salmonella infection | 52/1053 | 249/8465 | 9.46e-05 | 1.28e-03 | 8.50e-04 | 52 |
| hsa0513223 | Lung | AIS | Salmonella infection | 50/961 | 249/8465 | 3.47e-05 | 5.62e-04 | 3.59e-04 | 50 |
| hsa0513233 | Lung | AIS | Salmonella infection | 50/961 | 249/8465 | 3.47e-05 | 5.62e-04 | 3.59e-04 | 50 |
| hsa0513230 | Oral cavity | OSCC | Salmonella infection | 174/3704 | 249/8465 | 2.67e-17 | 1.49e-15 | 7.58e-16 | 174 |
| hsa05132114 | Oral cavity | OSCC | Salmonella infection | 174/3704 | 249/8465 | 2.67e-17 | 1.49e-15 | 7.58e-16 | 174 |
| hsa05132210 | Oral cavity | LP | Salmonella infection | 128/2418 | 249/8465 | 1.17e-14 | 2.79e-13 | 1.80e-13 | 128 |
| hsa0513238 | Oral cavity | LP | Salmonella infection | 128/2418 | 249/8465 | 1.17e-14 | 2.79e-13 | 1.80e-13 | 128 |
| Page: 1 |
Top |
Cell-cell communication analysis |
| Identification of potential cell-cell interactions between two cell types and their ligand-receptor pairs for different disease states |
| Ligand | Receptor | LRpair | Pathway | Tissue | Disease Stage |
| Page: 1 |
Top |
Single-cell gene regulatory network inference analysis |
| Find out the significant the regulons (TFs) and the target genes of each regulon across cell types for different disease states |
| TF | Cell Type | Tissue | Disease Stage | Target Gene | RSS | Regulon Activity |
| ∗The dot plots of a searched regulon are shown for all cell subpopulations in each disease state of each tissue based on the regulon specific score inferred using pySCENIC and by calculating the average expression. |
| Page: 1 |
Top |
Somatic mutation of malignant transformation related genes |
| Annotation of somatic variants for genes involved in malignant transformation |
| Hugo Symbol | Variant Class | Variant Classification | dbSNP RS | HGVSc | HGVSp | HGVSp Short | SWISSPROT | BIOTYPE | SIFT | PolyPhen | Tumor Sample Barcode | Tissue | Histology | Sex | Age | Stage | Therapy Types | Drugs | Outcome |
| ARL8B | SNV | Missense_Mutation | c.515N>G | p.Ile172Ser | p.I172S | Q9NVJ2 | protein_coding | tolerated(0.21) | benign(0.031) | TCGA-AN-A0XN-01 | Breast | breast invasive carcinoma | Female | >=65 | III/IV | Unknown | Unknown | SD | |
| ARL8B | SNV | Missense_Mutation | rs766948599 | c.323G>A | p.Arg108Gln | p.R108Q | Q9NVJ2 | protein_coding | tolerated(0.06) | benign(0.006) | TCGA-AA-A010-01 | Colorectum | colon adenocarcinoma | Female | <65 | I/II | Chemotherapy | folinic | CR |
| ARL8B | SNV | Missense_Mutation | c.344N>C | p.Leu115Pro | p.L115P | Q9NVJ2 | protein_coding | deleterious(0) | probably_damaging(0.991) | TCGA-AA-A01P-01 | Colorectum | colon adenocarcinoma | Female | >=65 | III/IV | Unknown | Unknown | PD | |
| ARL8B | SNV | Missense_Mutation | rs780847749 | c.460N>A | p.Asp154Asn | p.D154N | Q9NVJ2 | protein_coding | tolerated(0.19) | benign(0.031) | TCGA-AD-6964-01 | Colorectum | colon adenocarcinoma | Male | <65 | III/IV | Chemotherapy | folfox | PD |
| ARL8B | SNV | Missense_Mutation | c.150N>G | p.Ile50Met | p.I50M | Q9NVJ2 | protein_coding | deleterious(0) | probably_damaging(0.946) | TCGA-AZ-6598-01 | Colorectum | colon adenocarcinoma | Female | >=65 | I/II | Unknown | Unknown | SD | |
| ARL8B | SNV | Missense_Mutation | novel | c.308N>G | p.Lys103Arg | p.K103R | Q9NVJ2 | protein_coding | tolerated(0.09) | probably_damaging(0.966) | TCGA-CA-6717-01 | Colorectum | colon adenocarcinoma | Male | <65 | I/II | Chemotherapy | oxaliplatin | CR |
| ARL8B | SNV | Missense_Mutation | rs747994602 | c.193G>A | p.Val65Ile | p.V65I | Q9NVJ2 | protein_coding | deleterious(0.04) | probably_damaging(0.999) | TCGA-F4-6704-01 | Colorectum | colon adenocarcinoma | Male | <65 | III/IV | Unknown | Unknown | SD |
| ARL8B | SNV | Missense_Mutation | novel | c.538N>T | p.His180Tyr | p.H180Y | Q9NVJ2 | protein_coding | tolerated(0.09) | possibly_damaging(0.855) | TCGA-A5-A1OF-01 | Endometrium | uterine corpus endometrioid carcinoma | Female | <65 | I/II | Unknown | Unknown | SD |
| ARL8B | SNV | Missense_Mutation | novel | c.398A>G | p.Asp133Gly | p.D133G | Q9NVJ2 | protein_coding | deleterious(0) | probably_damaging(0.97) | TCGA-AP-A1DK-01 | Endometrium | uterine corpus endometrioid carcinoma | Female | <65 | I/II | Unknown | Unknown | SD |
| ARL8B | SNV | Missense_Mutation | rs747994602 | c.193G>A | p.Val65Ile | p.V65I | Q9NVJ2 | protein_coding | deleterious(0.04) | probably_damaging(0.999) | TCGA-AX-A06F-01 | Endometrium | uterine corpus endometrioid carcinoma | Female | <65 | III/IV | Chemotherapy | carboplatin | SD |
| Page: 1 2 3 |
Top |
Related drugs of malignant transformation related genes |
| Identification of chemicals and drugs interact with genes involved in malignant transfromation |
| (DGIdb 4.0) |
| Entrez ID | Symbol | Category | Interaction Types | Drug Claim Name | Drug Name | PMIDs |
| Page: 1 |

Copyright 2023-Present -The University of Texas Health Science Center at Houston |