
|
|||||
|
 | |
| |
| |
| |
| |
| |
|
Gene: ACSL3 |
Gene summary for ACSL3 |
| Gene information | Species | Human | Gene symbol | ACSL3 | Gene ID | 2181 |
| Gene name | acyl-CoA synthetase long chain family member 3 | |
| Gene Alias | ACS3 | |
| Cytomap | 2q36.1 | |
| Gene Type | protein-coding | GO ID | GO:0001676 | UniProtAcc | A0A024R497 |
Top |
Malignant transformation analysis |
| Identification of the aberrant gene expression in precancerous and cancerous lesions by comparing the gene expression of stem-like cells in diseased tissues with normal stem cells |
| Entrez ID | Symbol | Replicates | Species | Organ | Tissue | Adj P-value | Log2FC | Malignancy |
| 2181 | ACSL3 | CA_HPV_1 | Human | Cervix | CC | 1.52e-02 | -1.06e-02 | 0.0264 |
| 2181 | ACSL3 | CCI_2 | Human | Cervix | CC | 1.29e-03 | 1.12e+00 | 0.5249 |
| 2181 | ACSL3 | CCI_3 | Human | Cervix | CC | 6.28e-04 | 7.30e-01 | 0.516 |
| 2181 | ACSL3 | HTA11_3410_2000001011 | Human | Colorectum | AD | 1.31e-13 | -5.55e-01 | 0.0155 |
| 2181 | ACSL3 | HTA11_696_2000001011 | Human | Colorectum | AD | 3.93e-02 | -2.33e-01 | -0.1464 |
| 2181 | ACSL3 | HTA11_866_3004761011 | Human | Colorectum | AD | 2.32e-08 | -4.99e-01 | 0.096 |
| 2181 | ACSL3 | HTA11_10711_2000001011 | Human | Colorectum | AD | 4.35e-04 | -5.11e-01 | 0.0338 |
| 2181 | ACSL3 | HTA11_7696_3000711011 | Human | Colorectum | AD | 2.96e-17 | -4.91e-01 | 0.0674 |
| 2181 | ACSL3 | HTA11_6818_2000001021 | Human | Colorectum | AD | 4.60e-03 | -5.24e-01 | 0.0588 |
| 2181 | ACSL3 | HTA11_99999974143_84620 | Human | Colorectum | MSS | 1.91e-16 | -4.38e-01 | 0.3005 |
| 2181 | ACSL3 | F007 | Human | Colorectum | FAP | 2.16e-05 | -4.56e-01 | 0.1176 |
| 2181 | ACSL3 | A002-C-010 | Human | Colorectum | FAP | 1.26e-07 | -3.28e-01 | 0.242 |
| 2181 | ACSL3 | A001-C-207 | Human | Colorectum | FAP | 3.05e-05 | -3.53e-01 | 0.1278 |
| 2181 | ACSL3 | A015-C-203 | Human | Colorectum | FAP | 1.84e-23 | -4.82e-01 | -0.1294 |
| 2181 | ACSL3 | A015-C-204 | Human | Colorectum | FAP | 8.32e-11 | -5.33e-01 | -0.0228 |
| 2181 | ACSL3 | A014-C-040 | Human | Colorectum | FAP | 1.01e-03 | -4.05e-01 | -0.1184 |
| 2181 | ACSL3 | A002-C-201 | Human | Colorectum | FAP | 9.89e-15 | -4.13e-01 | 0.0324 |
| 2181 | ACSL3 | A002-C-203 | Human | Colorectum | FAP | 2.06e-11 | -4.54e-01 | 0.2786 |
| 2181 | ACSL3 | A001-C-119 | Human | Colorectum | FAP | 1.26e-11 | -5.56e-01 | -0.1557 |
| 2181 | ACSL3 | A001-C-108 | Human | Colorectum | FAP | 8.30e-19 | -4.50e-01 | -0.0272 |
| Page: 1 2 3 4 5 6 7 8 9 |
| Tissue | Expression Dynamics | Abbreviation |
| Cervix | 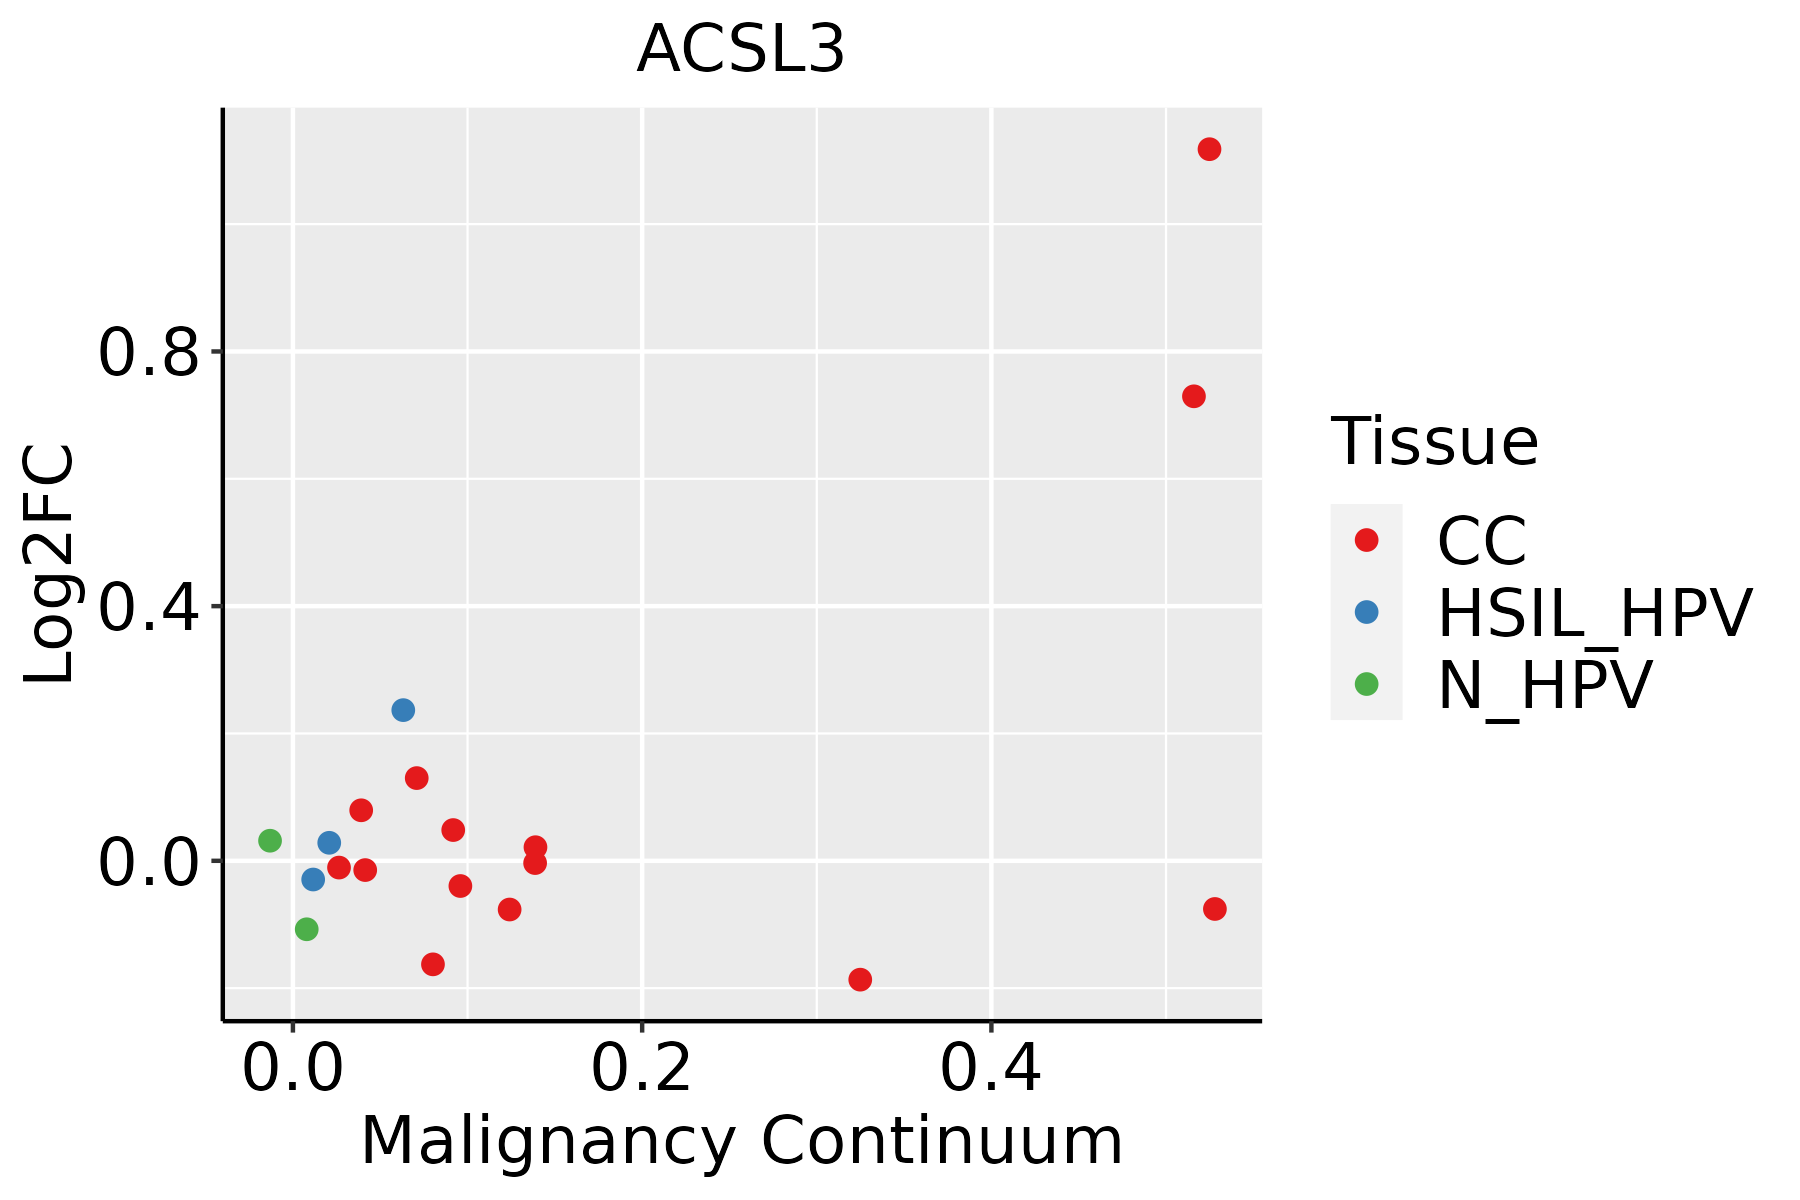 | CC: Cervix cancer |
| HSIL_HPV: HPV-infected high-grade squamous intraepithelial lesions | ||
| N_HPV: HPV-infected normal cervix | ||
| Colorectum (GSE201348) |  | FAP: Familial adenomatous polyposis |
| CRC: Colorectal cancer | ||
| Colorectum (HTA11) |  | AD: Adenomas |
| SER: Sessile serrated lesions | ||
| MSI-H: Microsatellite-high colorectal cancer | ||
| MSS: Microsatellite stable colorectal cancer | ||
| Esophagus | 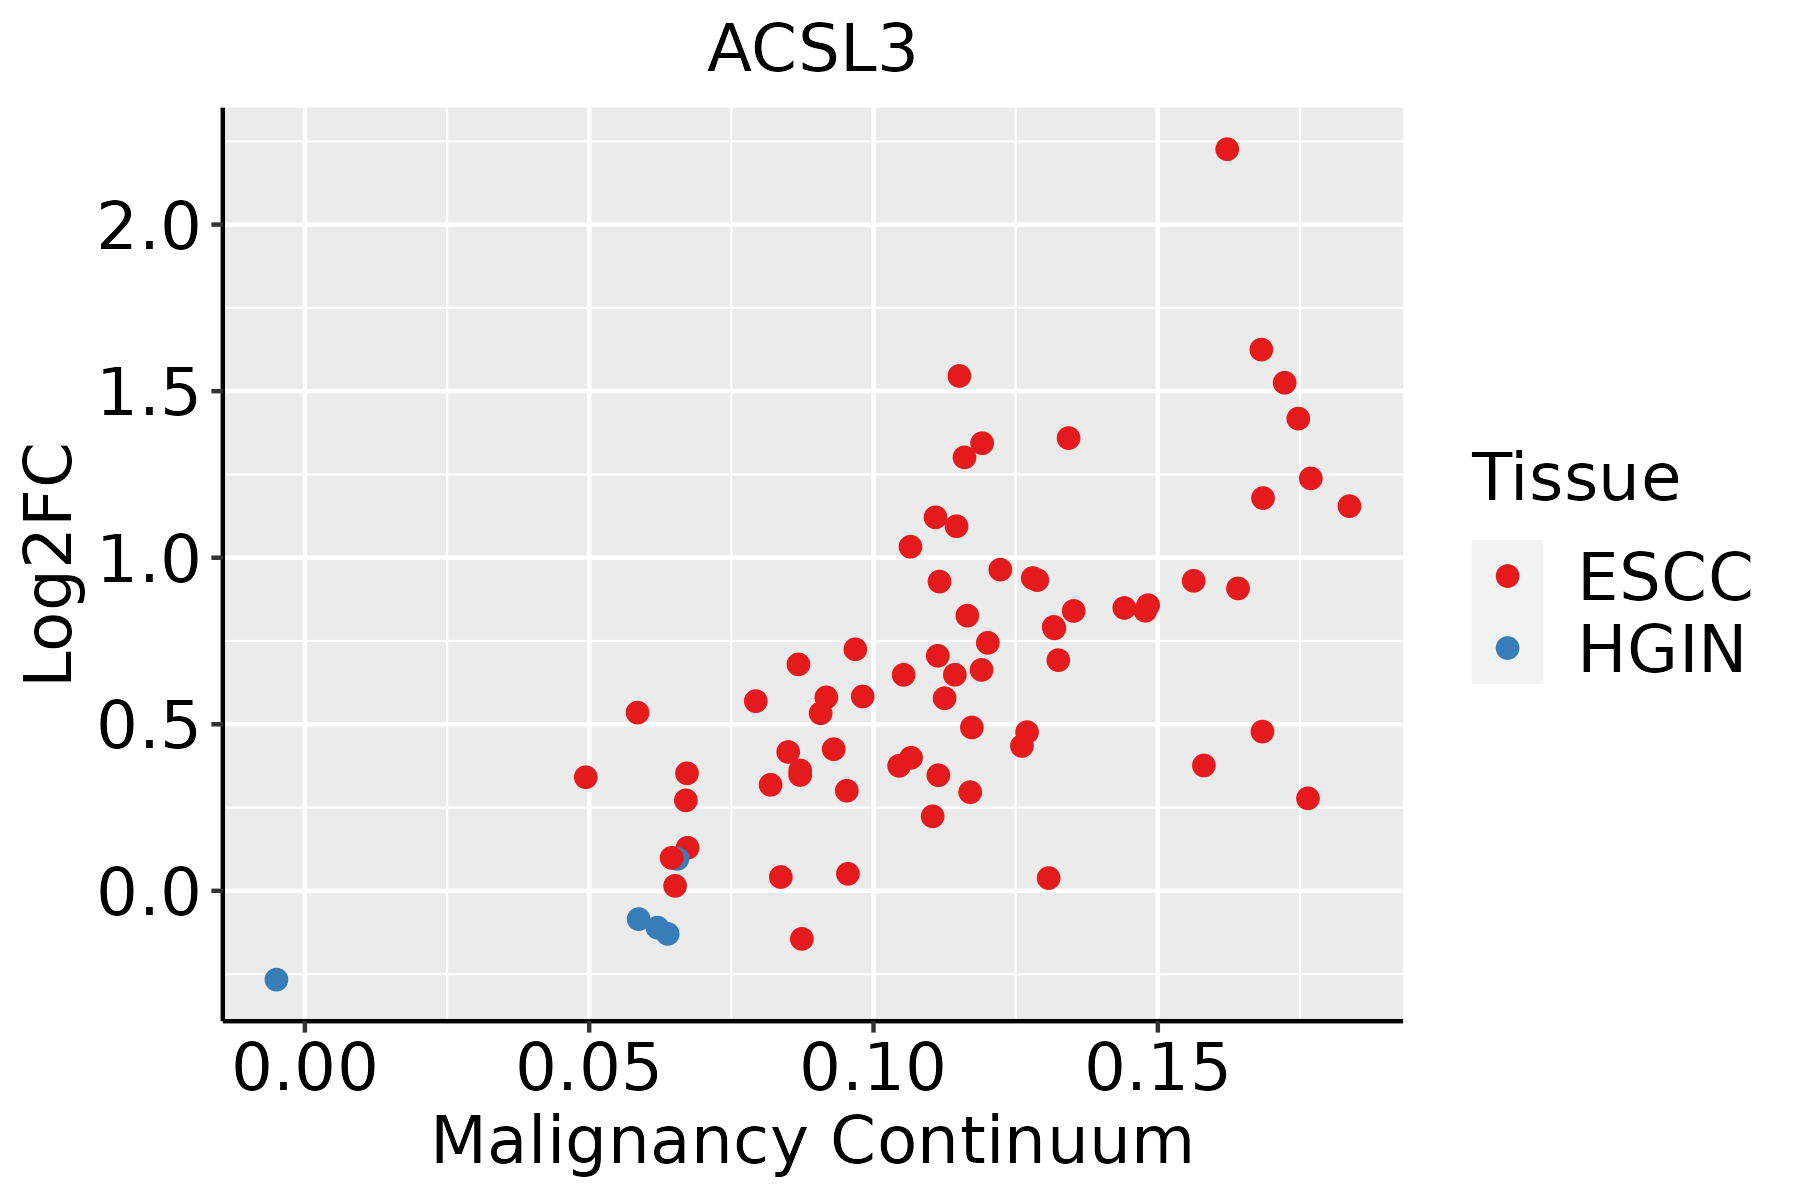 | ESCC: Esophageal squamous cell carcinoma |
| HGIN: High-grade intraepithelial neoplasias | ||
| LGIN: Low-grade intraepithelial neoplasias | ||
| Liver | 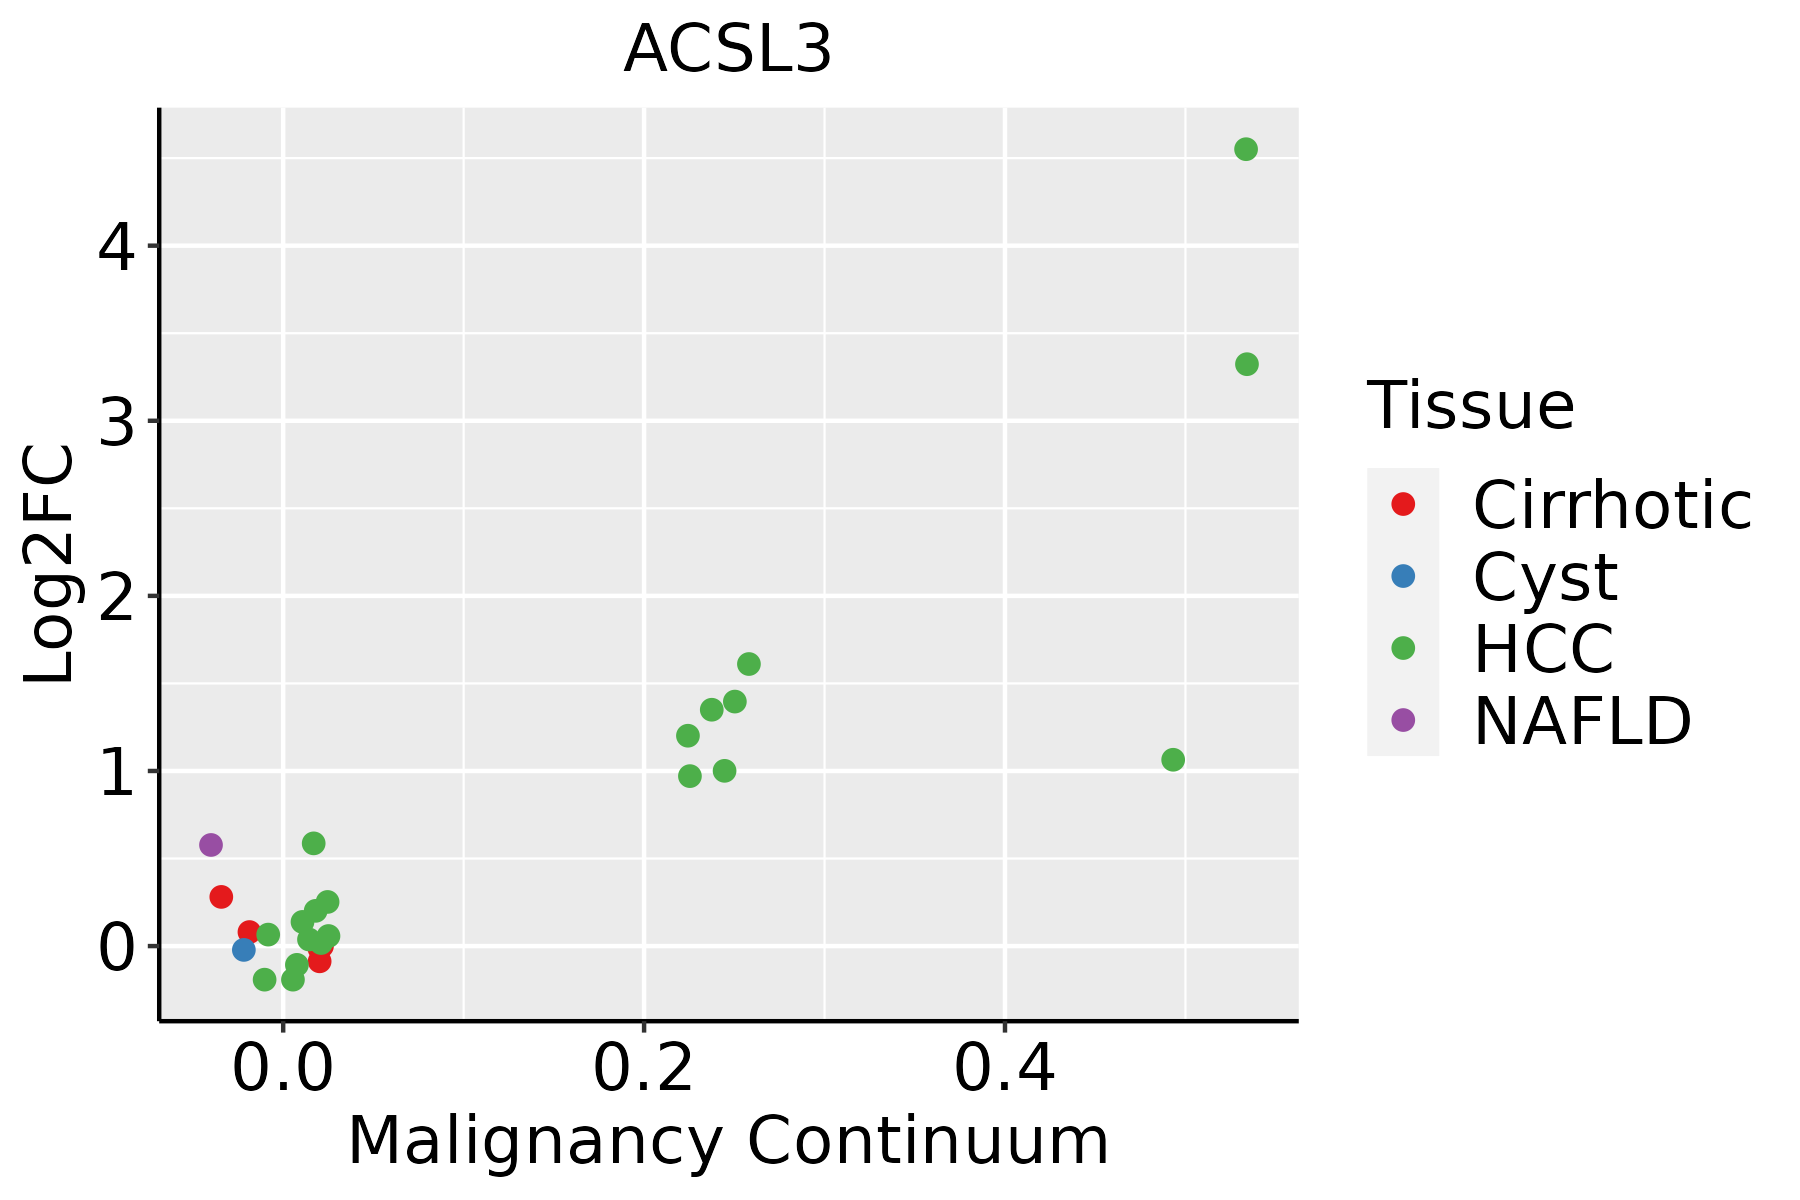 | HCC: Hepatocellular carcinoma |
| NAFLD: Non-alcoholic fatty liver disease | ||
| Lung | 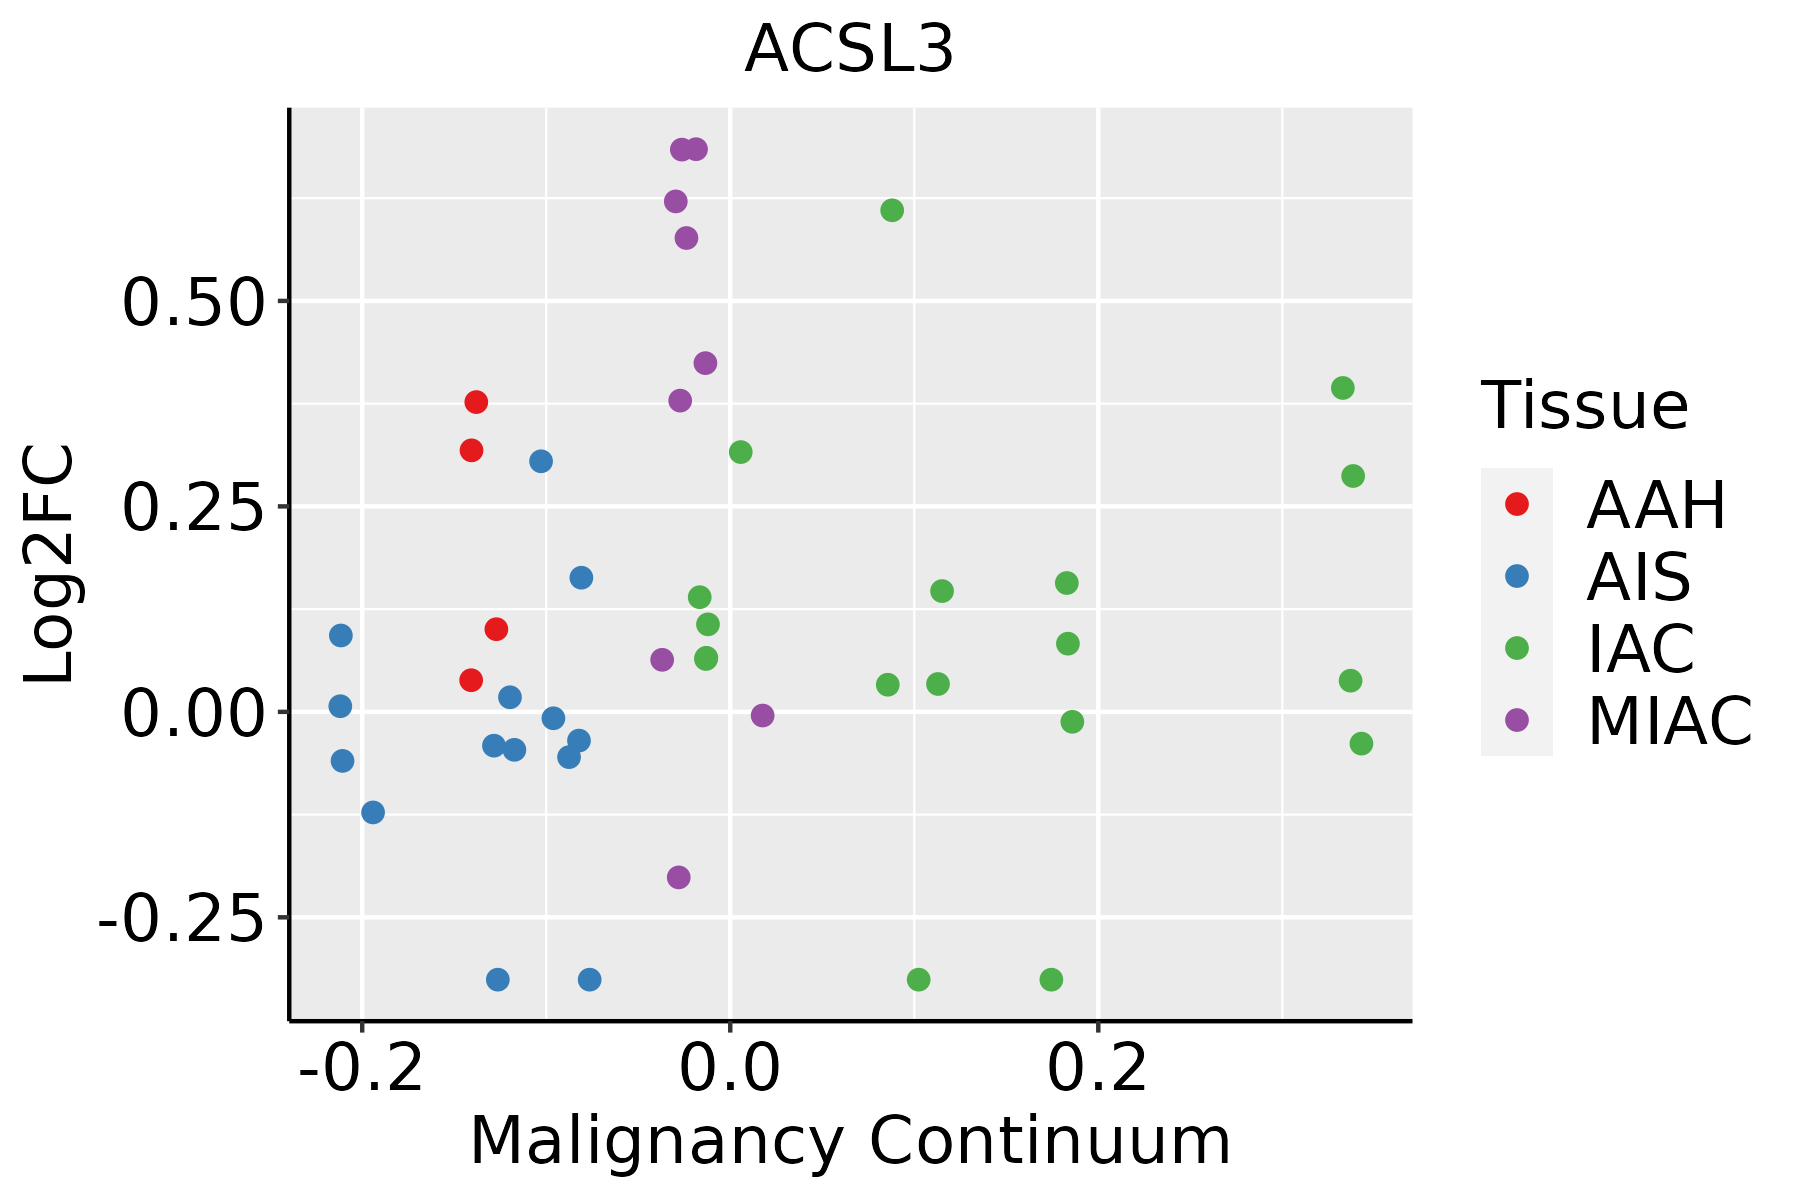 | AAH: Atypical adenomatous hyperplasia |
| AIS: Adenocarcinoma in situ | ||
| IAC: Invasive lung adenocarcinoma | ||
| MIA: Minimally invasive adenocarcinoma | ||
| Oral Cavity | 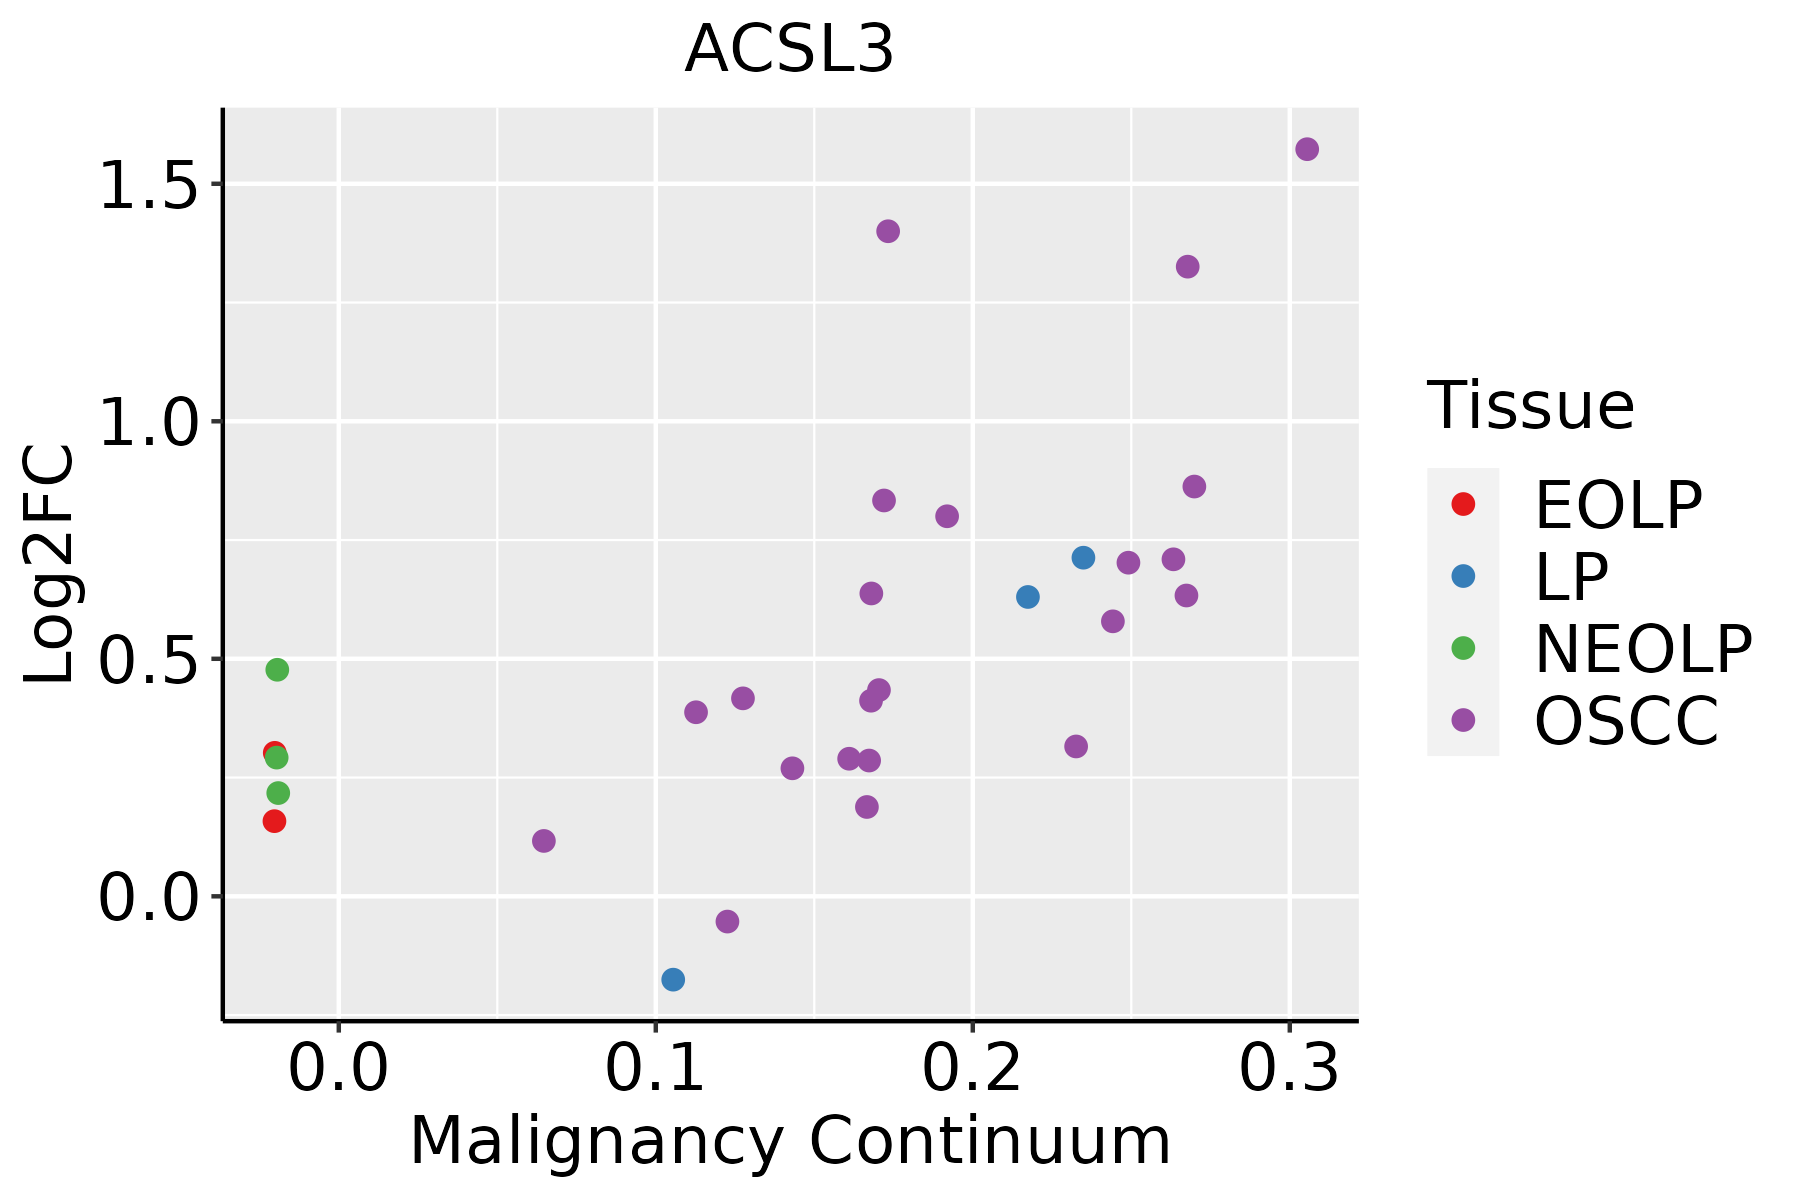 | EOLP: Erosive Oral lichen planus |
| LP: leukoplakia | ||
| NEOLP: Non-erosive oral lichen planus | ||
| OSCC: Oral squamous cell carcinoma | ||
| Prostate |  | BPH: Benign Prostatic Hyperplasia |
| Skin | 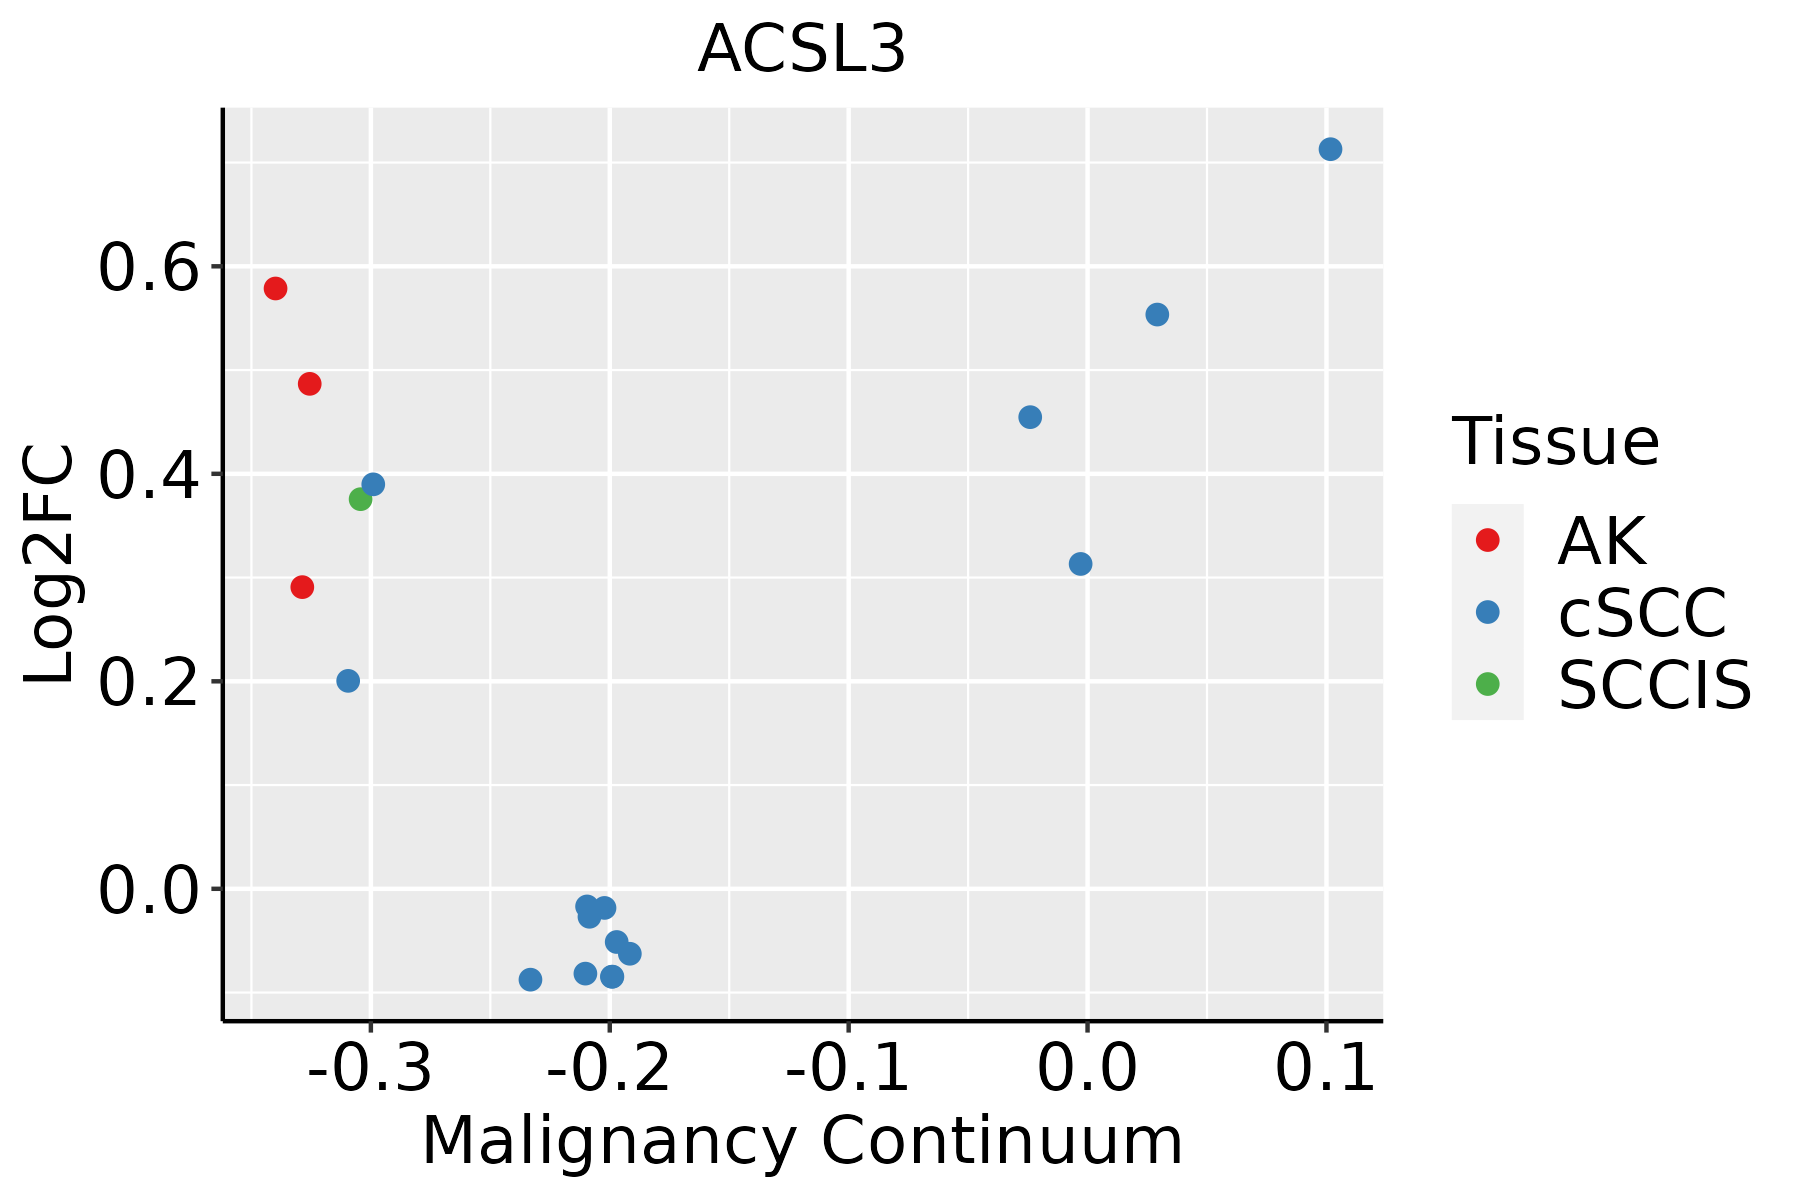 | AK: Actinic keratosis |
| cSCC: Cutaneous squamous cell carcinoma | ||
| SCCIS:squamous cell carcinoma in situ | ||
| Thyroid | 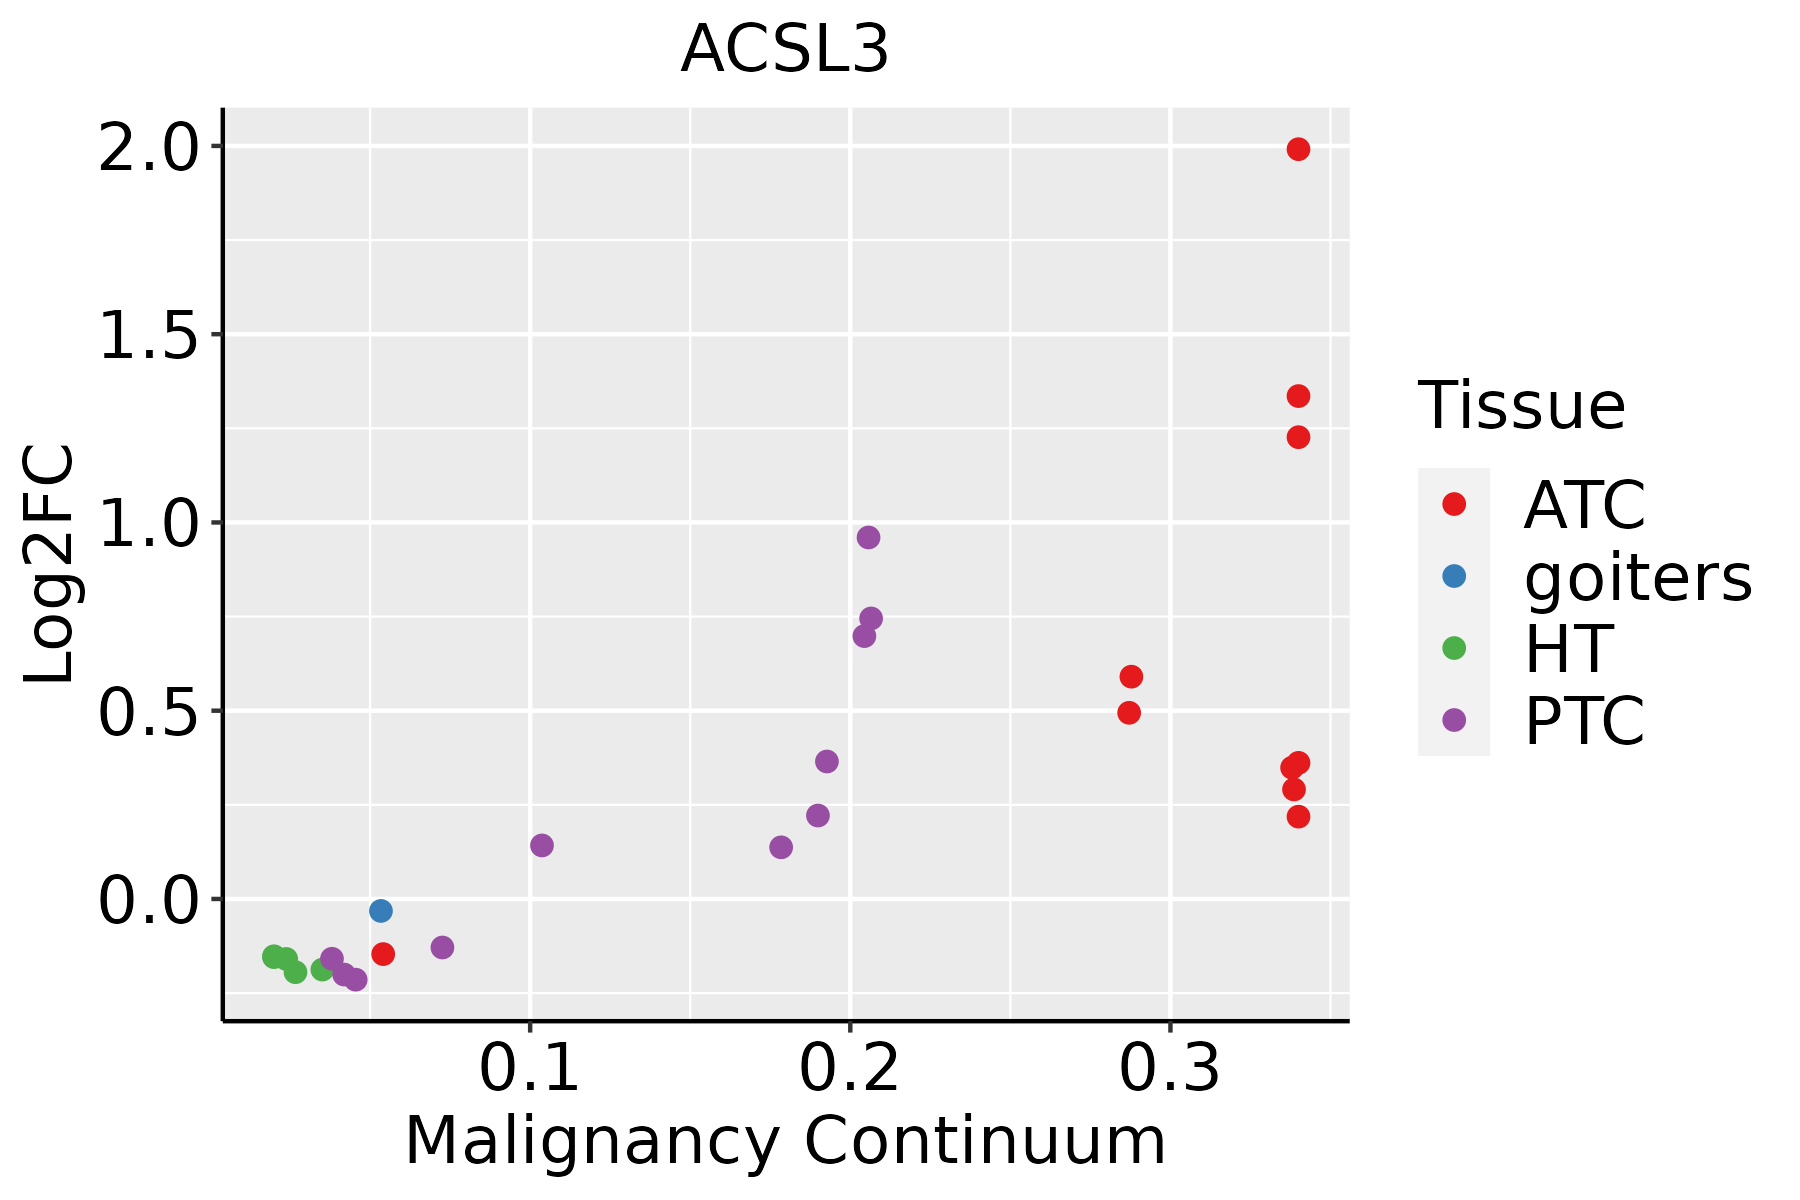 | ATC: Anaplastic thyroid cancer |
| HT: Hashimoto's thyroiditis | ||
| PTC: Papillary thyroid cancer |
| ∗log2FC in expression of this searched gene in stem-like cells from each diseased tissue sample relative to stem-like cells in normal samples in each tissue plotted against the malignancy continuum. Samples are colored based on if they are from different disease stage. |
Top |
Malignant transformation related pathway analysis |
| Find out the enriched GO biological processes and KEGG pathways involved in transition from healthy to precancer to cancer |
| Tissue | Disease Stage | Enriched GO biological Processes |
| Colorectum | AD |  |
| Colorectum | SER |  |
| Colorectum | MSS |  |
| Colorectum | MSI-H |  |
| Colorectum | FAP |  |
| ∗Top 15 enriched GO BP terms are showed in the bar plot of each disease state in each tissue. Each row represents a significant GO biological process which is colored according to the -log10(p.adjust). |
| Page: 1 2 3 4 5 6 7 8 9 |
| GO ID | Tissue | Disease Stage | Description | Gene Ratio | Bg Ratio | pvalue | p.adjust | Count |
| GO:19030764 | Colorectum | CRC | regulation of protein localization to plasma membrane | 31/2078 | 104/18723 | 1.66e-07 | 1.72e-05 | 31 |
| GO:00619514 | Colorectum | CRC | establishment of protein localization to plasma membrane | 22/2078 | 60/18723 | 1.89e-07 | 1.92e-05 | 22 |
| GO:00091505 | Colorectum | CRC | purine ribonucleotide metabolic process | 74/2078 | 368/18723 | 2.58e-07 | 2.38e-05 | 74 |
| GO:00061635 | Colorectum | CRC | purine nucleotide metabolic process | 78/2078 | 396/18723 | 2.98e-07 | 2.59e-05 | 78 |
| GO:00988764 | Colorectum | CRC | vesicle-mediated transport to the plasma membrane | 36/2078 | 136/18723 | 4.65e-07 | 3.40e-05 | 36 |
| GO:00092594 | Colorectum | CRC | ribonucleotide metabolic process | 75/2078 | 385/18723 | 7.83e-07 | 5.04e-05 | 75 |
| GO:00725215 | Colorectum | CRC | purine-containing compound metabolic process | 79/2078 | 416/18723 | 1.15e-06 | 6.75e-05 | 79 |
| GO:00196934 | Colorectum | CRC | ribose phosphate metabolic process | 75/2078 | 396/18723 | 2.36e-06 | 1.13e-04 | 75 |
| GO:00512225 | Colorectum | CRC | positive regulation of protein transport | 61/2078 | 303/18723 | 2.73e-06 | 1.27e-04 | 61 |
| GO:00068933 | Colorectum | CRC | Golgi to plasma membrane transport | 20/2078 | 60/18723 | 3.80e-06 | 1.61e-04 | 20 |
| GO:00481935 | Colorectum | CRC | Golgi vesicle transport | 59/2078 | 296/18723 | 5.47e-06 | 2.17e-04 | 59 |
| GO:19049515 | Colorectum | CRC | positive regulation of establishment of protein localization | 62/2078 | 319/18723 | 7.44e-06 | 2.72e-04 | 62 |
| GO:19054774 | Colorectum | CRC | positive regulation of protein localization to membrane | 28/2078 | 106/18723 | 8.84e-06 | 3.11e-04 | 28 |
| GO:00901505 | Colorectum | CRC | establishment of protein localization to membrane | 51/2078 | 260/18723 | 3.59e-05 | 9.05e-04 | 51 |
| GO:19043774 | Colorectum | CRC | positive regulation of protein localization to cell periphery | 20/2078 | 69/18723 | 3.92e-05 | 9.54e-04 | 20 |
| GO:00430014 | Colorectum | CRC | Golgi to plasma membrane protein transport | 14/2078 | 40/18723 | 5.81e-05 | 1.31e-03 | 14 |
| GO:00086541 | Colorectum | CRC | phospholipid biosynthetic process | 49/2078 | 253/18723 | 7.07e-05 | 1.51e-03 | 49 |
| GO:19030784 | Colorectum | CRC | positive regulation of protein localization to plasma membrane | 18/2078 | 62/18723 | 9.19e-05 | 1.87e-03 | 18 |
| GO:00091175 | Colorectum | CRC | nucleotide metabolic process | 81/2078 | 489/18723 | 1.45e-04 | 2.65e-03 | 81 |
| GO:00066503 | Colorectum | CRC | glycerophospholipid metabolic process | 55/2078 | 306/18723 | 2.10e-04 | 3.55e-03 | 55 |
| Page: 1 2 3 4 5 6 7 8 9 10 11 12 13 14 15 16 17 18 19 20 21 22 23 24 25 26 27 28 29 30 31 32 33 34 35 36 37 38 39 40 41 |
| Pathway ID | Tissue | Disease Stage | Description | Gene Ratio | Bg Ratio | pvalue | p.adjust | qvalue | Count |
| hsa00071 | Colorectum | AD | Fatty acid degradation | 20/2092 | 43/8465 | 1.50e-03 | 8.69e-03 | 5.54e-03 | 20 |
| hsa000711 | Colorectum | AD | Fatty acid degradation | 20/2092 | 43/8465 | 1.50e-03 | 8.69e-03 | 5.54e-03 | 20 |
| hsa047144 | Colorectum | MSS | Thermogenesis | 113/1875 | 232/8465 | 1.52e-19 | 4.62e-18 | 2.83e-18 | 113 |
| hsa047145 | Colorectum | MSS | Thermogenesis | 113/1875 | 232/8465 | 1.52e-19 | 4.62e-18 | 2.83e-18 | 113 |
| hsa042166 | Colorectum | CRC | Ferroptosis | 13/1091 | 41/8465 | 1.36e-03 | 1.08e-02 | 7.33e-03 | 13 |
| hsa01212 | Colorectum | CRC | Fatty acid metabolism | 14/1091 | 57/8465 | 1.17e-02 | 4.99e-02 | 3.38e-02 | 14 |
| hsa042167 | Colorectum | CRC | Ferroptosis | 13/1091 | 41/8465 | 1.36e-03 | 1.08e-02 | 7.33e-03 | 13 |
| hsa012121 | Colorectum | CRC | Fatty acid metabolism | 14/1091 | 57/8465 | 1.17e-02 | 4.99e-02 | 3.38e-02 | 14 |
| hsa04714211 | Esophagus | ESCC | Thermogenesis | 163/4205 | 232/8465 | 9.22e-11 | 1.14e-09 | 5.86e-10 | 163 |
| hsa0421629 | Esophagus | ESCC | Ferroptosis | 33/4205 | 41/8465 | 4.58e-05 | 1.99e-04 | 1.02e-04 | 33 |
| hsa012129 | Esophagus | ESCC | Fatty acid metabolism | 41/4205 | 57/8465 | 5.13e-04 | 1.75e-03 | 8.98e-04 | 41 |
| hsa041467 | Esophagus | ESCC | Peroxisome | 55/4205 | 82/8465 | 1.04e-03 | 3.27e-03 | 1.68e-03 | 55 |
| hsa04714310 | Esophagus | ESCC | Thermogenesis | 163/4205 | 232/8465 | 9.22e-11 | 1.14e-09 | 5.86e-10 | 163 |
| hsa0421638 | Esophagus | ESCC | Ferroptosis | 33/4205 | 41/8465 | 4.58e-05 | 1.99e-04 | 1.02e-04 | 33 |
| hsa0121214 | Esophagus | ESCC | Fatty acid metabolism | 41/4205 | 57/8465 | 5.13e-04 | 1.75e-03 | 8.98e-04 | 41 |
| hsa0414612 | Esophagus | ESCC | Peroxisome | 55/4205 | 82/8465 | 1.04e-03 | 3.27e-03 | 1.68e-03 | 55 |
| hsa033206 | Liver | NAFLD | PPAR signaling pathway | 25/1043 | 75/8465 | 1.61e-06 | 6.62e-05 | 5.33e-05 | 25 |
| hsa012126 | Liver | NAFLD | Fatty acid metabolism | 17/1043 | 57/8465 | 3.43e-04 | 5.93e-03 | 4.78e-03 | 17 |
| hsa000718 | Liver | NAFLD | Fatty acid degradation | 13/1043 | 43/8465 | 1.46e-03 | 1.71e-02 | 1.38e-02 | 13 |
| hsa042168 | Liver | NAFLD | Ferroptosis | 12/1043 | 41/8465 | 2.98e-03 | 2.96e-02 | 2.39e-02 | 12 |
| Page: 1 2 3 4 |
Top |
Cell-cell communication analysis |
| Identification of potential cell-cell interactions between two cell types and their ligand-receptor pairs for different disease states |
| Ligand | Receptor | LRpair | Pathway | Tissue | Disease Stage |
| Page: 1 |
Top |
Single-cell gene regulatory network inference analysis |
| Find out the significant the regulons (TFs) and the target genes of each regulon across cell types for different disease states |
| TF | Cell Type | Tissue | Disease Stage | Target Gene | RSS | Regulon Activity |
| ∗The dot plots of a searched regulon are shown for all cell subpopulations in each disease state of each tissue based on the regulon specific score inferred using pySCENIC and by calculating the average expression. |
| Page: 1 |
Top |
Somatic mutation of malignant transformation related genes |
| Annotation of somatic variants for genes involved in malignant transformation |
| Hugo Symbol | Variant Class | Variant Classification | dbSNP RS | HGVSc | HGVSp | HGVSp Short | SWISSPROT | BIOTYPE | SIFT | PolyPhen | Tumor Sample Barcode | Tissue | Histology | Sex | Age | Stage | Therapy Types | Drugs | Outcome |
| ACSL3 | SNV | Missense_Mutation | c.43N>G | p.Lys15Glu | p.K15E | O95573 | protein_coding | deleterious_low_confidence(0.04) | benign(0.114) | TCGA-AN-A0AK-01 | Breast | breast invasive carcinoma | Female | >=65 | I/II | Unknown | Unknown | SD | |
| ACSL3 | SNV | Missense_Mutation | novel | c.2009G>A | p.Ser670Asn | p.S670N | O95573 | protein_coding | tolerated(0.18) | benign(0) | TCGA-BH-A0BL-01 | Breast | breast invasive carcinoma | Female | <65 | I/II | Chemotherapy | adriamycin | CR |
| ACSL3 | insertion | Frame_Shift_Ins | novel | c.1847_1847+1insAACAAATGGAAGATGTTGGGTTTTAGAGTTTAATTTTTTTCTCA | p.Ser616ArgfsTer32 | p.S616Rfs*32 | O95573 | protein_coding | TCGA-BH-A0B8-01 | Breast | breast invasive carcinoma | Female | <65 | I/II | Hormone Therapy | arimidex | SD | ||
| ACSL3 | SNV | Missense_Mutation | c.1082N>G | p.Ser361Cys | p.S361C | O95573 | protein_coding | deleterious(0) | probably_damaging(0.998) | TCGA-LP-A4AV-01 | Cervix | cervical & endocervical cancer | Female | <65 | I/II | Unknown | Unknown | SD | |
| ACSL3 | SNV | Missense_Mutation | rs145813997 | c.1216C>T | p.Arg406Cys | p.R406C | O95573 | protein_coding | deleterious(0) | probably_damaging(0.953) | TCGA-AA-3815-01 | Colorectum | colon adenocarcinoma | Female | >=65 | I/II | Unknown | Unknown | SD |
| ACSL3 | SNV | Missense_Mutation | rs748604442 | c.689G>A | p.Arg230His | p.R230H | O95573 | protein_coding | tolerated(0.08) | benign(0.013) | TCGA-AA-3845-01 | Colorectum | colon adenocarcinoma | Female | >=65 | I/II | Unknown | Unknown | PD |
| ACSL3 | SNV | Missense_Mutation | c.161G>A | p.Arg54Gln | p.R54Q | O95573 | protein_coding | tolerated(0.18) | benign(0.006) | TCGA-AA-3977-01 | Colorectum | colon adenocarcinoma | Male | >=65 | I/II | Unknown | Unknown | SD | |
| ACSL3 | SNV | Missense_Mutation | c.317G>A | p.Gly106Glu | p.G106E | O95573 | protein_coding | deleterious(0) | probably_damaging(0.991) | TCGA-AA-3984-01 | Colorectum | colon adenocarcinoma | Female | <65 | I/II | Unknown | Unknown | SD | |
| ACSL3 | SNV | Missense_Mutation | c.364N>C | p.Lys122Gln | p.K122Q | O95573 | protein_coding | deleterious(0) | probably_damaging(0.973) | TCGA-AA-A010-01 | Colorectum | colon adenocarcinoma | Female | <65 | I/II | Chemotherapy | folinic | CR | |
| ACSL3 | SNV | Missense_Mutation | c.1087N>C | p.Lys363Gln | p.K363Q | O95573 | protein_coding | deleterious(0) | possibly_damaging(0.817) | TCGA-AA-A010-01 | Colorectum | colon adenocarcinoma | Female | <65 | I/II | Chemotherapy | folinic | CR |
| Page: 1 2 3 4 5 6 7 |
Top |
Related drugs of malignant transformation related genes |
| Identification of chemicals and drugs interact with genes involved in malignant transfromation |
| (DGIdb 4.0) |
| Entrez ID | Symbol | Category | Interaction Types | Drug Claim Name | Drug Name | PMIDs |
| Page: 1 |

Copyright 2023-Present -The University of Texas Health Science Center at Houston |