
|
|||||
|
 | |
| |
| |
| |
| |
| |
|
Gene: DDX3X |
Gene summary for DDX3X |
| Gene information | Species | Human | Gene symbol | DDX3X | Gene ID | 1654 |
| Gene name | DEAD-box helicase 3 X-linked | |
| Gene Alias | CAP-Rf | |
| Cytomap | Xp11.4 | |
| Gene Type | protein-coding | GO ID | GO:0000003 | UniProtAcc | O00571 |
Top |
Malignant transformation analysis |
| Identification of the aberrant gene expression in precancerous and cancerous lesions by comparing the gene expression of stem-like cells in diseased tissues with normal stem cells |
| Entrez ID | Symbol | Replicates | Species | Organ | Tissue | Adj P-value | Log2FC | Malignancy |
| 1654 | DDX3X | GSM4909282 | Human | Breast | IDC | 1.60e-08 | -4.66e-01 | -0.0288 |
| 1654 | DDX3X | GSM4909285 | Human | Breast | IDC | 2.26e-03 | -3.03e-01 | 0.21 |
| 1654 | DDX3X | GSM4909286 | Human | Breast | IDC | 1.38e-07 | -2.68e-01 | 0.1081 |
| 1654 | DDX3X | GSM4909293 | Human | Breast | IDC | 7.56e-05 | 2.20e-01 | 0.1581 |
| 1654 | DDX3X | GSM4909294 | Human | Breast | IDC | 3.00e-05 | -2.81e-01 | 0.2022 |
| 1654 | DDX3X | GSM4909296 | Human | Breast | IDC | 1.49e-15 | -4.01e-01 | 0.1524 |
| 1654 | DDX3X | GSM4909297 | Human | Breast | IDC | 1.39e-14 | -1.92e-01 | 0.1517 |
| 1654 | DDX3X | GSM4909301 | Human | Breast | IDC | 1.01e-02 | -3.16e-01 | 0.1577 |
| 1654 | DDX3X | GSM4909311 | Human | Breast | IDC | 5.10e-37 | -5.06e-01 | 0.1534 |
| 1654 | DDX3X | GSM4909312 | Human | Breast | IDC | 9.85e-13 | -2.67e-01 | 0.1552 |
| 1654 | DDX3X | GSM4909313 | Human | Breast | IDC | 1.09e-04 | 1.49e-01 | 0.0391 |
| 1654 | DDX3X | GSM4909317 | Human | Breast | IDC | 4.79e-07 | 3.61e-01 | 0.1355 |
| 1654 | DDX3X | GSM4909319 | Human | Breast | IDC | 8.78e-39 | -6.57e-01 | 0.1563 |
| 1654 | DDX3X | GSM4909320 | Human | Breast | IDC | 1.57e-05 | -5.09e-01 | 0.1575 |
| 1654 | DDX3X | GSM4909321 | Human | Breast | IDC | 1.04e-15 | -2.05e-01 | 0.1559 |
| 1654 | DDX3X | brca1 | Human | Breast | Precancer | 6.61e-04 | -3.33e-01 | -0.0338 |
| 1654 | DDX3X | brca10 | Human | Breast | Precancer | 4.37e-07 | -4.79e-01 | -0.0029 |
| 1654 | DDX3X | NCCBC14 | Human | Breast | DCIS | 3.00e-06 | -1.85e-01 | 0.2021 |
| 1654 | DDX3X | NCCBC5 | Human | Breast | DCIS | 5.30e-12 | -3.22e-01 | 0.2046 |
| 1654 | DDX3X | P1 | Human | Breast | IDC | 1.12e-23 | 2.15e-02 | 0.1527 |
| Page: 1 2 3 4 5 6 7 8 9 10 |
| Tissue | Expression Dynamics | Abbreviation |
| Breast |  | IDC: Invasive ductal carcinoma |
| DCIS: Ductal carcinoma in situ | ||
| Precancer(BRCA1-mut): Precancerous lesion from BRCA1 mutation carriers | ||
| Endometrium | 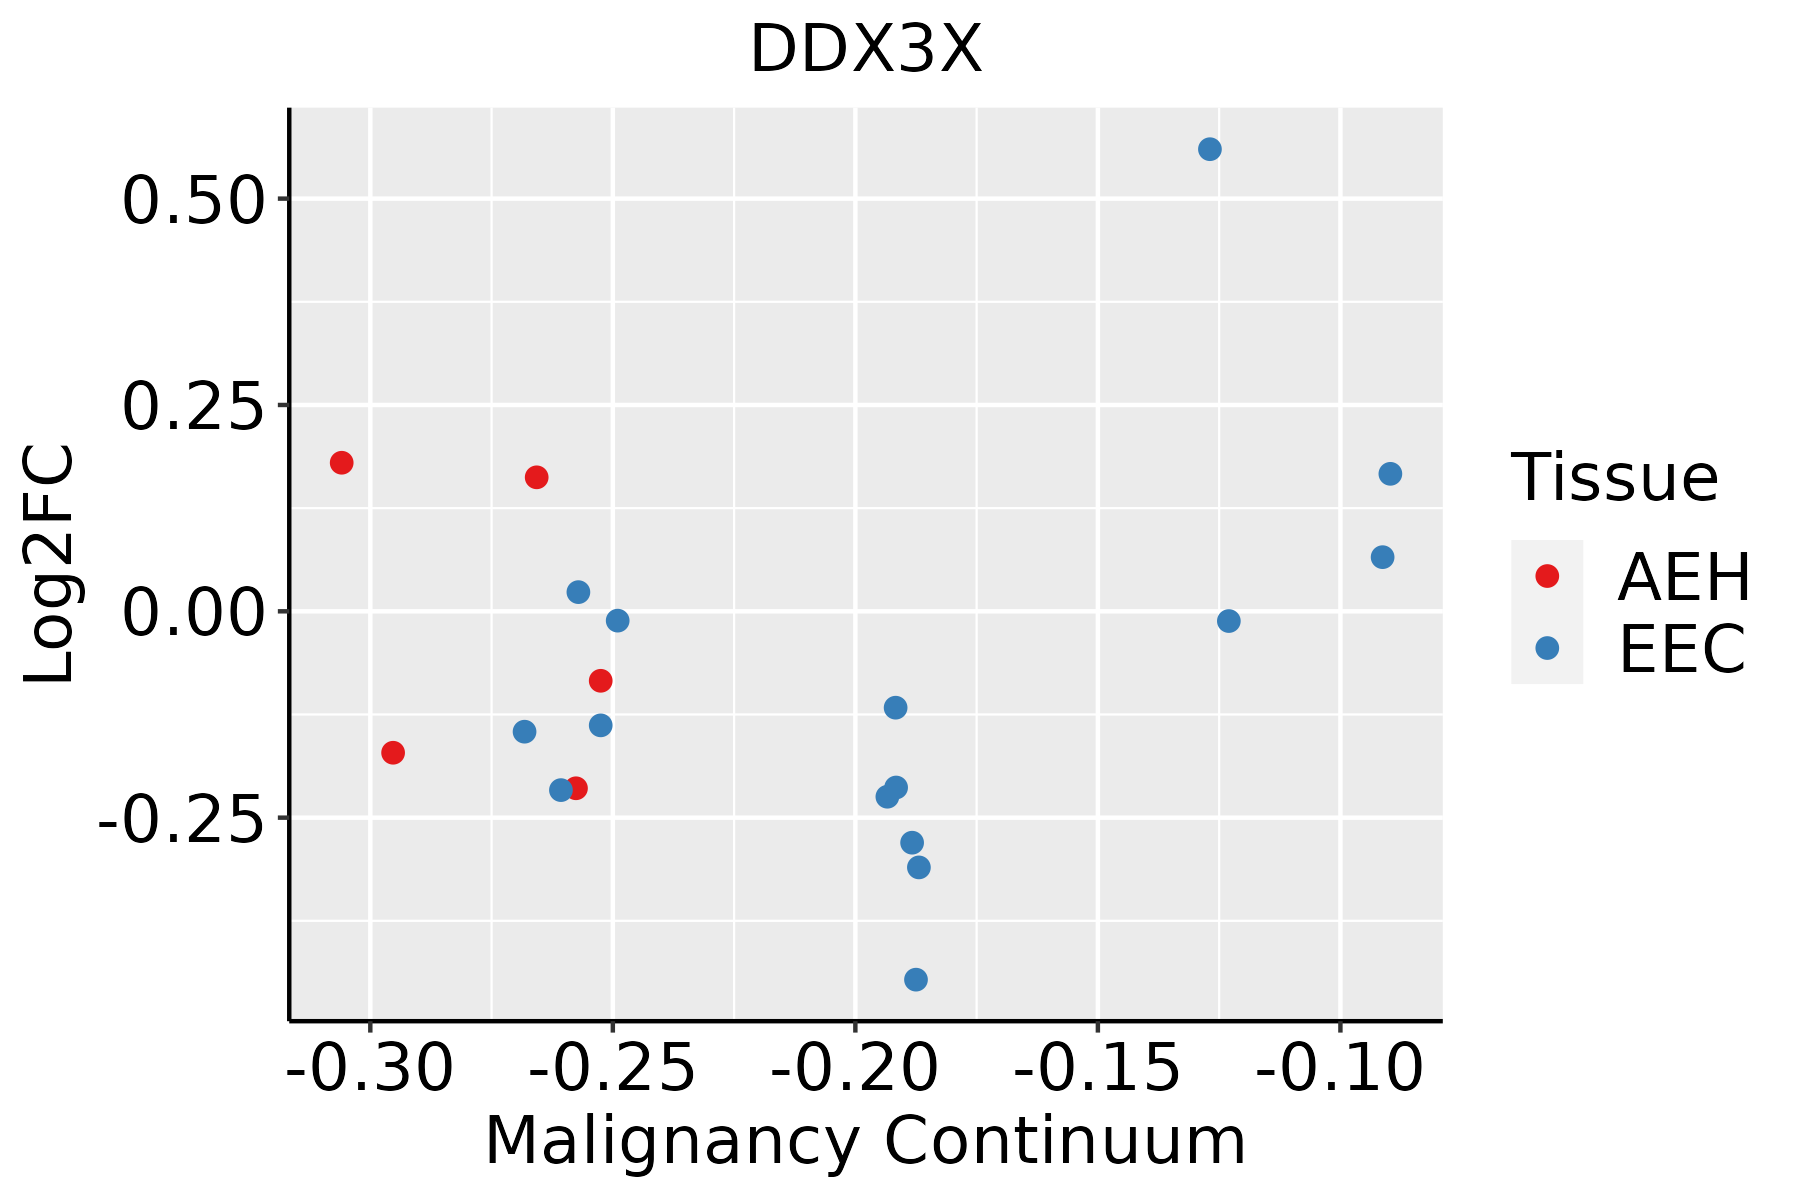 | AEH: Atypical endometrial hyperplasia |
| EEC: Endometrioid Cancer | ||
| Esophagus | 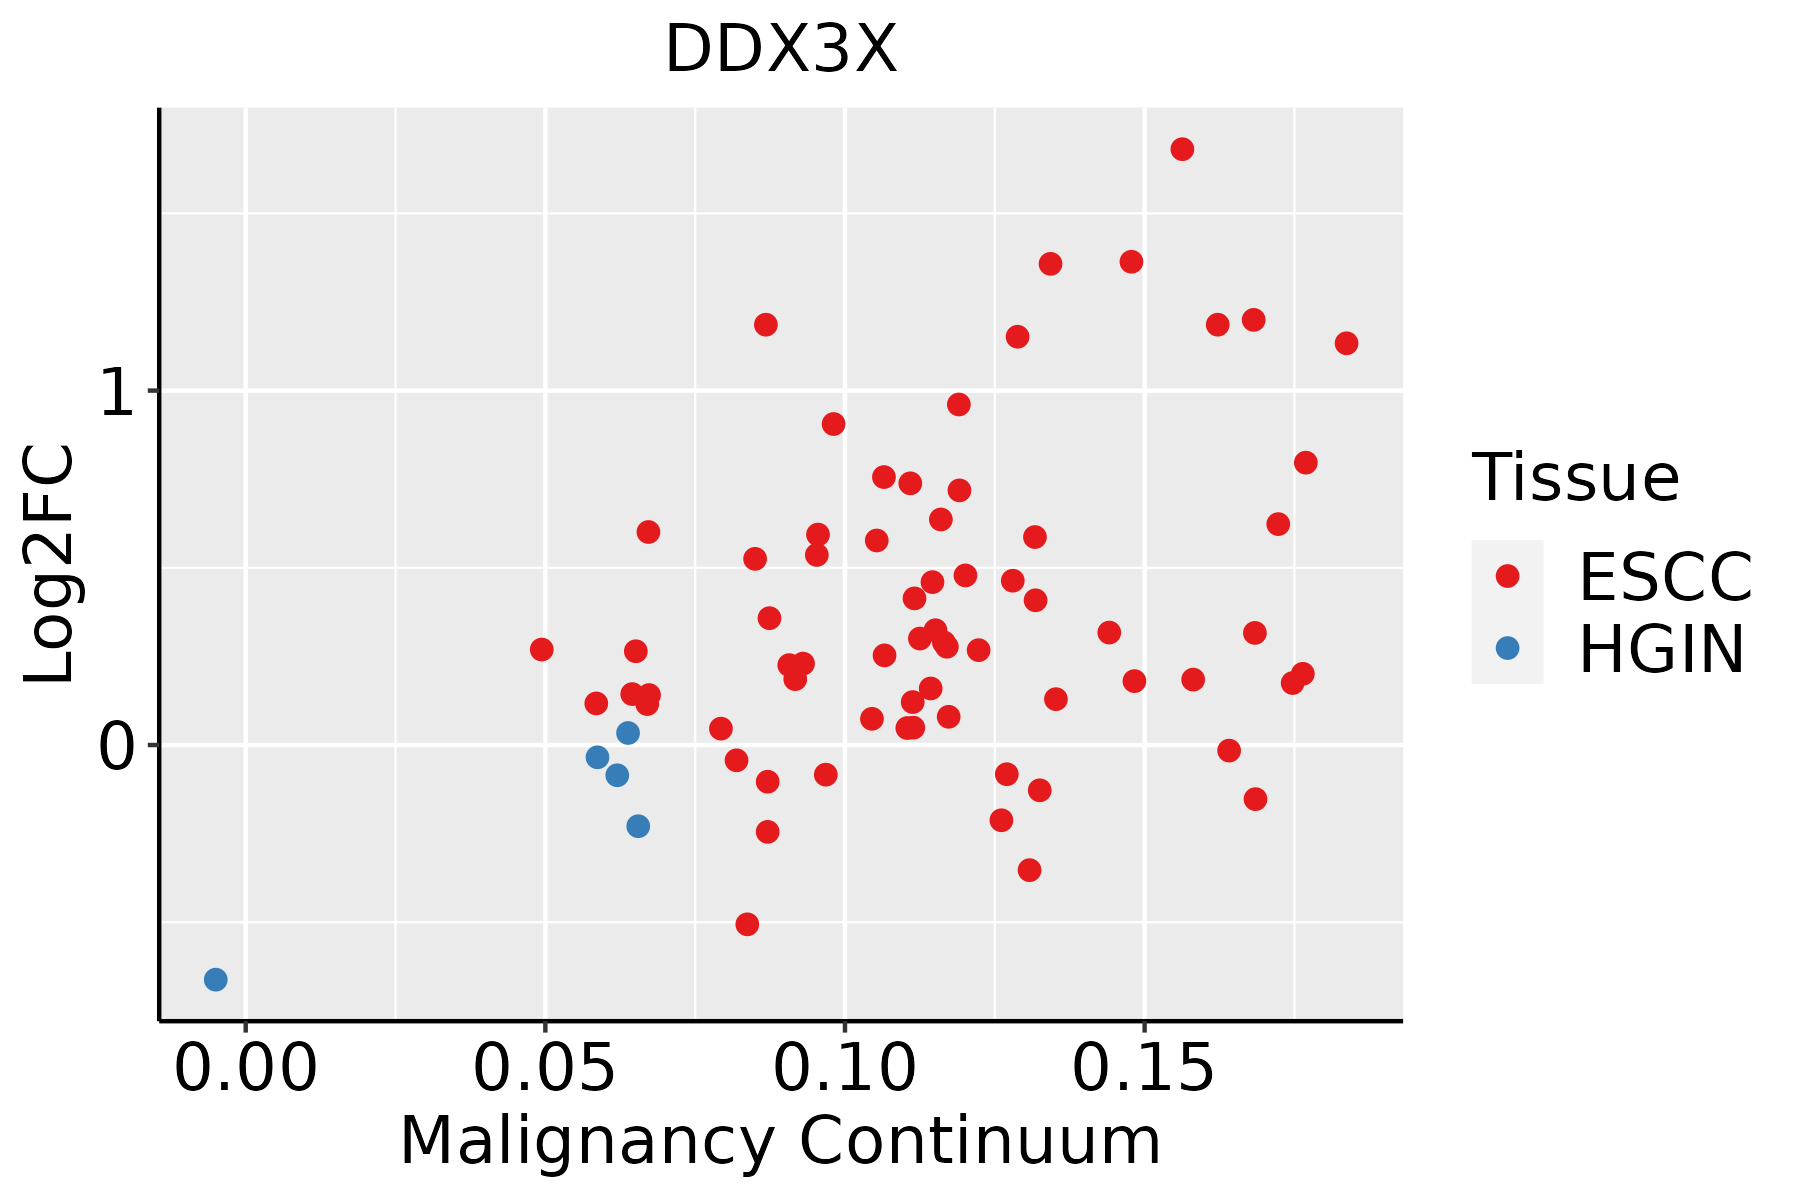 | ESCC: Esophageal squamous cell carcinoma |
| HGIN: High-grade intraepithelial neoplasias | ||
| LGIN: Low-grade intraepithelial neoplasias | ||
| Liver | 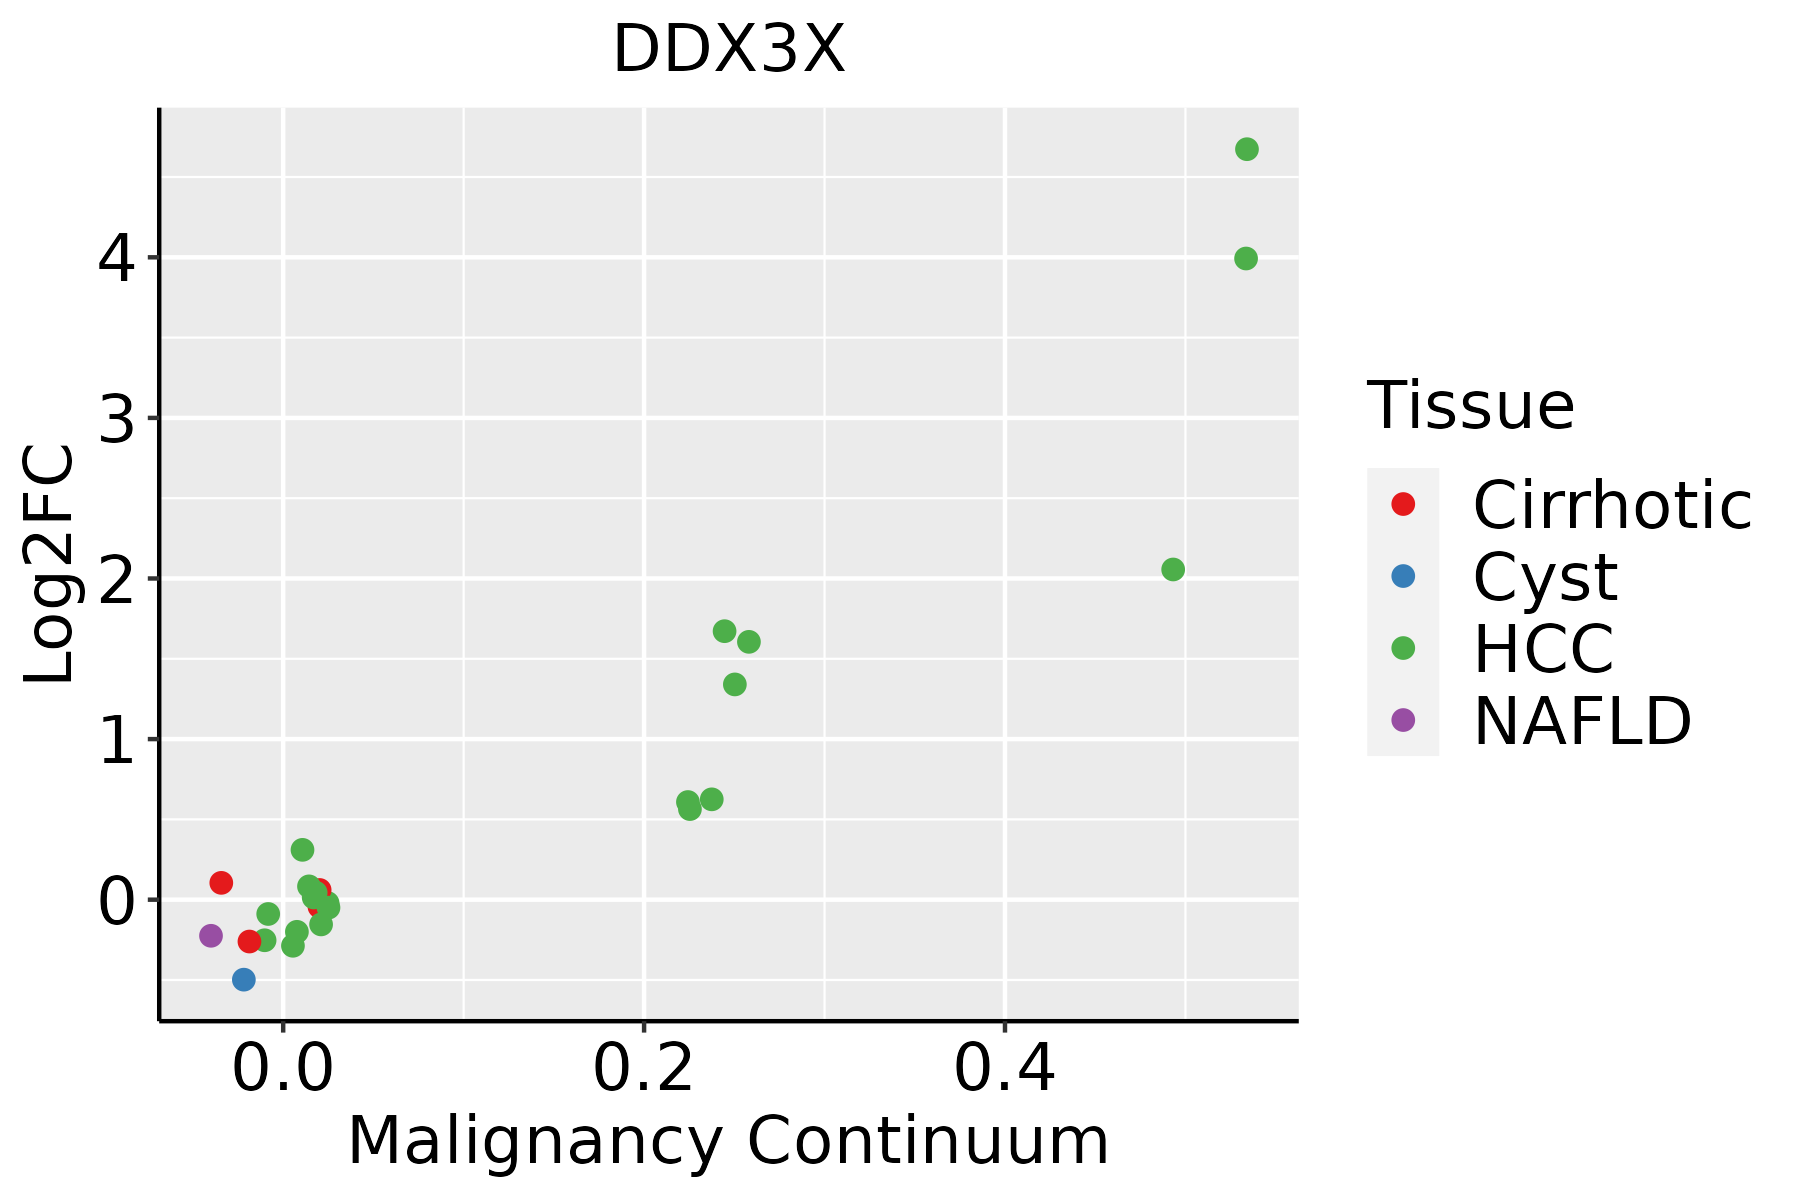 | HCC: Hepatocellular carcinoma |
| NAFLD: Non-alcoholic fatty liver disease | ||
| Oral Cavity | 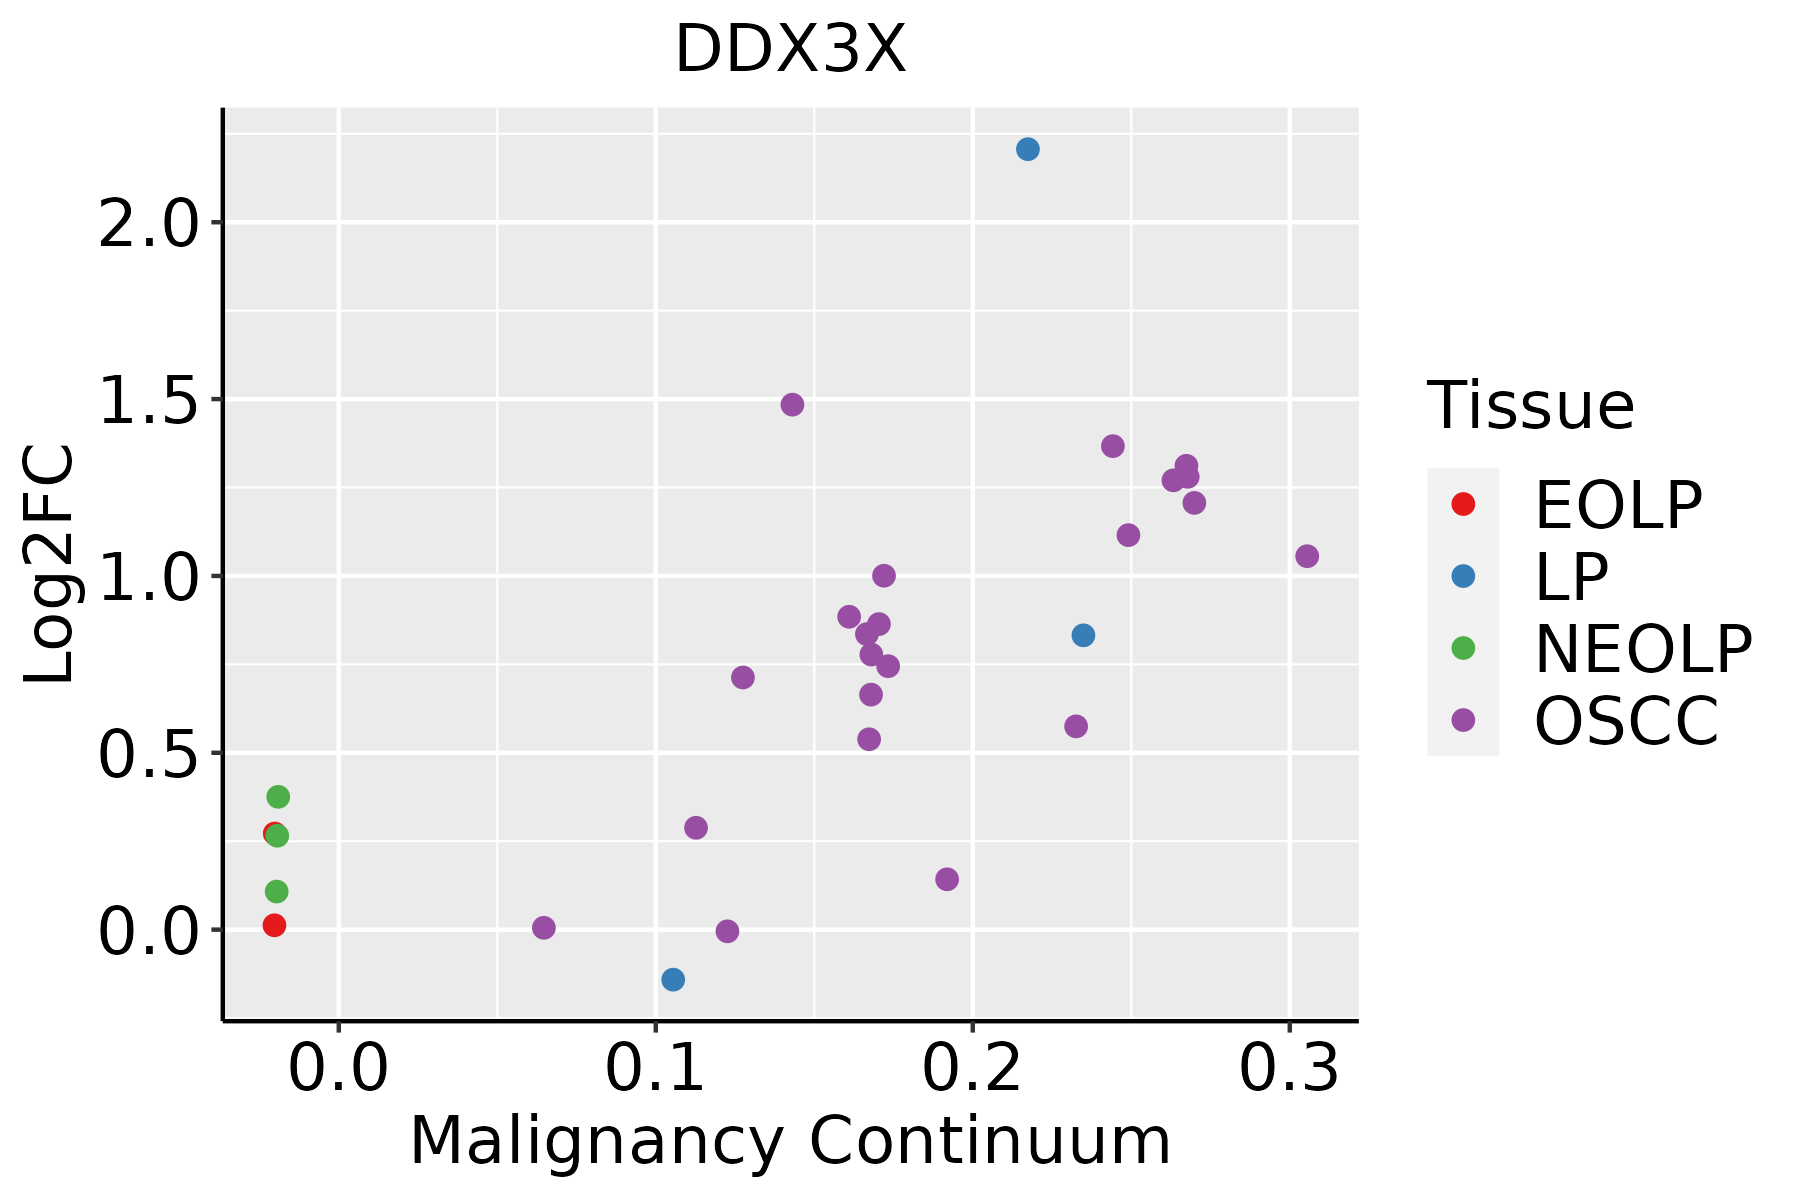 | EOLP: Erosive Oral lichen planus |
| LP: leukoplakia | ||
| NEOLP: Non-erosive oral lichen planus | ||
| OSCC: Oral squamous cell carcinoma | ||
| Prostate | 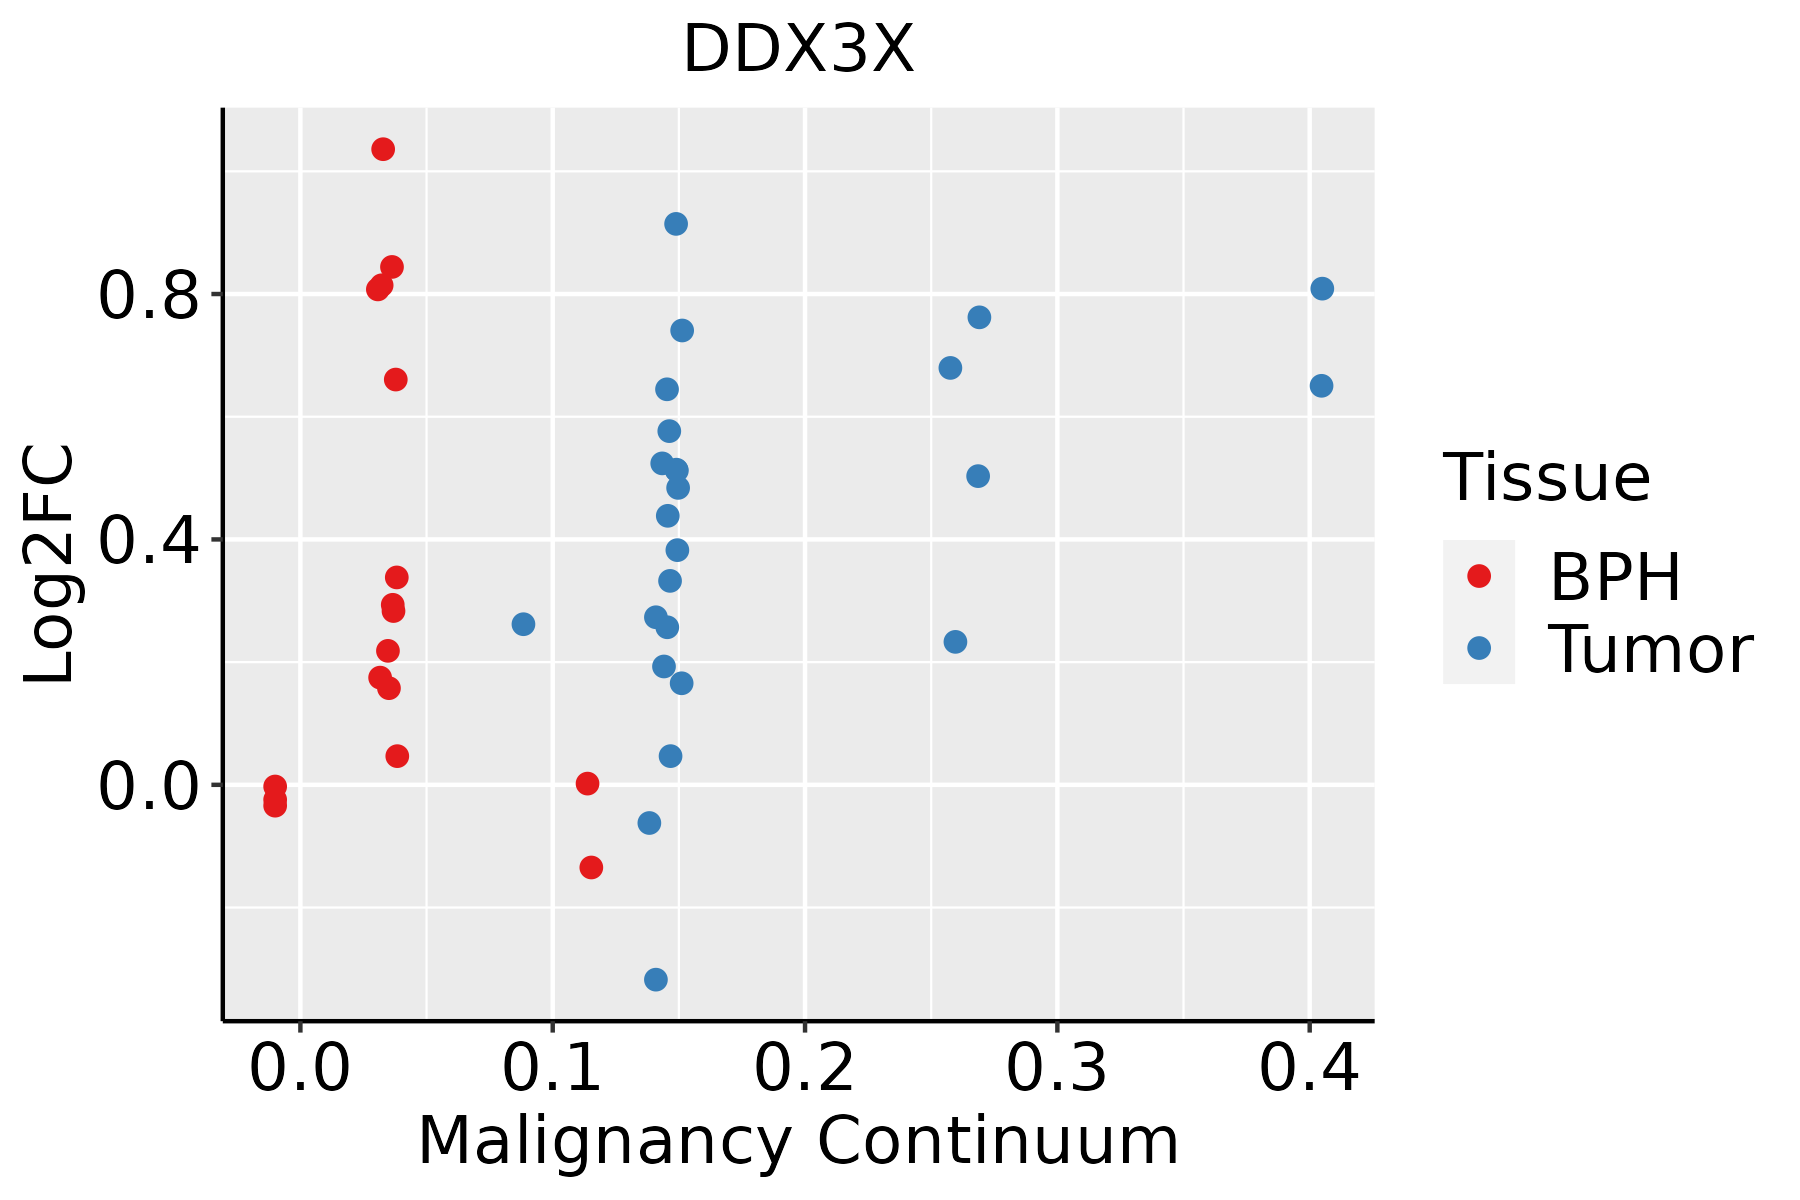 | BPH: Benign Prostatic Hyperplasia |
| Skin | 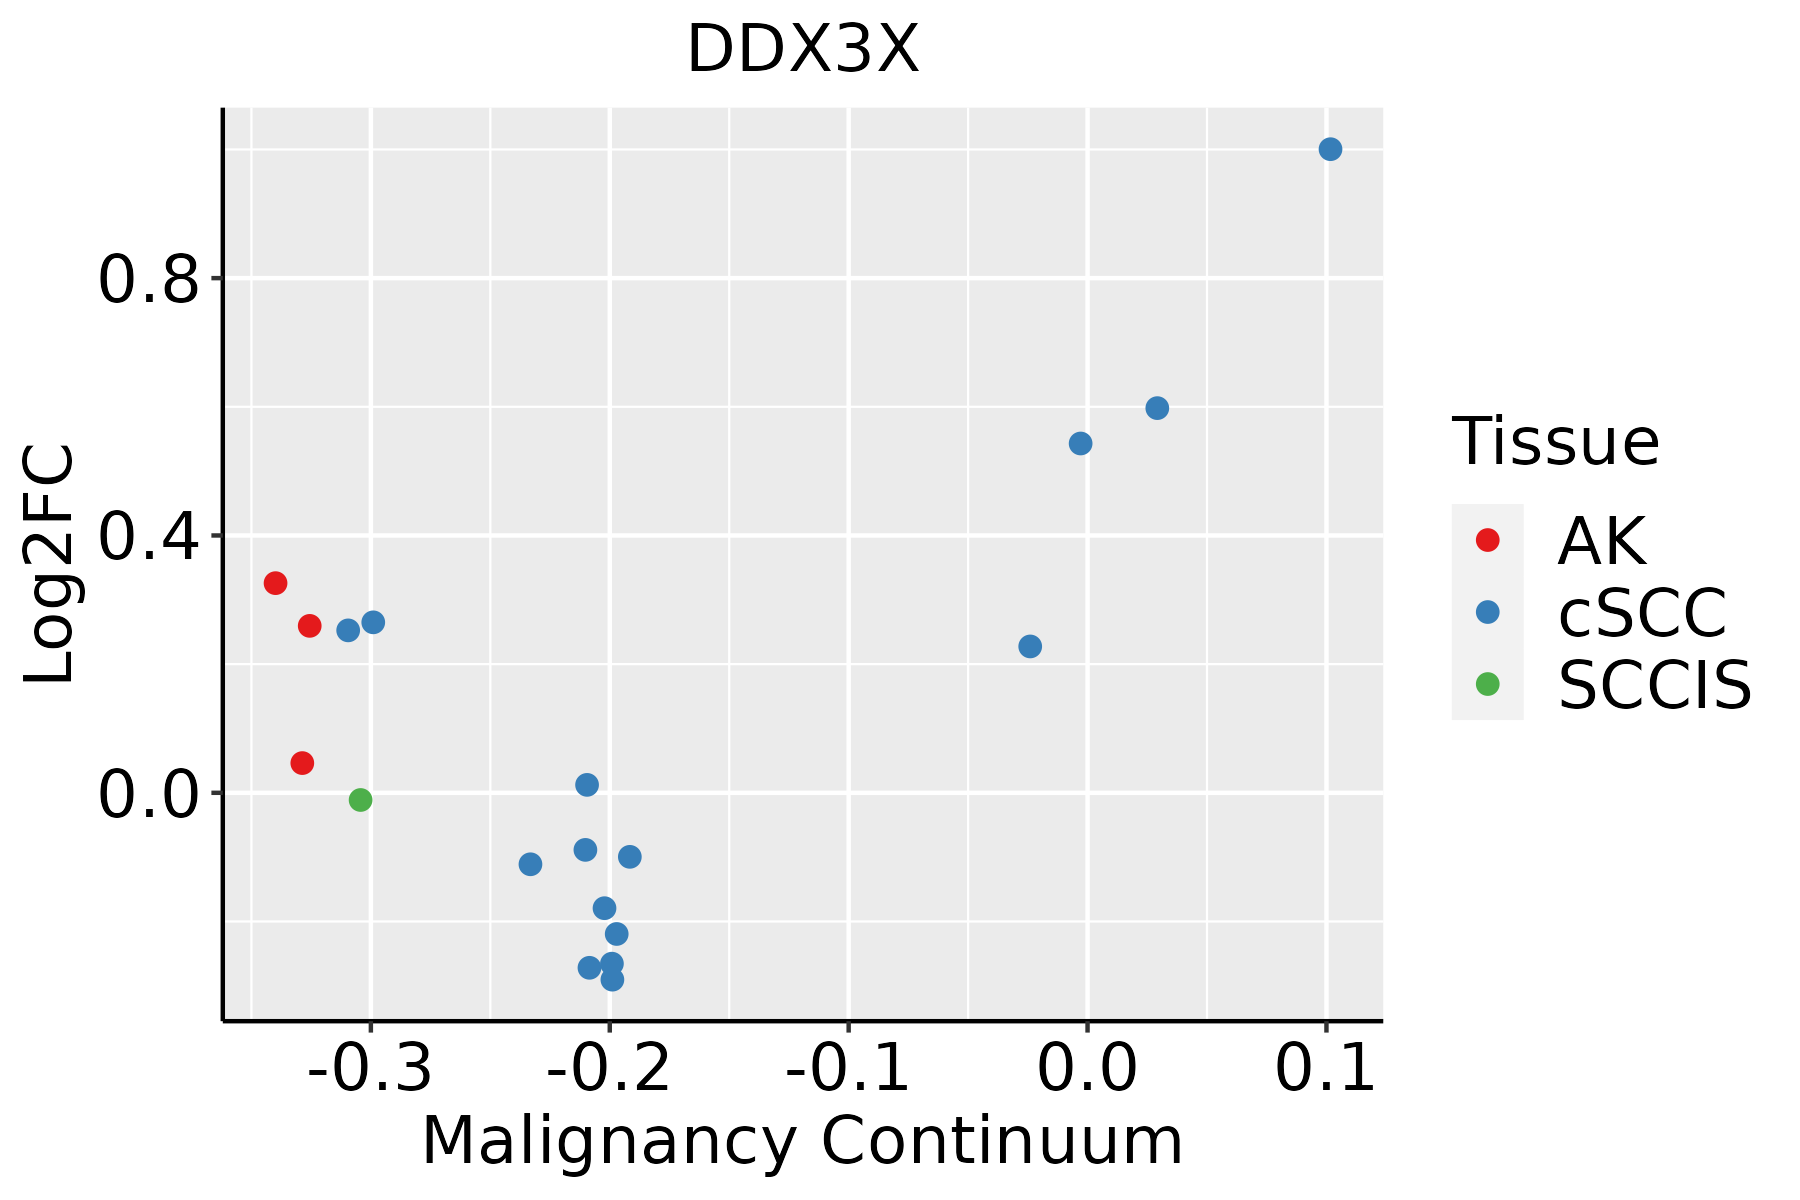 | AK: Actinic keratosis |
| cSCC: Cutaneous squamous cell carcinoma | ||
| SCCIS:squamous cell carcinoma in situ | ||
| Thyroid |  | ATC: Anaplastic thyroid cancer |
| HT: Hashimoto's thyroiditis | ||
| PTC: Papillary thyroid cancer |
| ∗log2FC in expression of this searched gene in stem-like cells from each diseased tissue sample relative to stem-like cells in normal samples in each tissue plotted against the malignancy continuum. Samples are colored based on if they are from different disease stage. |
Top |
Malignant transformation related pathway analysis |
| Find out the enriched GO biological processes and KEGG pathways involved in transition from healthy to precancer to cancer |
| Tissue | Disease Stage | Enriched GO biological Processes |
| Colorectum | AD |  |
| Colorectum | SER |  |
| Colorectum | MSS |  |
| Colorectum | MSI-H |  |
| Colorectum | FAP |  |
| ∗Top 15 enriched GO BP terms are showed in the bar plot of each disease state in each tissue. Each row represents a significant GO biological process which is colored according to the -log10(p.adjust). |
| Page: 1 2 3 4 5 6 7 8 9 |
| GO ID | Tissue | Disease Stage | Description | Gene Ratio | Bg Ratio | pvalue | p.adjust | Count |
| GO:0097193113 | Thyroid | PTC | intrinsic apoptotic signaling pathway | 164/5968 | 288/18723 | 9.17e-19 | 1.09e-16 | 164 |
| GO:0006413112 | Thyroid | PTC | translational initiation | 84/5968 | 118/18723 | 1.89e-18 | 2.09e-16 | 84 |
| GO:0031396113 | Thyroid | PTC | regulation of protein ubiquitination | 128/5968 | 210/18723 | 3.06e-18 | 3.27e-16 | 128 |
| GO:0045862113 | Thyroid | PTC | positive regulation of proteolysis | 198/5968 | 372/18723 | 6.68e-18 | 6.91e-16 | 198 |
| GO:0006417113 | Thyroid | PTC | regulation of translation | 236/5968 | 468/18723 | 2.70e-17 | 2.52e-15 | 236 |
| GO:0062197113 | Thyroid | PTC | cellular response to chemical stress | 180/5968 | 337/18723 | 1.36e-16 | 1.16e-14 | 180 |
| GO:00346608 | Thyroid | PTC | ncRNA metabolic process | 239/5968 | 485/18723 | 5.54e-16 | 4.26e-14 | 239 |
| GO:0043254113 | Thyroid | PTC | regulation of protein-containing complex assembly | 215/5968 | 428/18723 | 1.23e-15 | 9.09e-14 | 215 |
| GO:0019058113 | Thyroid | PTC | viral life cycle | 167/5968 | 317/18723 | 8.87e-15 | 5.89e-13 | 167 |
| GO:00064737 | Thyroid | PTC | protein acetylation | 116/5968 | 201/18723 | 3.05e-14 | 1.92e-12 | 116 |
| GO:0016055110 | Thyroid | PTC | Wnt signaling pathway | 217/5968 | 444/18723 | 3.71e-14 | 2.30e-12 | 217 |
| GO:00435437 | Thyroid | PTC | protein acylation | 134/5968 | 243/18723 | 4.22e-14 | 2.58e-12 | 134 |
| GO:2001242113 | Thyroid | PTC | regulation of intrinsic apoptotic signaling pathway | 99/5968 | 164/18723 | 4.74e-14 | 2.79e-12 | 99 |
| GO:0034250113 | Thyroid | PTC | positive regulation of cellular amide metabolic process | 98/5968 | 162/18723 | 5.26e-14 | 3.04e-12 | 98 |
| GO:0198738110 | Thyroid | PTC | cell-cell signaling by wnt | 217/5968 | 446/18723 | 6.68e-14 | 3.73e-12 | 217 |
| GO:2001234113 | Thyroid | PTC | negative regulation of apoptotic signaling pathway | 124/5968 | 224/18723 | 2.57e-13 | 1.32e-11 | 124 |
| GO:0045727113 | Thyroid | PTC | positive regulation of translation | 84/5968 | 136/18723 | 6.52e-13 | 3.08e-11 | 84 |
| GO:000020920 | Thyroid | PTC | protein polyubiquitination | 128/5968 | 236/18723 | 7.81e-13 | 3.65e-11 | 128 |
| GO:0016049112 | Thyroid | PTC | cell growth | 225/5968 | 482/18723 | 4.75e-12 | 2.07e-10 | 225 |
| GO:0006446110 | Thyroid | PTC | regulation of translational initiation | 55/5968 | 79/18723 | 6.21e-12 | 2.63e-10 | 55 |
| Page: 1 2 3 4 5 6 7 8 9 10 11 12 13 14 15 16 17 18 19 20 21 22 23 24 25 26 27 28 29 30 31 32 33 34 35 36 37 38 39 40 41 42 43 44 45 46 47 48 49 50 51 52 53 54 55 56 57 58 59 60 61 62 63 64 65 66 67 68 69 70 71 72 73 74 75 76 77 78 79 80 81 82 83 84 85 86 87 88 89 90 91 92 93 94 95 96 97 98 99 100 101 102 |
| Pathway ID | Tissue | Disease Stage | Description | Gene Ratio | Bg Ratio | pvalue | p.adjust | qvalue | Count |
| hsa052036 | Breast | Precancer | Viral carcinogenesis | 27/684 | 204/8465 | 7.19e-03 | 4.06e-02 | 3.11e-02 | 27 |
| hsa0520312 | Breast | Precancer | Viral carcinogenesis | 27/684 | 204/8465 | 7.19e-03 | 4.06e-02 | 3.11e-02 | 27 |
| hsa0520322 | Breast | IDC | Viral carcinogenesis | 34/867 | 204/8465 | 2.82e-03 | 1.86e-02 | 1.39e-02 | 34 |
| hsa0520332 | Breast | IDC | Viral carcinogenesis | 34/867 | 204/8465 | 2.82e-03 | 1.86e-02 | 1.39e-02 | 34 |
| hsa0520341 | Breast | DCIS | Viral carcinogenesis | 34/846 | 204/8465 | 1.88e-03 | 1.27e-02 | 9.33e-03 | 34 |
| hsa052035 | Breast | DCIS | Viral carcinogenesis | 34/846 | 204/8465 | 1.88e-03 | 1.27e-02 | 9.33e-03 | 34 |
| hsa052039 | Esophagus | HGIN | Viral carcinogenesis | 53/1383 | 204/8465 | 2.58e-04 | 2.71e-03 | 2.15e-03 | 53 |
| hsa0520315 | Esophagus | HGIN | Viral carcinogenesis | 53/1383 | 204/8465 | 2.58e-04 | 2.71e-03 | 2.15e-03 | 53 |
| hsa0520325 | Esophagus | ESCC | Viral carcinogenesis | 137/4205 | 204/8465 | 2.47e-07 | 1.88e-06 | 9.62e-07 | 137 |
| hsa051619 | Esophagus | ESCC | Hepatitis B | 108/4205 | 162/8465 | 7.68e-06 | 4.15e-05 | 2.12e-05 | 108 |
| hsa0520335 | Esophagus | ESCC | Viral carcinogenesis | 137/4205 | 204/8465 | 2.47e-07 | 1.88e-06 | 9.62e-07 | 137 |
| hsa0516114 | Esophagus | ESCC | Hepatitis B | 108/4205 | 162/8465 | 7.68e-06 | 4.15e-05 | 2.12e-05 | 108 |
| hsa05203 | Liver | Cirrhotic | Viral carcinogenesis | 76/2530 | 204/8465 | 1.34e-02 | 4.20e-02 | 2.59e-02 | 76 |
| hsa052031 | Liver | Cirrhotic | Viral carcinogenesis | 76/2530 | 204/8465 | 1.34e-02 | 4.20e-02 | 2.59e-02 | 76 |
| hsa052032 | Liver | HCC | Viral carcinogenesis | 117/4020 | 204/8465 | 2.68e-03 | 8.98e-03 | 5.00e-03 | 117 |
| hsa051612 | Liver | HCC | Hepatitis B | 91/4020 | 162/8465 | 1.56e-02 | 3.76e-02 | 2.09e-02 | 91 |
| hsa052033 | Liver | HCC | Viral carcinogenesis | 117/4020 | 204/8465 | 2.68e-03 | 8.98e-03 | 5.00e-03 | 117 |
| hsa0516111 | Liver | HCC | Hepatitis B | 91/4020 | 162/8465 | 1.56e-02 | 3.76e-02 | 2.09e-02 | 91 |
| hsa051618 | Oral cavity | OSCC | Hepatitis B | 103/3704 | 162/8465 | 2.34e-07 | 1.51e-06 | 7.69e-07 | 103 |
| hsa052038 | Oral cavity | OSCC | Viral carcinogenesis | 124/3704 | 204/8465 | 5.57e-07 | 3.28e-06 | 1.67e-06 | 124 |
| Page: 1 2 3 |
Top |
Cell-cell communication analysis |
| Identification of potential cell-cell interactions between two cell types and their ligand-receptor pairs for different disease states |
| Ligand | Receptor | LRpair | Pathway | Tissue | Disease Stage |
| Page: 1 |
Top |
Single-cell gene regulatory network inference analysis |
| Find out the significant the regulons (TFs) and the target genes of each regulon across cell types for different disease states |
| TF | Cell Type | Tissue | Disease Stage | Target Gene | RSS | Regulon Activity |
| ∗The dot plots of a searched regulon are shown for all cell subpopulations in each disease state of each tissue based on the regulon specific score inferred using pySCENIC and by calculating the average expression. |
| Page: 1 |
Top |
Somatic mutation of malignant transformation related genes |
| Annotation of somatic variants for genes involved in malignant transformation |
| Hugo Symbol | Variant Class | Variant Classification | dbSNP RS | HGVSc | HGVSp | HGVSp Short | SWISSPROT | BIOTYPE | SIFT | PolyPhen | Tumor Sample Barcode | Tissue | Histology | Sex | Age | Stage | Therapy Types | Drugs | Outcome |
| DDX3X | SNV | Missense_Mutation | c.1675N>A | p.Leu559Ile | p.L559I | O00571 | protein_coding | tolerated(0.31) | benign(0.182) | TCGA-AC-A23H-01 | Breast | breast invasive carcinoma | Female | >=65 | I/II | Unknown | Unknown | PD | |
| DDX3X | SNV | Missense_Mutation | novel | c.878C>A | p.Ser293Tyr | p.S293Y | O00571 | protein_coding | deleterious(0) | probably_damaging(1) | TCGA-AN-A046-01 | Breast | breast invasive carcinoma | Female | >=65 | I/II | Unknown | Unknown | SD |
| DDX3X | SNV | Missense_Mutation | c.425N>T | p.Pro142Leu | p.P142L | O00571 | protein_coding | tolerated(0.11) | benign(0.179) | TCGA-AO-A03L-01 | Breast | breast invasive carcinoma | Female | <65 | III/IV | Chemotherapy | cyclophosphamide | SD | |
| DDX3X | SNV | Missense_Mutation | novel | c.536N>C | p.Ile179Thr | p.I179T | O00571 | protein_coding | deleterious(0.03) | benign(0.336) | TCGA-B6-A402-01 | Breast | breast invasive carcinoma | Female | <65 | I/II | Chemotherapy | cyclophosphamide | PD |
| DDX3X | SNV | Missense_Mutation | c.203C>T | p.Ala68Val | p.A68V | O00571 | protein_coding | tolerated(0.15) | benign(0) | TCGA-BH-A0HF-01 | Breast | breast invasive carcinoma | Female | >=65 | I/II | Hormone Therapy | arimidex | SD | |
| DDX3X | SNV | Missense_Mutation | c.1907N>A | p.Gly636Glu | p.G636E | O00571 | protein_coding | tolerated(0.09) | probably_damaging(0.994) | TCGA-C8-A26Y-01 | Breast | breast invasive carcinoma | Female | >=65 | I/II | Unknown | Unknown | SD | |
| DDX3X | SNV | Missense_Mutation | c.81N>C | p.Gln27His | p.Q27H | O00571 | protein_coding | deleterious(0.04) | possibly_damaging(0.462) | TCGA-D8-A1JA-01 | Breast | breast invasive carcinoma | Female | <65 | III/IV | Chemotherapy | adriamycin | PD | |
| DDX3X | SNV | Missense_Mutation | novel | c.1321G>C | p.Asp441His | p.D441H | O00571 | protein_coding | deleterious(0.02) | possibly_damaging(0.749) | TCGA-D8-A27V-01 | Breast | breast invasive carcinoma | Female | <65 | I/II | Hormone Therapy | tamoxiphen | SD |
| DDX3X | SNV | Missense_Mutation | novel | c.1873N>A | p.Gly625Arg | p.G625R | O00571 | protein_coding | deleterious(0.04) | benign(0.009) | TCGA-E2-A1B0-01 | Breast | breast invasive carcinoma | Female | <65 | III/IV | Chemotherapy | cytoxan | SD |
| DDX3X | SNV | Missense_Mutation | novel | c.577N>A | p.Gly193Arg | p.G193R | O00571 | protein_coding | tolerated(0.4) | benign(0.272) | TCGA-2W-A8YY-01 | Cervix | cervical & endocervical cancer | Female | <65 | I/II | Chemotherapy | cisplatin | CR |
| Page: 1 2 3 4 5 6 7 8 9 10 11 |
Top |
Related drugs of malignant transformation related genes |
| Identification of chemicals and drugs interact with genes involved in malignant transfromation |
| (DGIdb 4.0) |
| Entrez ID | Symbol | Category | Interaction Types | Drug Claim Name | Drug Name | PMIDs |
| Page: 1 |

Copyright 2023-Present -The University of Texas Health Science Center at Houston |