| Tissue | Expression Dynamics | Abbreviation |
| Cervix |  | CC: Cervix cancer |
| HSIL_HPV: HPV-infected high-grade squamous intraepithelial lesions |
| N_HPV: HPV-infected normal cervix |
| Colorectum (GSE201348) |  | FAP: Familial adenomatous polyposis |
| CRC: Colorectal cancer |
| Colorectum (HTA11) |  | AD: Adenomas |
| SER: Sessile serrated lesions |
| MSI-H: Microsatellite-high colorectal cancer |
| MSS: Microsatellite stable colorectal cancer |
| Esophagus |  | ESCC: Esophageal squamous cell carcinoma |
| HGIN: High-grade intraepithelial neoplasias |
| LGIN: Low-grade intraepithelial neoplasias |
| GC |  | CAG: Chronic atrophic gastritis |
| CAG with IM: Chronic atrophic gastritis with intestinal metaplasia |
| CSG: Chronic superficial gastritis |
| GC: Gastric cancer |
| SIM: Severe intestinal metaplasia |
| WIM: Wild intestinal metaplasia |
| Liver | 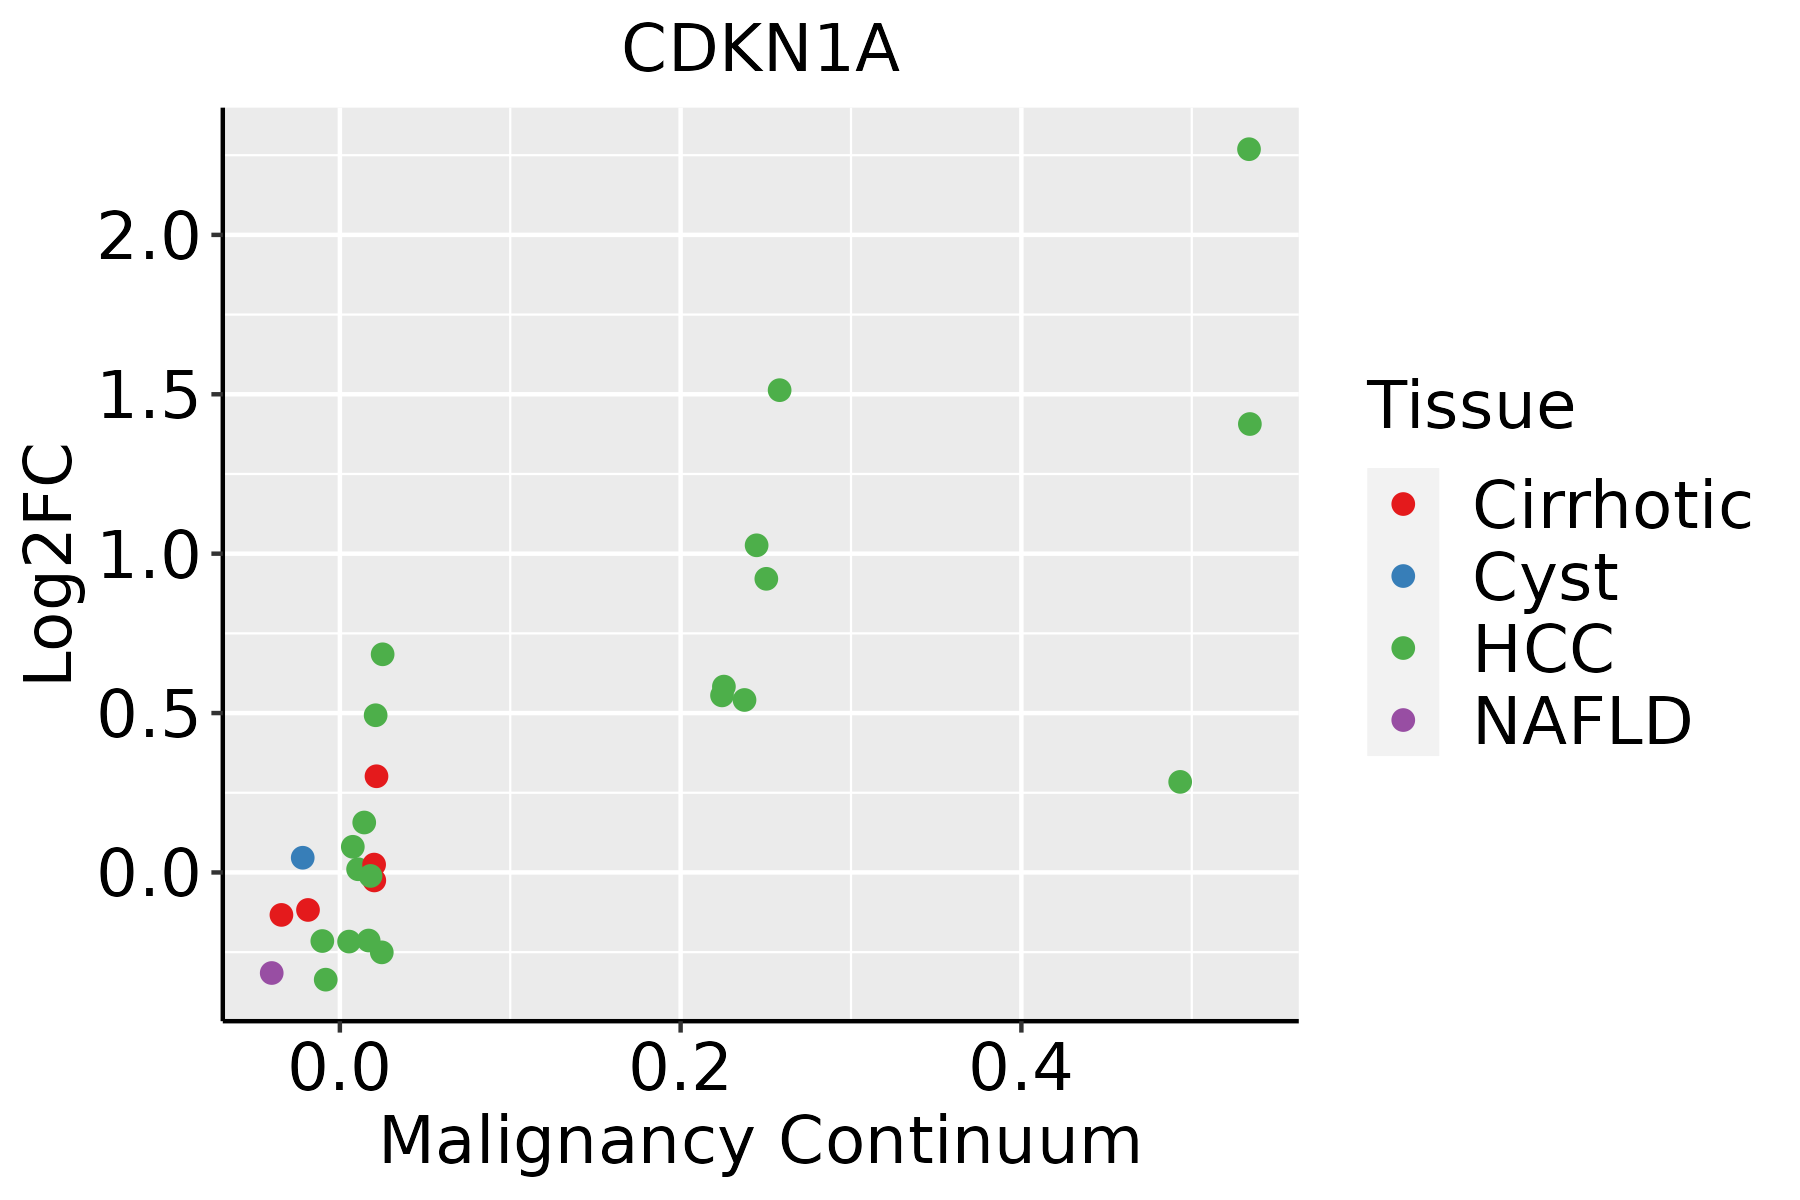 | HCC: Hepatocellular carcinoma |
| NAFLD: Non-alcoholic fatty liver disease |
| Oral Cavity | 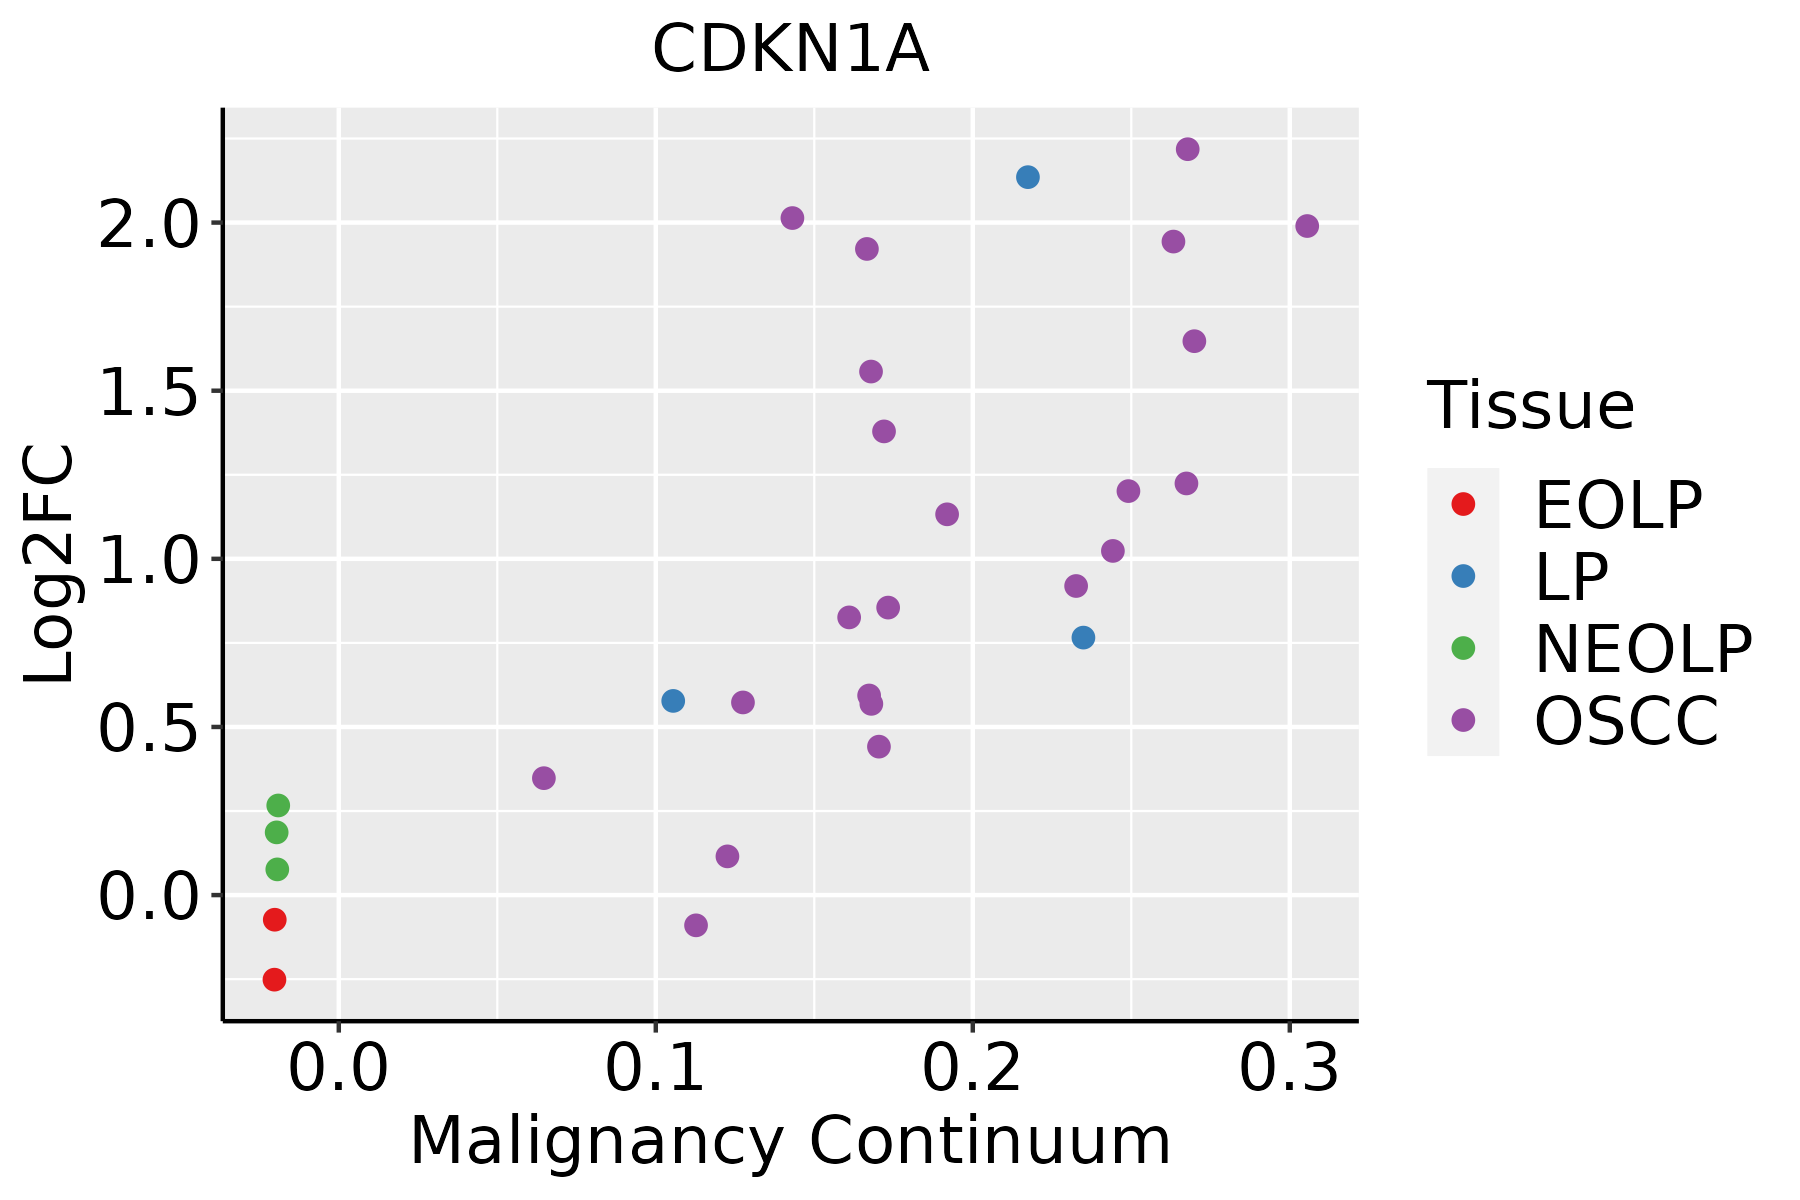 | EOLP: Erosive Oral lichen planus |
| LP: leukoplakia |
| NEOLP: Non-erosive oral lichen planus |
| OSCC: Oral squamous cell carcinoma |
| Prostate |  | BPH: Benign Prostatic Hyperplasia |
| Skin |  | AK: Actinic keratosis |
| cSCC: Cutaneous squamous cell carcinoma |
| SCCIS:squamous cell carcinoma in situ |
| Thyroid | 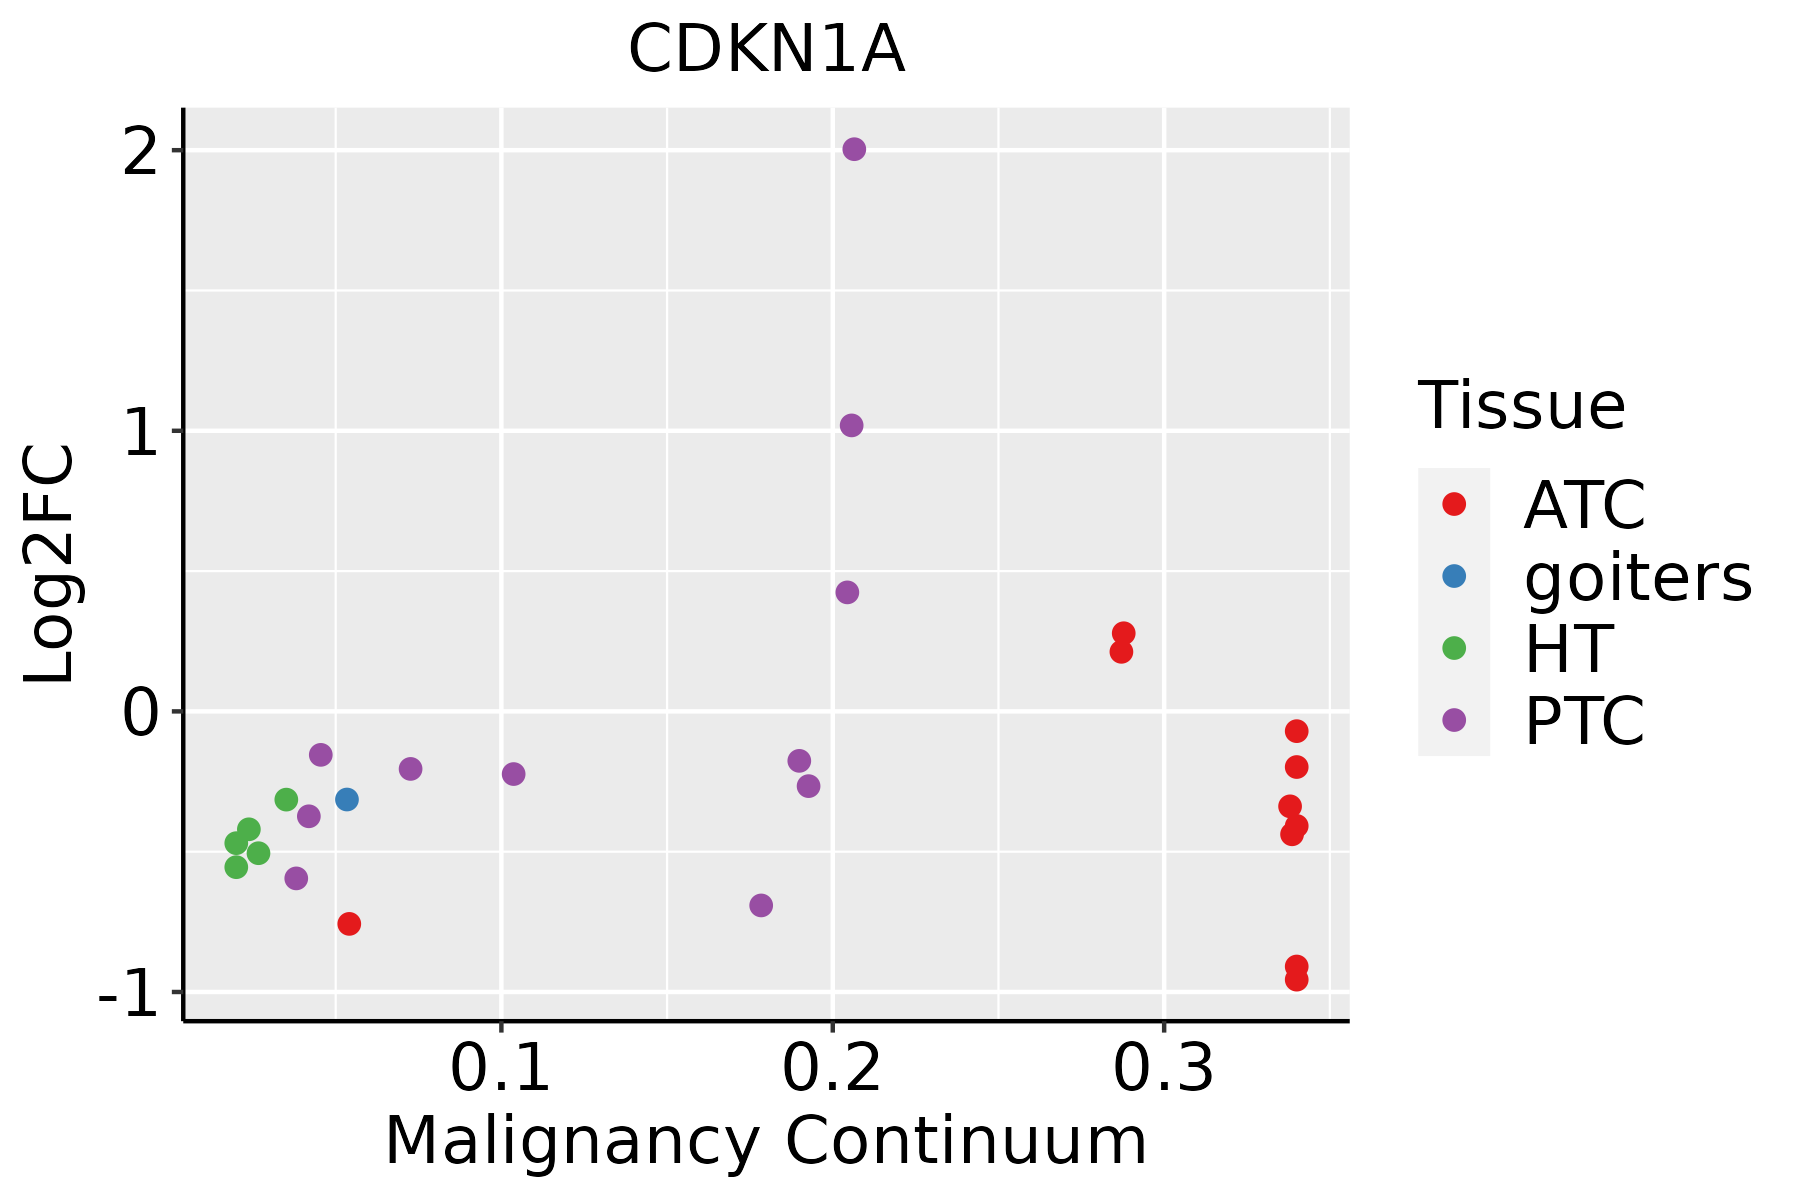 | ATC: Anaplastic thyroid cancer |
| HT: Hashimoto's thyroiditis |
| PTC: Papillary thyroid cancer |
| GO ID | Tissue | Disease Stage | Description | Gene Ratio | Bg Ratio | pvalue | p.adjust | Count |
| GO:000646925 | Thyroid | ATC | negative regulation of protein kinase activity | 114/6293 | 212/18723 | 1.06e-09 | 2.69e-08 | 114 |
| GO:190198715 | Thyroid | ATC | regulation of cell cycle phase transition | 187/6293 | 390/18723 | 2.36e-09 | 5.61e-08 | 187 |
| GO:000756829 | Thyroid | ATC | aging | 166/6293 | 339/18723 | 2.79e-09 | 6.60e-08 | 166 |
| GO:190165427 | Thyroid | ATC | response to ketone | 105/6293 | 194/18723 | 2.96e-09 | 6.96e-08 | 105 |
| GO:004586026 | Thyroid | ATC | positive regulation of protein kinase activity | 185/6293 | 386/18723 | 3.00e-09 | 7.02e-08 | 185 |
| GO:001703822 | Thyroid | ATC | protein import | 110/6293 | 206/18723 | 3.49e-09 | 8.09e-08 | 110 |
| GO:007147825 | Thyroid | ATC | cellular response to radiation | 101/6293 | 186/18723 | 4.67e-09 | 1.04e-07 | 101 |
| GO:000941115 | Thyroid | ATC | response to UV | 84/6293 | 149/18723 | 8.97e-09 | 1.90e-07 | 84 |
| GO:003367325 | Thyroid | ATC | negative regulation of kinase activity | 122/6293 | 237/18723 | 9.19e-09 | 1.94e-07 | 122 |
| GO:003166927 | Thyroid | ATC | cellular response to nutrient levels | 112/6293 | 215/18723 | 1.57e-08 | 3.20e-07 | 112 |
| GO:003166827 | Thyroid | ATC | cellular response to extracellular stimulus | 125/6293 | 246/18723 | 1.65e-08 | 3.31e-07 | 125 |
| GO:000931426 | Thyroid | ATC | response to radiation | 210/6293 | 456/18723 | 1.69e-08 | 3.39e-07 | 210 |
| GO:003464415 | Thyroid | ATC | cellular response to UV | 56/6293 | 90/18723 | 2.53e-08 | 4.86e-07 | 56 |
| GO:004578614 | Thyroid | ATC | negative regulation of cell cycle | 181/6293 | 385/18723 | 2.64e-08 | 5.07e-07 | 181 |
| GO:007233233 | Thyroid | ATC | intrinsic apoptotic signaling pathway by p53 class mediator | 49/6293 | 76/18723 | 3.60e-08 | 6.67e-07 | 49 |
| GO:0010212110 | Thyroid | ATC | response to ionizing radiation | 82/6293 | 148/18723 | 3.88e-08 | 7.15e-07 | 82 |
| GO:004259424 | Thyroid | ATC | response to starvation | 103/6293 | 197/18723 | 4.59e-08 | 8.31e-07 | 103 |
| GO:003367427 | Thyroid | ATC | positive regulation of kinase activity | 212/6293 | 467/18723 | 5.89e-08 | 1.05e-06 | 212 |
| GO:000926724 | Thyroid | ATC | cellular response to starvation | 85/6293 | 156/18723 | 6.14e-08 | 1.09e-06 | 85 |
| GO:005117018 | Thyroid | ATC | import into nucleus | 86/6293 | 159/18723 | 8.02e-08 | 1.40e-06 | 86 |
| Pathway ID | Tissue | Disease Stage | Description | Gene Ratio | Bg Ratio | pvalue | p.adjust | qvalue | Count |
| hsa0516720 | Cervix | CC | Kaposi sarcoma-associated herpesvirus infection | 60/1267 | 194/8465 | 9.74e-09 | 1.58e-07 | 9.33e-08 | 60 |
| hsa0516318 | Cervix | CC | Human cytomegalovirus infection | 65/1267 | 225/8465 | 4.59e-08 | 6.47e-07 | 3.83e-07 | 65 |
| hsa0520516 | Cervix | CC | Proteoglycans in cancer | 60/1267 | 205/8465 | 9.13e-08 | 1.18e-06 | 7.00e-07 | 60 |
| hsa0421810 | Cervix | CC | Cellular senescence | 49/1267 | 156/8465 | 1.30e-07 | 1.63e-06 | 9.61e-07 | 49 |
| hsa0516920 | Cervix | CC | Epstein-Barr virus infection | 57/1267 | 202/8465 | 7.30e-07 | 7.39e-06 | 4.37e-06 | 57 |
| hsa0516620 | Cervix | CC | Human T-cell leukemia virus 1 infection | 61/1267 | 222/8465 | 8.13e-07 | 7.98e-06 | 4.72e-06 | 61 |
| hsa0401210 | Cervix | CC | ErbB signaling pathway | 28/1267 | 85/8465 | 2.40e-05 | 1.82e-04 | 1.08e-04 | 28 |
| hsa052197 | Cervix | CC | Bladder cancer | 16/1267 | 41/8465 | 1.45e-04 | 9.05e-04 | 5.35e-04 | 16 |
| hsa051657 | Cervix | CC | Human papillomavirus infection | 74/1267 | 331/8465 | 1.70e-04 | 1.02e-03 | 6.03e-04 | 74 |
| hsa015223 | Cervix | CC | Endocrine resistance | 28/1267 | 98/8465 | 3.82e-04 | 1.87e-03 | 1.11e-03 | 28 |
| hsa0492812 | Cervix | CC | Parathyroid hormone synthesis, secretion and action | 27/1267 | 106/8465 | 3.12e-03 | 1.19e-02 | 7.03e-03 | 27 |
| hsa0406618 | Cervix | CC | HIF-1 signaling pathway | 27/1267 | 109/8465 | 4.72e-03 | 1.64e-02 | 9.72e-03 | 27 |
| hsa041106 | Cervix | CC | Cell cycle | 36/1267 | 157/8465 | 4.94e-03 | 1.67e-02 | 9.86e-03 | 36 |
| hsa05167110 | Cervix | CC | Kaposi sarcoma-associated herpesvirus infection | 60/1267 | 194/8465 | 9.74e-09 | 1.58e-07 | 9.33e-08 | 60 |
| hsa0516319 | Cervix | CC | Human cytomegalovirus infection | 65/1267 | 225/8465 | 4.59e-08 | 6.47e-07 | 3.83e-07 | 65 |
| hsa0520517 | Cervix | CC | Proteoglycans in cancer | 60/1267 | 205/8465 | 9.13e-08 | 1.18e-06 | 7.00e-07 | 60 |
| hsa0421815 | Cervix | CC | Cellular senescence | 49/1267 | 156/8465 | 1.30e-07 | 1.63e-06 | 9.61e-07 | 49 |
| hsa05169110 | Cervix | CC | Epstein-Barr virus infection | 57/1267 | 202/8465 | 7.30e-07 | 7.39e-06 | 4.37e-06 | 57 |
| hsa05166110 | Cervix | CC | Human T-cell leukemia virus 1 infection | 61/1267 | 222/8465 | 8.13e-07 | 7.98e-06 | 4.72e-06 | 61 |
| hsa0401213 | Cervix | CC | ErbB signaling pathway | 28/1267 | 85/8465 | 2.40e-05 | 1.82e-04 | 1.08e-04 | 28 |
| Hugo Symbol | Variant Class | Variant Classification | dbSNP RS | HGVSc | HGVSp | HGVSp Short | SWISSPROT | BIOTYPE | SIFT | PolyPhen | Tumor Sample Barcode | Tissue | Histology | Sex | Age | Stage | Therapy Types | Drugs | Outcome |
| CDKN1A | SNV | Missense_Mutation | novel | c.458C>G | p.Ser153Cys | p.S153C | P38936 | protein_coding | deleterious(0) | probably_damaging(0.956) | TCGA-C5-A8YR-01 | Cervix | cervical & endocervical cancer | Female | <65 | I/II | Unknown | Unknown | PD |
| CDKN1A | SNV | Missense_Mutation | rs779717089 | c.256N>T | p.Arg86Trp | p.R86W | P38936 | protein_coding | tolerated(0.22) | benign(0.005) | TCGA-DS-A1OA-01 | Cervix | cervical & endocervical cancer | Female | >=65 | I/II | Chemotherapy | carboplatin | PD |
| CDKN1A | SNV | Missense_Mutation | novel | c.280C>T | p.Arg94Trp | p.R94W | P38936 | protein_coding | tolerated(0.11) | benign(0.005) | TCGA-EA-A410-01 | Cervix | cervical & endocervical cancer | Female | <65 | I/II | Unknown | Unknown | SD |
| CDKN1A | deletion | Frame_Shift_Del | novel | c.250_268delCGAGGCCGGGATGAGTTGG | p.Arg84GlufsTer58 | p.R84Efs*58 | P38936 | protein_coding | | | TCGA-ZJ-A8QR-01 | Cervix | cervical & endocervical cancer | Female | <65 | I/II | Unknown | Unknown | SD |
| CDKN1A | SNV | Missense_Mutation | rs376481017 | c.97N>A | p.Asp33Asn | p.D33N | P38936 | protein_coding | deleterious(0.01) | probably_damaging(0.994) | TCGA-AA-3492-01 | Colorectum | colon adenocarcinoma | Female | >=65 | I/II | Unknown | Unknown | SD |
| CDKN1A | SNV | Missense_Mutation | rs753291170 | c.166G>A | p.Glu56Lys | p.E56K | P38936 | protein_coding | deleterious(0) | probably_damaging(0.926) | TCGA-F5-6814-01 | Colorectum | rectum adenocarcinoma | Male | <65 | I/II | Unknown | Unknown | SD |
| CDKN1A | SNV | Missense_Mutation | | c.115N>A | p.Ala39Thr | p.A39T | P38936 | protein_coding | tolerated(0.15) | benign(0.419) | TCGA-A5-A2K7-01 | Endometrium | uterine corpus endometrioid carcinoma | Female | <65 | I/II | Chemotherapy | taxol | SD |
| CDKN1A | SNV | Missense_Mutation | rs774390644 | c.424N>T | p.Arg142Trp | p.R142W | P38936 | protein_coding | deleterious(0) | probably_damaging(0.913) | TCGA-AJ-A3BH-01 | Endometrium | uterine corpus endometrioid carcinoma | Female | Unknown | I/II | Unknown | Unknown | SD |
| CDKN1A | SNV | Missense_Mutation | rs372390764 | c.199C>T | p.Arg67Cys | p.R67C | P38936 | protein_coding | deleterious(0.04) | probably_damaging(0.927) | TCGA-AJ-A8CT-01 | Endometrium | uterine corpus endometrioid carcinoma | Female | <65 | I/II | Unknown | Unknown | SD |
| CDKN1A | SNV | Missense_Mutation | rs748758330 | c.205N>T | p.Arg69Trp | p.R69W | P38936 | protein_coding | tolerated(0.23) | benign(0.005) | TCGA-AP-A051-01 | Endometrium | uterine corpus endometrioid carcinoma | Female | >=65 | I/II | Unknown | Unknown | SD |
| Entrez ID | Symbol | Category | Interaction Types | Drug Claim Name | Drug Name | PMIDs |
| 1026 | CDKN1A | CLINICALLY ACTIONABLE, DRUG RESISTANCE, KINASE, TUMOR SUPPRESSOR, DRUGGABLE GENOME | | ANTIMETABOLITE | | 10997587 |
| 1026 | CDKN1A | CLINICALLY ACTIONABLE, DRUG RESISTANCE, KINASE, TUMOR SUPPRESSOR, DRUGGABLE GENOME | | celecoxib | CELECOXIB | 22336956 |
| 1026 | CDKN1A | CLINICALLY ACTIONABLE, DRUG RESISTANCE, KINASE, TUMOR SUPPRESSOR, DRUGGABLE GENOME | | SODIUM PHENYLBUTYRATE | | 16246228 |
| 1026 | CDKN1A | CLINICALLY ACTIONABLE, DRUG RESISTANCE, KINASE, TUMOR SUPPRESSOR, DRUGGABLE GENOME | | MAPK INHIBITORS | | 16170570 |
| 1026 | CDKN1A | CLINICALLY ACTIONABLE, DRUG RESISTANCE, KINASE, TUMOR SUPPRESSOR, DRUGGABLE GENOME | | L-PAM | MELPHALAN | 11507071 |
| 1026 | CDKN1A | CLINICALLY ACTIONABLE, DRUG RESISTANCE, KINASE, TUMOR SUPPRESSOR, DRUGGABLE GENOME | | ACNU | | 9537648 |
| 1026 | CDKN1A | CLINICALLY ACTIONABLE, DRUG RESISTANCE, KINASE, TUMOR SUPPRESSOR, DRUGGABLE GENOME | | PACLITAXEL | PACLITAXEL | 12574211 |
| 1026 | CDKN1A | CLINICALLY ACTIONABLE, DRUG RESISTANCE, KINASE, TUMOR SUPPRESSOR, DRUGGABLE GENOME | | NICOTINE | NICOTINE | 16011614 |
| 1026 | CDKN1A | CLINICALLY ACTIONABLE, DRUG RESISTANCE, KINASE, TUMOR SUPPRESSOR, DRUGGABLE GENOME | | CARBOPLATIN | CARBOPLATIN | 12168940 |
| 1026 | CDKN1A | CLINICALLY ACTIONABLE, DRUG RESISTANCE, KINASE, TUMOR SUPPRESSOR, DRUGGABLE GENOME | | PTHRP | | 11136536 |


