
|
|||||
|
 | |
| |
| |
| |
| |
| |
|
Gene: GPX1 |
Gene summary for GPX1 |
| Gene information | Species | Human | Gene symbol | GPX1 | Gene ID | 2876 |
| Gene name | glutathione peroxidase 1 | |
| Gene Alias | GPXD | |
| Cytomap | 3p21.31 | |
| Gene Type | protein-coding | GO ID | GO:0000302 | UniProtAcc | P07203 |
Top |
Malignant transformation analysis |
| Identification of the aberrant gene expression in precancerous and cancerous lesions by comparing the gene expression of stem-like cells in diseased tissues with normal stem cells |
| Entrez ID | Symbol | Replicates | Species | Organ | Tissue | Adj P-value | Log2FC | Malignancy |
| 2876 | GPX1 | GSM4909281 | Human | Breast | IDC | 7.78e-22 | -3.72e-01 | 0.21 |
| 2876 | GPX1 | GSM4909282 | Human | Breast | IDC | 3.31e-22 | -3.72e-01 | -0.0288 |
| 2876 | GPX1 | GSM4909285 | Human | Breast | IDC | 1.82e-21 | -3.72e-01 | 0.21 |
| 2876 | GPX1 | GSM4909286 | Human | Breast | IDC | 1.82e-21 | -3.72e-01 | 0.1081 |
| 2876 | GPX1 | GSM4909287 | Human | Breast | IDC | 3.56e-19 | -3.72e-01 | 0.2057 |
| 2876 | GPX1 | GSM4909288 | Human | Breast | IDC | 3.47e-04 | -3.72e-01 | 0.0988 |
| 2876 | GPX1 | GSM4909289 | Human | Breast | IDC | 9.03e-03 | -3.72e-01 | 0.1064 |
| 2876 | GPX1 | GSM4909290 | Human | Breast | IDC | 1.25e-13 | -3.72e-01 | 0.2096 |
| 2876 | GPX1 | GSM4909291 | Human | Breast | IDC | 5.65e-11 | -3.72e-01 | 0.1753 |
| 2876 | GPX1 | GSM4909293 | Human | Breast | IDC | 7.78e-22 | -3.72e-01 | 0.1581 |
| 2876 | GPX1 | GSM4909294 | Human | Breast | IDC | 3.31e-22 | -3.72e-01 | 0.2022 |
| 2876 | GPX1 | GSM4909295 | Human | Breast | IDC | 1.54e-08 | -3.72e-01 | 0.0898 |
| 2876 | GPX1 | GSM4909296 | Human | Breast | IDC | 7.78e-22 | -3.72e-01 | 0.1524 |
| 2876 | GPX1 | GSM4909297 | Human | Breast | IDC | 1.06e-23 | -3.72e-01 | 0.1517 |
| 2876 | GPX1 | GSM4909298 | Human | Breast | IDC | 1.82e-21 | -3.72e-01 | 0.1551 |
| 2876 | GPX1 | GSM4909299 | Human | Breast | IDC | 3.31e-22 | -3.72e-01 | 0.035 |
| 2876 | GPX1 | GSM4909300 | Human | Breast | IDC | 1.73e-07 | -3.72e-01 | 0.0334 |
| 2876 | GPX1 | GSM4909301 | Human | Breast | IDC | 2.52e-23 | -3.72e-01 | 0.1577 |
| 2876 | GPX1 | GSM4909302 | Human | Breast | IDC | 6.78e-19 | -3.72e-01 | 0.1545 |
| 2876 | GPX1 | GSM4909303 | Human | Breast | IDC | 7.99e-05 | -3.72e-01 | 0.0438 |
| Page: 1 2 3 4 5 6 7 8 9 10 11 12 13 |
| Tissue | Expression Dynamics | Abbreviation |
| Breast | 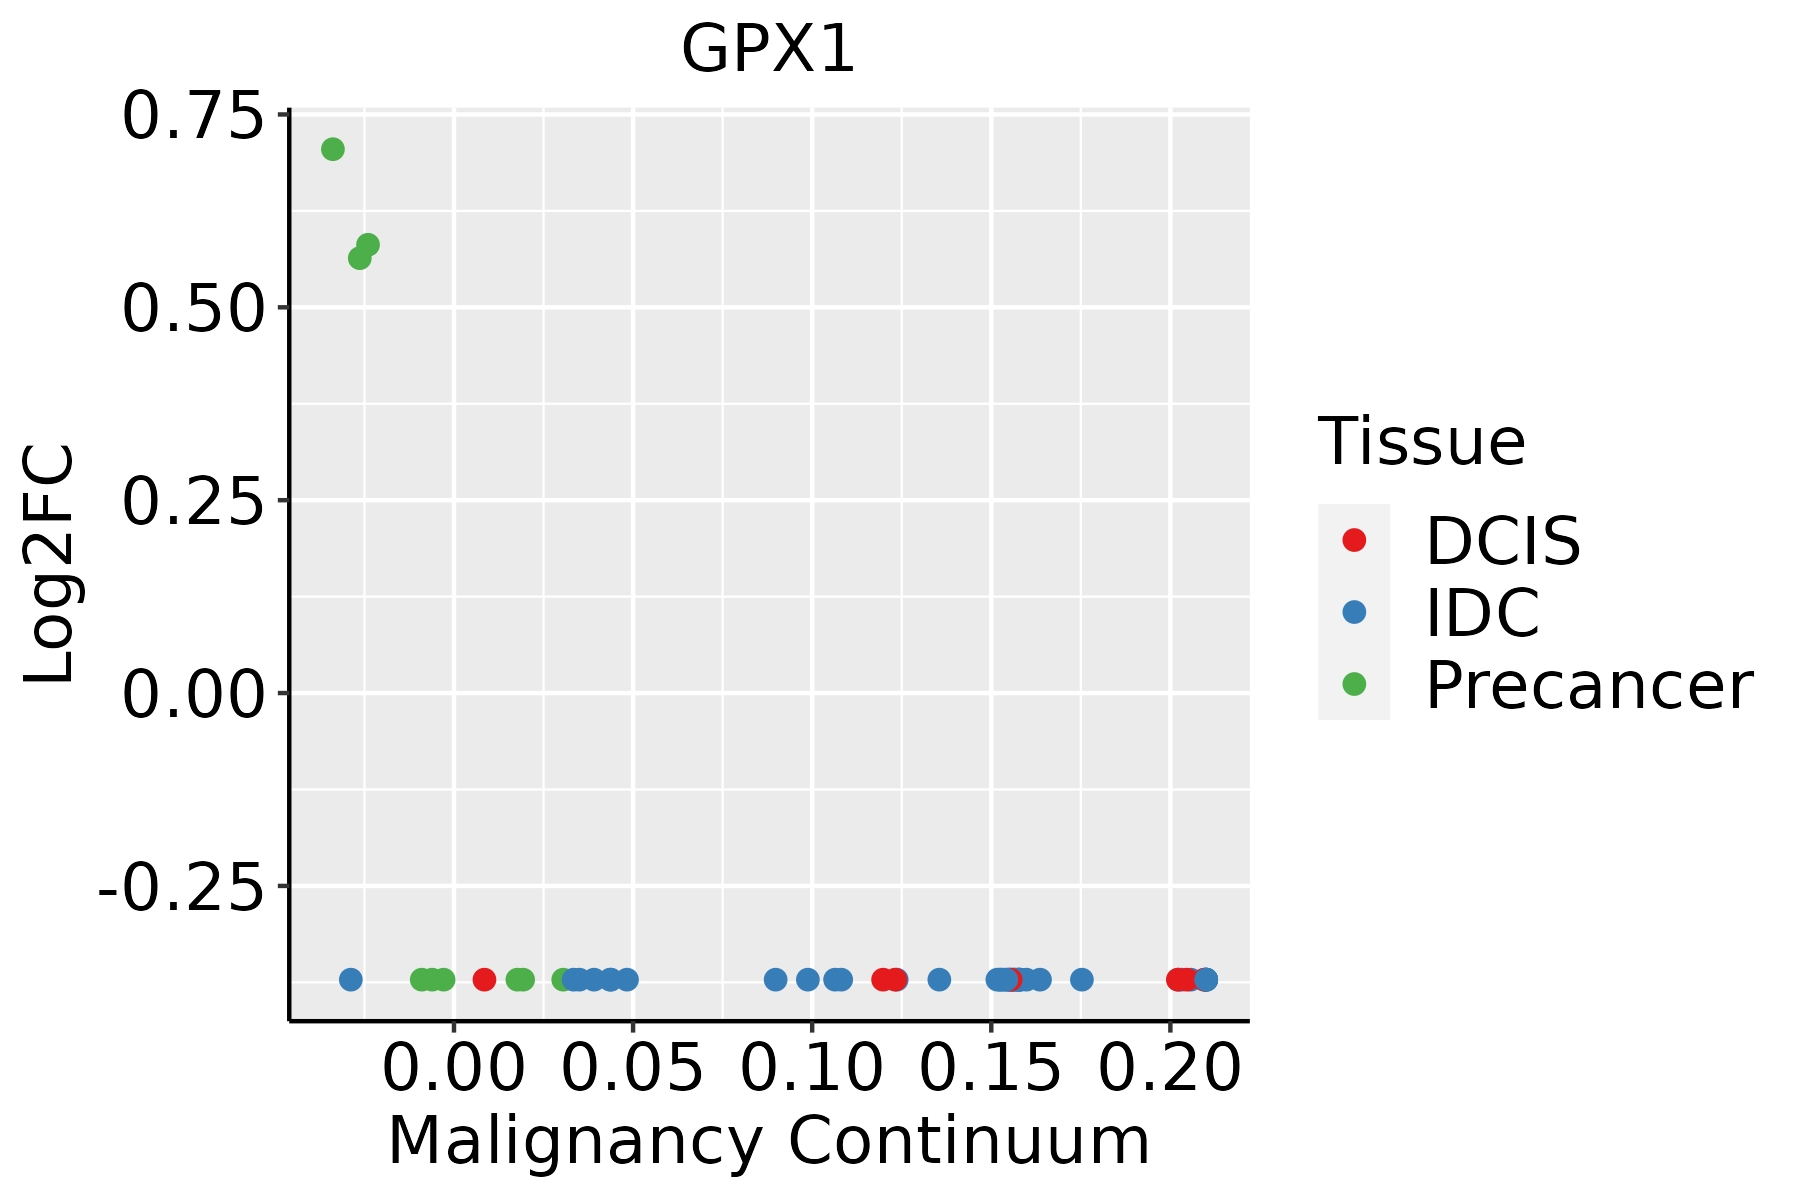 | IDC: Invasive ductal carcinoma |
| DCIS: Ductal carcinoma in situ | ||
| Precancer(BRCA1-mut): Precancerous lesion from BRCA1 mutation carriers | ||
| Colorectum (GSE201348) |  | FAP: Familial adenomatous polyposis |
| CRC: Colorectal cancer | ||
| Colorectum (HTA11) |  | AD: Adenomas |
| SER: Sessile serrated lesions | ||
| MSI-H: Microsatellite-high colorectal cancer | ||
| MSS: Microsatellite stable colorectal cancer | ||
| Esophagus | 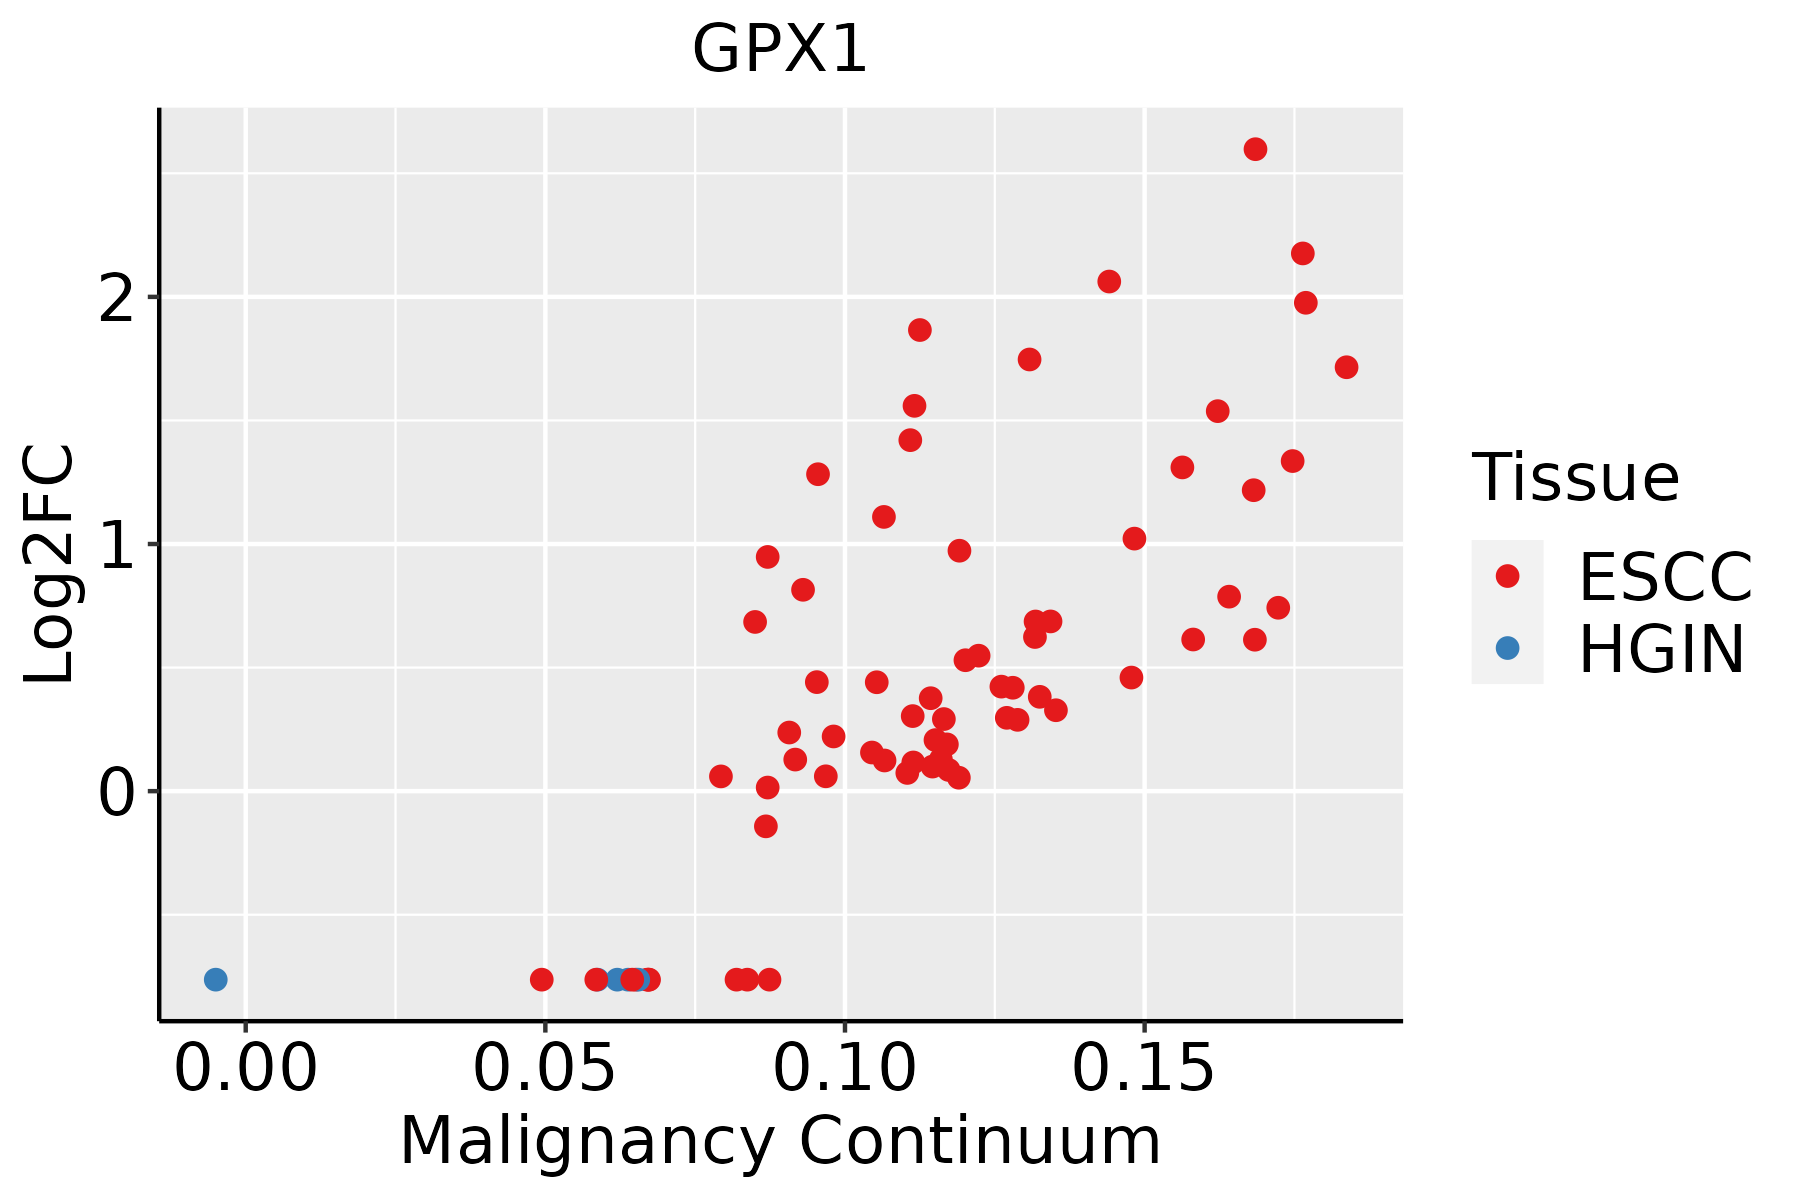 | ESCC: Esophageal squamous cell carcinoma |
| HGIN: High-grade intraepithelial neoplasias | ||
| LGIN: Low-grade intraepithelial neoplasias | ||
| GC | 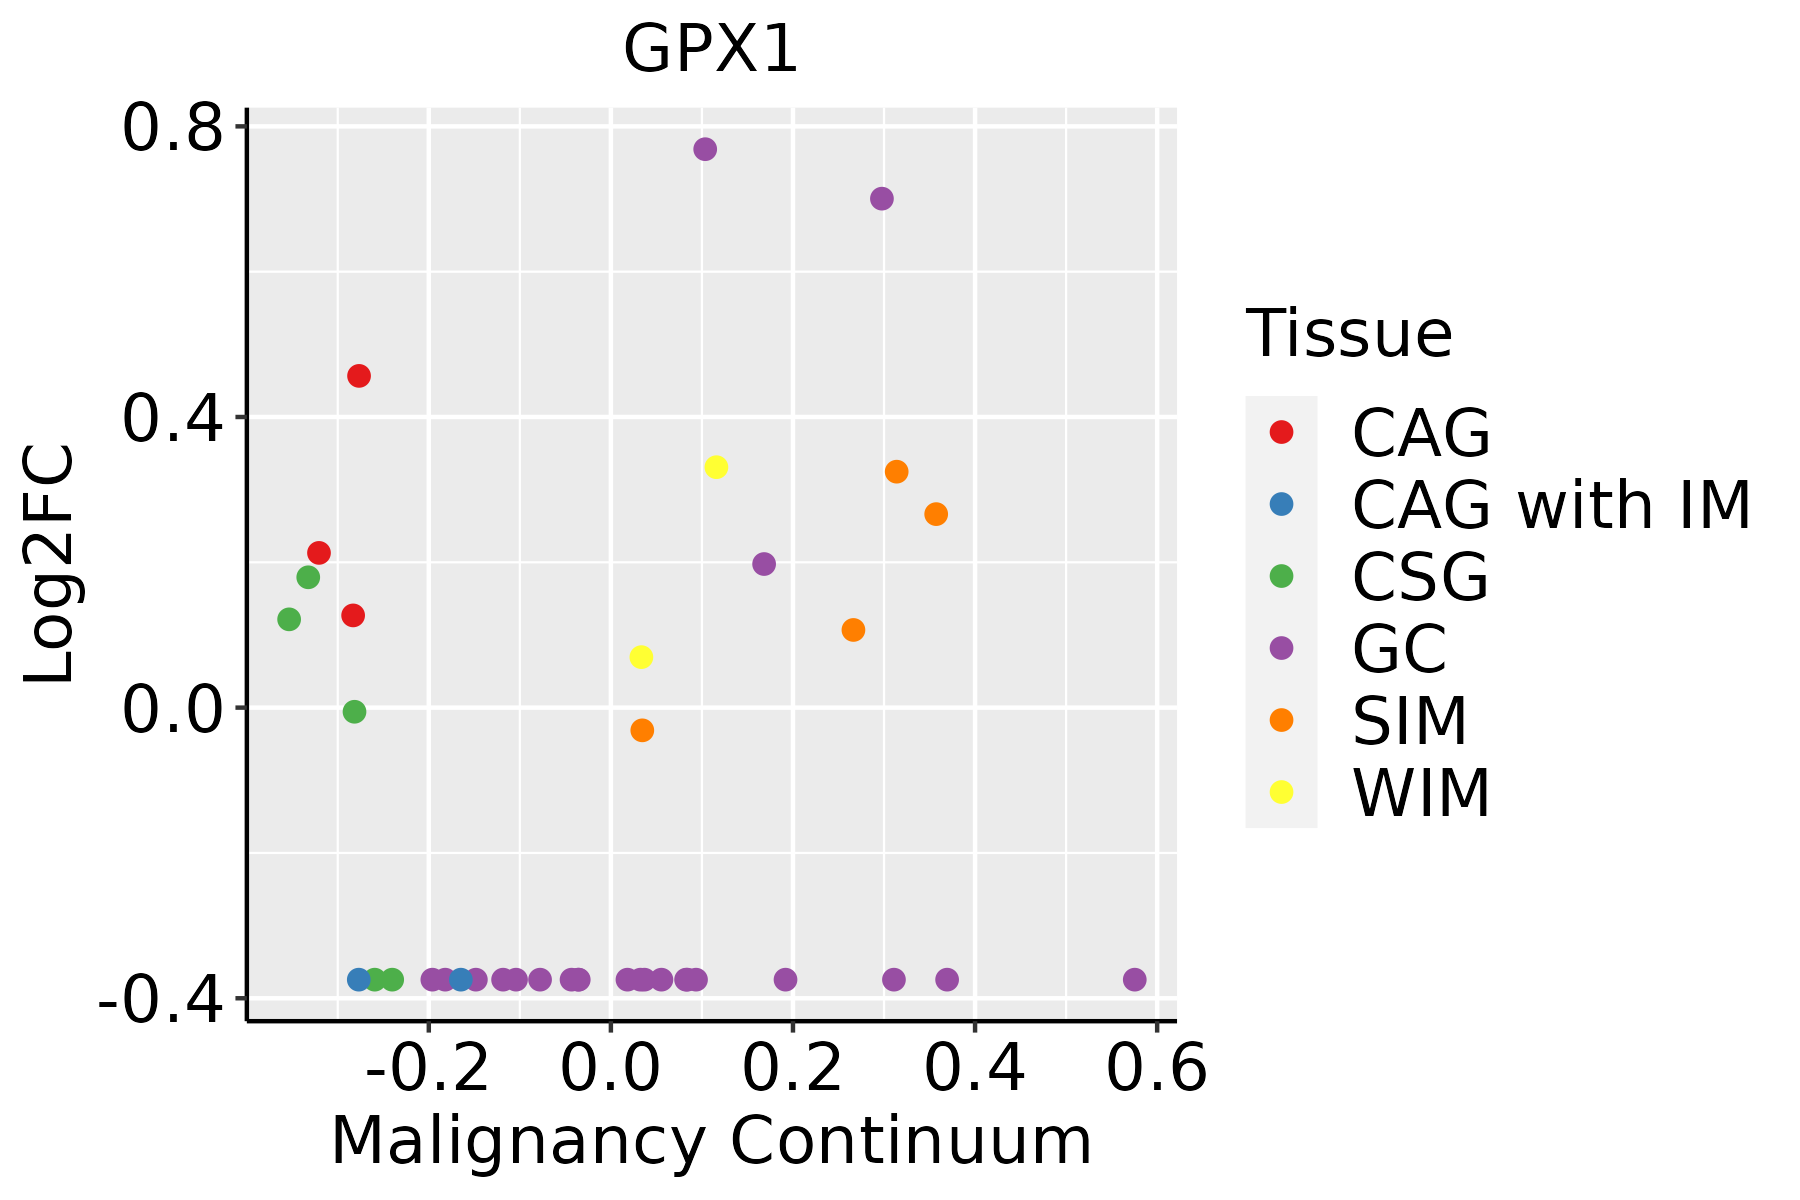 | CAG: Chronic atrophic gastritis |
| CAG with IM: Chronic atrophic gastritis with intestinal metaplasia | ||
| CSG: Chronic superficial gastritis | ||
| GC: Gastric cancer | ||
| SIM: Severe intestinal metaplasia | ||
| WIM: Wild intestinal metaplasia | ||
| Liver |  | HCC: Hepatocellular carcinoma |
| NAFLD: Non-alcoholic fatty liver disease | ||
| Oral Cavity | 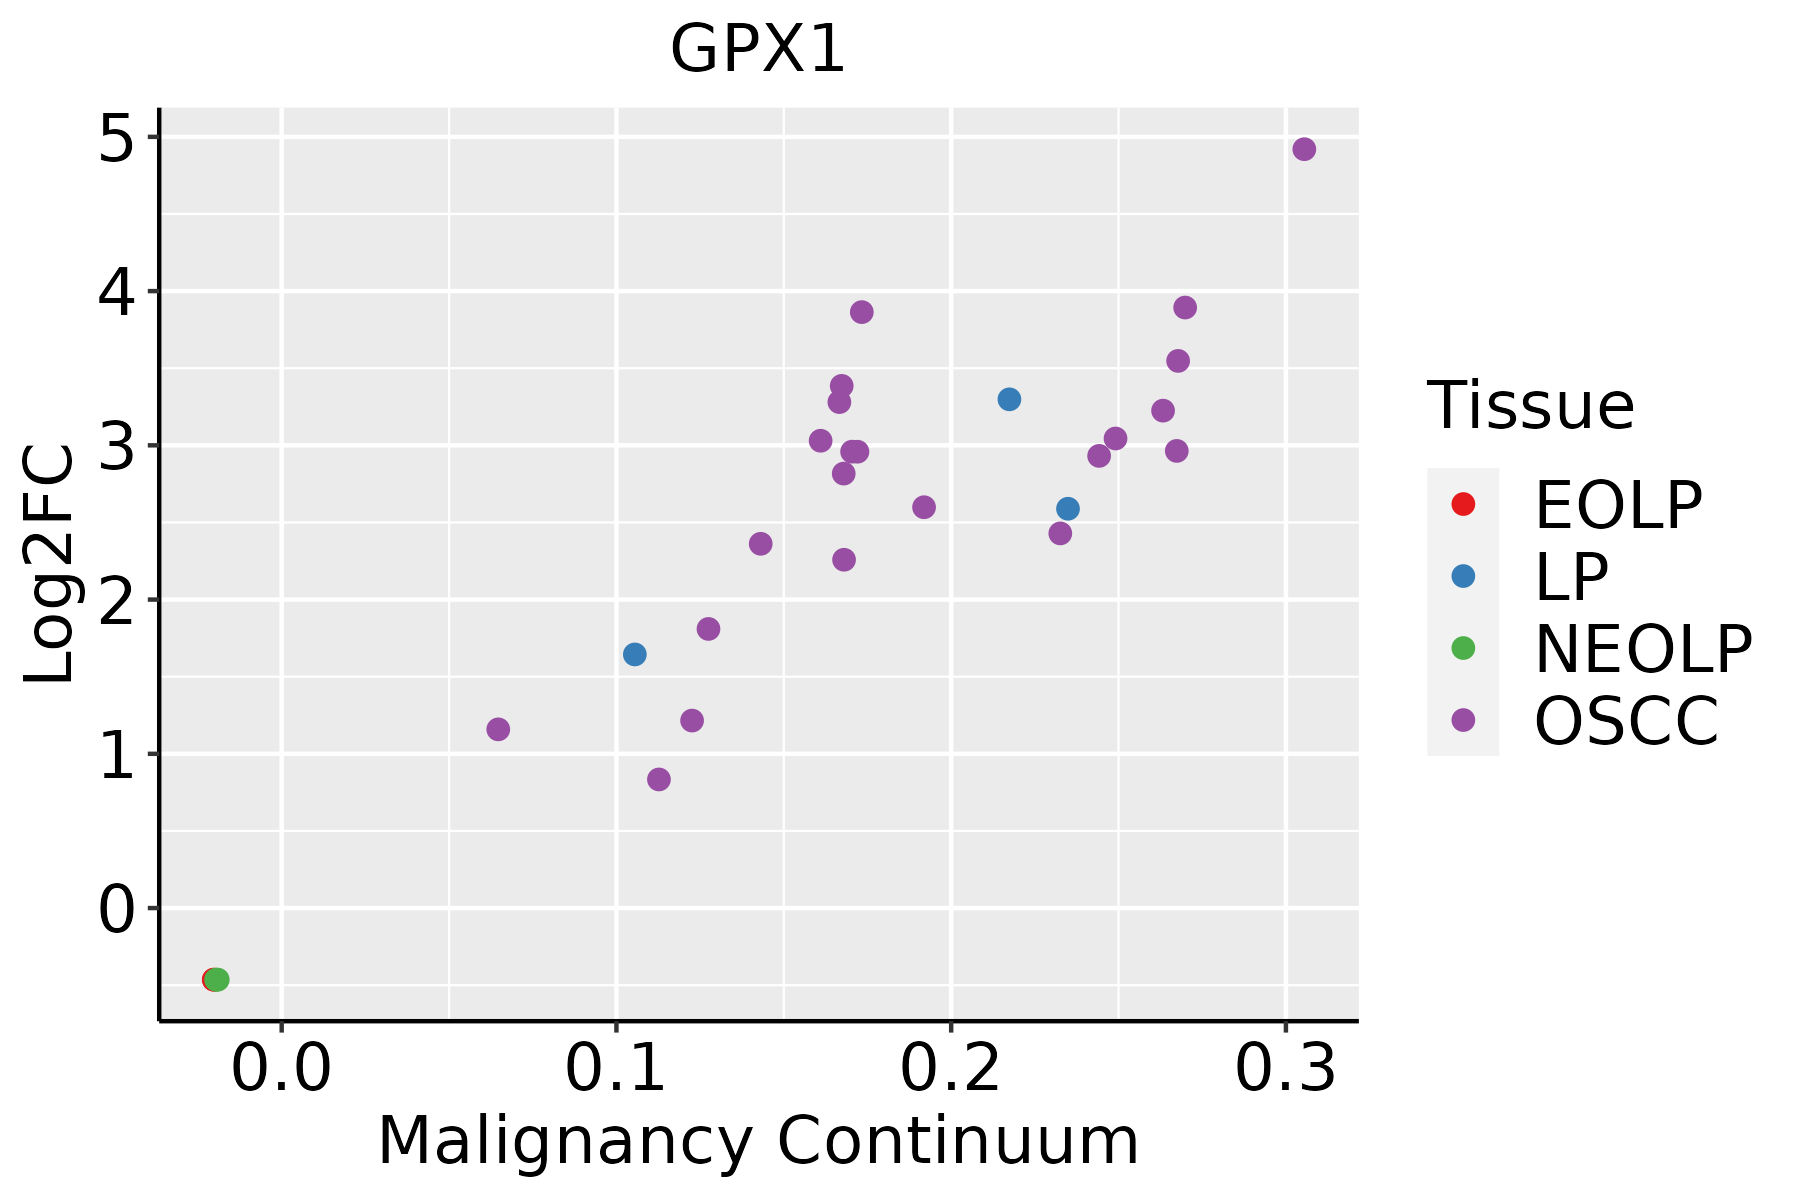 | EOLP: Erosive Oral lichen planus |
| LP: leukoplakia | ||
| NEOLP: Non-erosive oral lichen planus | ||
| OSCC: Oral squamous cell carcinoma | ||
| Prostate |  | BPH: Benign Prostatic Hyperplasia |
| Skin | 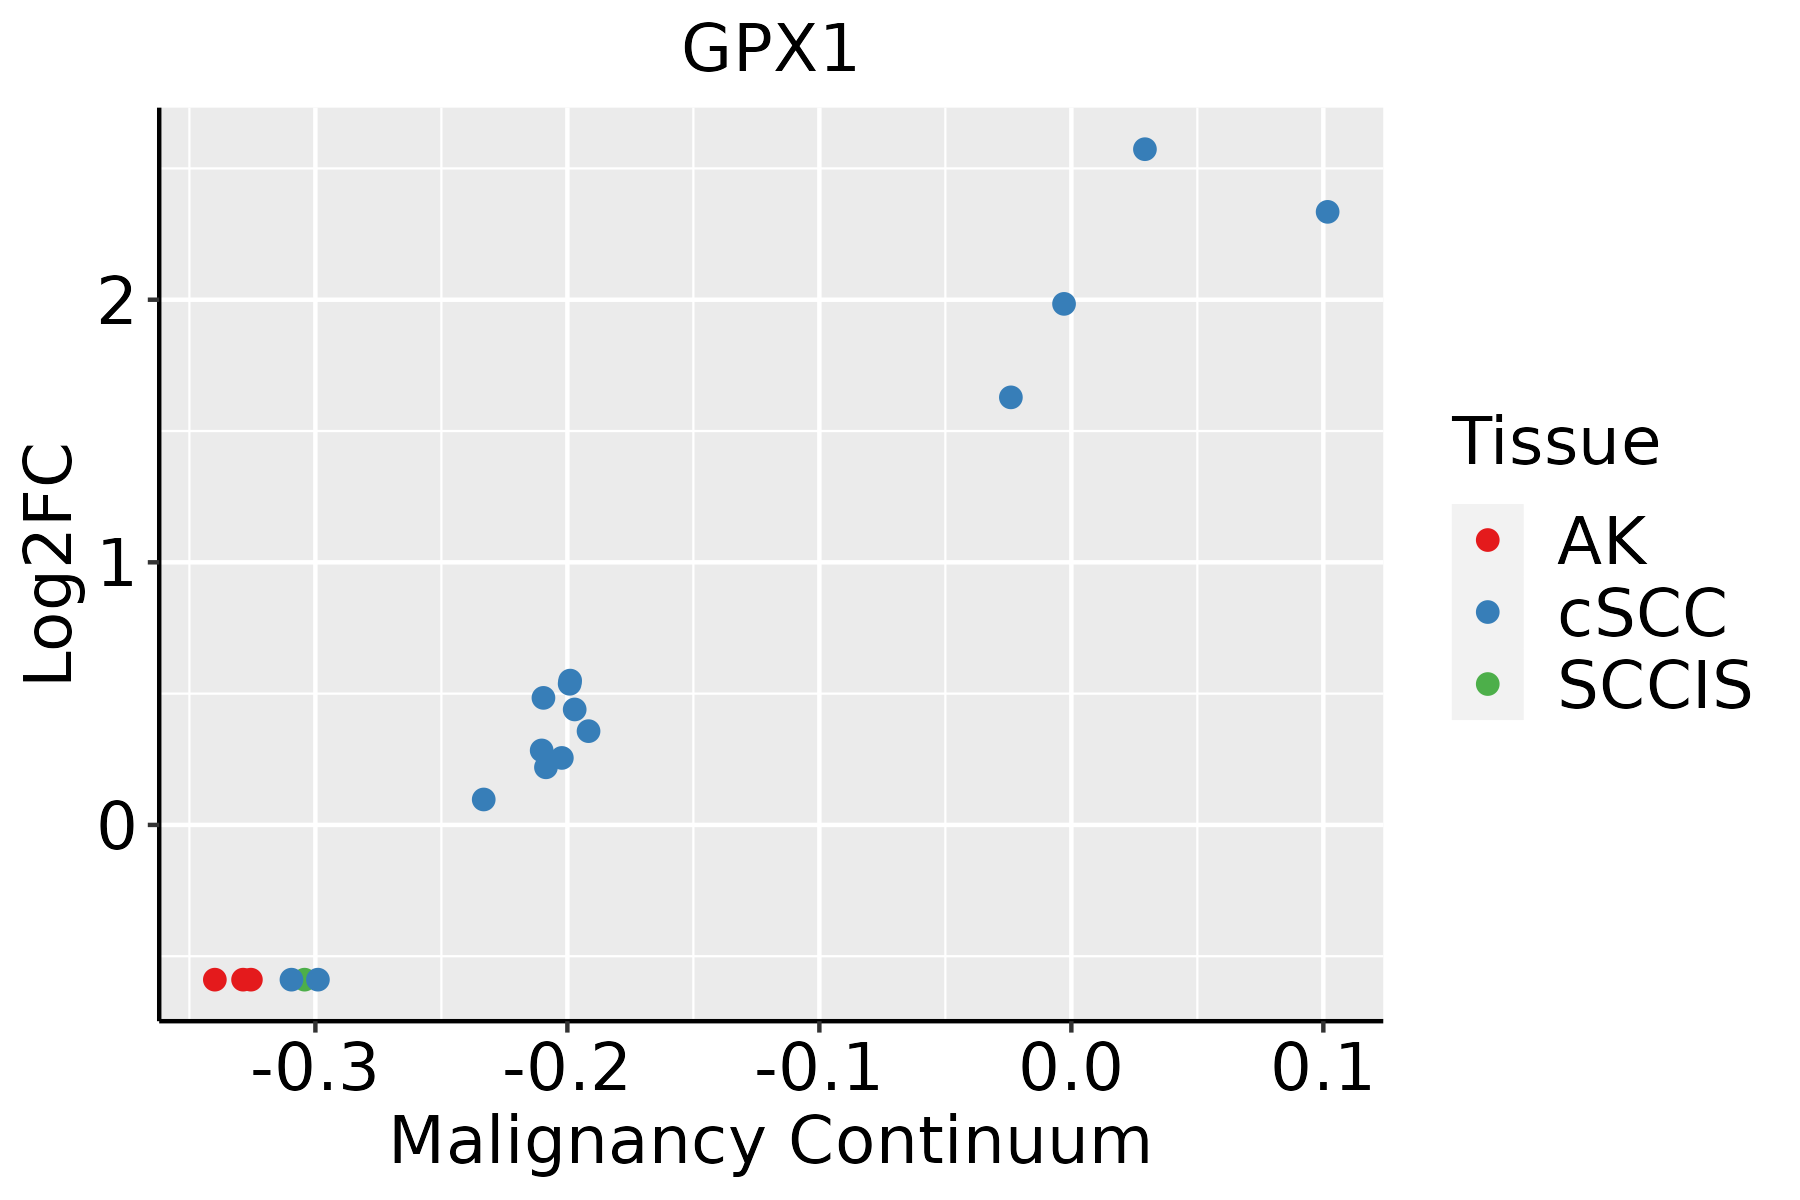 | AK: Actinic keratosis |
| cSCC: Cutaneous squamous cell carcinoma | ||
| SCCIS:squamous cell carcinoma in situ |
| ∗log2FC in expression of this searched gene in stem-like cells from each diseased tissue sample relative to stem-like cells in normal samples in each tissue plotted against the malignancy continuum. Samples are colored based on if they are from different disease stage. |
Top |
Malignant transformation related pathway analysis |
| Find out the enriched GO biological processes and KEGG pathways involved in transition from healthy to precancer to cancer |
| Tissue | Disease Stage | Enriched GO biological Processes |
| Colorectum | AD |  |
| Colorectum | SER |  |
| Colorectum | MSS |  |
| Colorectum | MSI-H |  |
| Colorectum | FAP |  |
| ∗Top 15 enriched GO BP terms are showed in the bar plot of each disease state in each tissue. Each row represents a significant GO biological process which is colored according to the -log10(p.adjust). |
| Page: 1 2 3 4 5 6 7 8 9 |
| GO ID | Tissue | Disease Stage | Description | Gene Ratio | Bg Ratio | pvalue | p.adjust | Count |
| GO:200123721 | Stomach | CSG | negative regulation of extrinsic apoptotic signaling pathway | 16/1034 | 97/18723 | 7.75e-05 | 1.84e-03 | 16 |
| GO:190040721 | Stomach | CSG | regulation of cellular response to oxidative stress | 15/1034 | 89/18723 | 9.99e-05 | 2.22e-03 | 15 |
| GO:00086252 | Stomach | CSG | extrinsic apoptotic signaling pathway via death domain receptors | 14/1034 | 82/18723 | 1.46e-04 | 3.03e-03 | 14 |
| GO:00026832 | Stomach | CSG | negative regulation of immune system process | 43/1034 | 434/18723 | 1.54e-04 | 3.14e-03 | 43 |
| GO:004873221 | Stomach | CSG | gland development | 43/1034 | 436/18723 | 1.70e-04 | 3.33e-03 | 43 |
| GO:00067492 | Stomach | CSG | glutathione metabolic process | 12/1034 | 64/18723 | 1.73e-04 | 3.37e-03 | 12 |
| GO:003647321 | Stomach | CSG | cell death in response to oxidative stress | 15/1034 | 95/18723 | 2.12e-04 | 4.04e-03 | 15 |
| GO:001063921 | Stomach | CSG | negative regulation of organelle organization | 36/1034 | 348/18723 | 2.25e-04 | 4.25e-03 | 36 |
| GO:190305021 | Stomach | CSG | regulation of proteolysis involved in cellular protein catabolic process | 26/1034 | 221/18723 | 2.27e-04 | 4.26e-03 | 26 |
| GO:19020412 | Stomach | CSG | regulation of extrinsic apoptotic signaling pathway via death domain receptors | 10/1034 | 49/18723 | 2.89e-04 | 5.07e-03 | 10 |
| GO:01202542 | Stomach | CSG | olefinic compound metabolic process | 20/1034 | 153/18723 | 2.95e-04 | 5.09e-03 | 20 |
| GO:190288221 | Stomach | CSG | regulation of response to oxidative stress | 15/1034 | 98/18723 | 3.01e-04 | 5.17e-03 | 15 |
| GO:00506782 | Stomach | CSG | regulation of epithelial cell proliferation | 38/1034 | 381/18723 | 3.18e-04 | 5.42e-03 | 38 |
| GO:00093142 | Stomach | CSG | response to radiation | 43/1034 | 456/18723 | 4.45e-04 | 6.98e-03 | 43 |
| GO:19032022 | Stomach | CSG | negative regulation of oxidative stress-induced cell death | 10/1034 | 53/18723 | 5.62e-04 | 8.29e-03 | 10 |
| GO:006113621 | Stomach | CSG | regulation of proteasomal protein catabolic process | 22/1034 | 187/18723 | 6.68e-04 | 9.49e-03 | 22 |
| GO:190217521 | Stomach | CSG | regulation of oxidative stress-induced intrinsic apoptotic signaling pathway | 7/1034 | 29/18723 | 8.20e-04 | 1.11e-02 | 7 |
| GO:200011721 | Stomach | CSG | negative regulation of cysteine-type endopeptidase activity | 13/1034 | 86/18723 | 8.40e-04 | 1.13e-02 | 13 |
| GO:001049811 | Stomach | CSG | proteasomal protein catabolic process | 44/1034 | 490/18723 | 1.06e-03 | 1.34e-02 | 44 |
| GO:005067321 | Stomach | CSG | epithelial cell proliferation | 40/1034 | 437/18723 | 1.22e-03 | 1.48e-02 | 40 |
| Page: 1 2 3 4 5 6 7 8 9 10 11 12 13 14 15 16 17 18 19 20 21 22 23 24 25 26 27 28 29 30 31 32 33 34 35 36 37 38 39 40 41 42 43 44 45 46 47 48 49 50 51 52 53 54 55 56 57 58 59 60 61 62 63 64 65 66 67 68 69 70 71 72 73 74 75 76 77 78 79 80 81 82 83 84 85 86 87 88 89 90 91 92 93 94 95 96 97 98 99 100 |
| Pathway ID | Tissue | Disease Stage | Description | Gene Ratio | Bg Ratio | pvalue | p.adjust | qvalue | Count |
| hsa0501616 | Breast | Precancer | Huntington disease | 98/684 | 306/8465 | 2.85e-35 | 2.25e-33 | 1.72e-33 | 98 |
| hsa0501416 | Breast | Precancer | Amyotrophic lateral sclerosis | 98/684 | 364/8465 | 2.13e-28 | 8.41e-27 | 6.44e-27 | 98 |
| hsa0502216 | Breast | Precancer | Pathways of neurodegeneration - multiple diseases | 112/684 | 476/8465 | 6.96e-27 | 2.44e-25 | 1.87e-25 | 112 |
| hsa0048010 | Breast | Precancer | Glutathione metabolism | 12/684 | 57/8465 | 1.68e-03 | 1.08e-02 | 8.30e-03 | 12 |
| hsa0501617 | Breast | Precancer | Huntington disease | 98/684 | 306/8465 | 2.85e-35 | 2.25e-33 | 1.72e-33 | 98 |
| hsa0501417 | Breast | Precancer | Amyotrophic lateral sclerosis | 98/684 | 364/8465 | 2.13e-28 | 8.41e-27 | 6.44e-27 | 98 |
| hsa0502217 | Breast | Precancer | Pathways of neurodegeneration - multiple diseases | 112/684 | 476/8465 | 6.96e-27 | 2.44e-25 | 1.87e-25 | 112 |
| hsa0048013 | Breast | Precancer | Glutathione metabolism | 12/684 | 57/8465 | 1.68e-03 | 1.08e-02 | 8.30e-03 | 12 |
| hsa0501623 | Breast | IDC | Huntington disease | 103/867 | 306/8465 | 5.14e-30 | 4.17e-28 | 3.12e-28 | 103 |
| hsa0501423 | Breast | IDC | Amyotrophic lateral sclerosis | 102/867 | 364/8465 | 1.29e-22 | 5.22e-21 | 3.91e-21 | 102 |
| hsa0502223 | Breast | IDC | Pathways of neurodegeneration - multiple diseases | 116/867 | 476/8465 | 3.63e-20 | 1.18e-18 | 8.82e-19 | 116 |
| hsa0048023 | Breast | IDC | Glutathione metabolism | 13/867 | 57/8465 | 4.25e-03 | 2.56e-02 | 1.91e-02 | 13 |
| hsa0501633 | Breast | IDC | Huntington disease | 103/867 | 306/8465 | 5.14e-30 | 4.17e-28 | 3.12e-28 | 103 |
| hsa0501433 | Breast | IDC | Amyotrophic lateral sclerosis | 102/867 | 364/8465 | 1.29e-22 | 5.22e-21 | 3.91e-21 | 102 |
| hsa0502233 | Breast | IDC | Pathways of neurodegeneration - multiple diseases | 116/867 | 476/8465 | 3.63e-20 | 1.18e-18 | 8.82e-19 | 116 |
| hsa0048033 | Breast | IDC | Glutathione metabolism | 13/867 | 57/8465 | 4.25e-03 | 2.56e-02 | 1.91e-02 | 13 |
| hsa0501643 | Breast | DCIS | Huntington disease | 101/846 | 306/8465 | 1.54e-29 | 1.24e-27 | 9.13e-28 | 101 |
| hsa0501443 | Breast | DCIS | Amyotrophic lateral sclerosis | 101/846 | 364/8465 | 7.14e-23 | 2.88e-21 | 2.12e-21 | 101 |
| hsa0502243 | Breast | DCIS | Pathways of neurodegeneration - multiple diseases | 114/846 | 476/8465 | 4.74e-20 | 1.53e-18 | 1.13e-18 | 114 |
| hsa0501653 | Breast | DCIS | Huntington disease | 101/846 | 306/8465 | 1.54e-29 | 1.24e-27 | 9.13e-28 | 101 |
| Page: 1 2 3 4 5 6 7 8 9 |
Top |
Cell-cell communication analysis |
| Identification of potential cell-cell interactions between two cell types and their ligand-receptor pairs for different disease states |
| Ligand | Receptor | LRpair | Pathway | Tissue | Disease Stage |
| Page: 1 |
Top |
Single-cell gene regulatory network inference analysis |
| Find out the significant the regulons (TFs) and the target genes of each regulon across cell types for different disease states |
| TF | Cell Type | Tissue | Disease Stage | Target Gene | RSS | Regulon Activity |
| ∗The dot plots of a searched regulon are shown for all cell subpopulations in each disease state of each tissue based on the regulon specific score inferred using pySCENIC and by calculating the average expression. |
| Page: 1 |
Top |
Somatic mutation of malignant transformation related genes |
| Annotation of somatic variants for genes involved in malignant transformation |
| Hugo Symbol | Variant Class | Variant Classification | dbSNP RS | HGVSc | HGVSp | HGVSp Short | SWISSPROT | BIOTYPE | SIFT | PolyPhen | Tumor Sample Barcode | Tissue | Histology | Sex | Age | Stage | Therapy Types | Drugs | Outcome |
| GPX1 | SNV | Missense_Mutation | novel | c.475N>A | p.Asp159Asn | p.D159N | P07203 | protein_coding | deleterious(0.04) | possibly_damaging(0.675) | TCGA-JW-A5VL-01 | Cervix | cervical & endocervical cancer | Female | <65 | I/II | Unknown | Unknown | SD |
| GPX1 | SNV | Missense_Mutation | c.489C>G | p.Asn163Lys | p.N163K | P07203 | protein_coding | deleterious(0) | probably_damaging(0.997) | TCGA-AA-3976-01 | Colorectum | colon adenocarcinoma | Male | >=65 | III/IV | Chemotherapy | folinic | CR | |
| GPX1 | SNV | Missense_Mutation | c.109N>A | p.Gly37Ser | p.G37S | P07203 | protein_coding | deleterious(0.01) | probably_damaging(0.945) | TCGA-CM-6171-01 | Colorectum | colon adenocarcinoma | Female | >=65 | I/II | Unknown | Unknown | SD | |
| GPX1 | insertion | Frame_Shift_Ins | novel | c.364_365insG | p.Ala122GlyfsTer? | p.A122Gfs*? | P07203 | protein_coding | TCGA-CK-6746-01 | Colorectum | colon adenocarcinoma | Female | >=65 | I/II | Unknown | Unknown | SD | ||
| GPX1 | SNV | Missense_Mutation | novel | c.264G>T | p.Lys88Asn | p.K88N | P07203 | protein_coding | tolerated(0.43) | benign(0.027) | TCGA-AP-A1E0-01 | Endometrium | uterine corpus endometrioid carcinoma | Female | <65 | III/IV | Chemotherapy | paclitaxel | SD |
| GPX1 | SNV | Missense_Mutation | novel | c.493N>A | p.Glu165Lys | p.E165K | P07203 | protein_coding | deleterious(0.02) | probably_damaging(0.941) | TCGA-DD-A114-01 | Liver | liver hepatocellular carcinoma | Male | <65 | I/II | Unknown | Unknown | SD |
| GPX1 | SNV | Missense_Mutation | c.110G>A | p.Gly37Asp | p.G37D | P07203 | protein_coding | tolerated(0.12) | benign(0.355) | TCGA-DD-A73B-01 | Liver | liver hepatocellular carcinoma | Female | >=65 | I/II | Unknown | Unknown | PD | |
| GPX1 | SNV | Missense_Mutation | rs755209006 | c.524N>T | p.Pro175Leu | p.P175L | P07203 | protein_coding | deleterious(0.01) | probably_damaging(1) | TCGA-50-7109-01 | Lung | lung adenocarcinoma | Male | <65 | I/II | Unknown | Unknown | PD |
| GPX1 | SNV | Missense_Mutation | c.415G>A | p.Asp139Asn | p.D139N | P07203 | protein_coding | tolerated(0.07) | benign(0.193) | TCGA-55-7727-01 | Lung | lung adenocarcinoma | Male | >=65 | III/IV | Unknown | Unknown | SD | |
| GPX1 | SNV | Missense_Mutation | c.436G>T | p.Asp146Tyr | p.D146Y | P07203 | protein_coding | deleterious(0) | probably_damaging(0.928) | TCGA-55-A4DF-01 | Lung | lung adenocarcinoma | Male | >=65 | I/II | Unknown | Unknown | PD |
| Page: 1 2 |
Top |
Related drugs of malignant transformation related genes |
| Identification of chemicals and drugs interact with genes involved in malignant transfromation |
| (DGIdb 4.0) |
| Entrez ID | Symbol | Category | Interaction Types | Drug Claim Name | Drug Name | PMIDs |
| 2876 | GPX1 | DRUGGABLE GENOME, PROTEASE INHIBITOR | GP-120 | 16871233 |
| Page: 1 |

Copyright 2023-Present -The University of Texas Health Science Center at Houston |