
|
|||||
|
 | |
| |
| |
| |
| |
| |
|
Gene: CD2 |
Gene summary for CD2 |
| Gene information | Species | Human | Gene symbol | CD2 | Gene ID | 914 |
| Gene name | CD2 molecule | |
| Gene Alias | LFA-2 | |
| Cytomap | 1p13.1 | |
| Gene Type | protein-coding | GO ID | GO:0001766 | UniProtAcc | P06729 |
Top |
Malignant transformation analysis |
| Identification of the aberrant gene expression in precancerous and cancerous lesions by comparing the gene expression of stem-like cells in diseased tissues with normal stem cells |
| Entrez ID | Symbol | Replicates | Species | Organ | Tissue | Adj P-value | Log2FC | Malignancy |
| 914 | CD2 | GSM4909317 | Human | Breast | IDC | 5.23e-05 | 1.70e-01 | 0.1355 |
| 914 | CD2 | M1 | Human | Breast | IDC | 3.01e-40 | 8.10e-01 | 0.1577 |
| 914 | CD2 | P1 | Human | Breast | IDC | 4.16e-12 | 6.08e-01 | 0.1527 |
| 914 | CD2 | LZE4T | Human | Esophagus | ESCC | 4.60e-14 | 7.29e-01 | 0.0811 |
| 914 | CD2 | LZE7T | Human | Esophagus | ESCC | 2.24e-10 | 7.96e-01 | 0.0667 |
| 914 | CD2 | LZE8T | Human | Esophagus | ESCC | 3.62e-04 | 4.38e-01 | 0.067 |
| 914 | CD2 | LZE22D1 | Human | Esophagus | HGIN | 3.59e-02 | 2.59e-01 | 0.0595 |
| 914 | CD2 | LZE24T | Human | Esophagus | ESCC | 4.59e-03 | 1.77e-01 | 0.0596 |
| 914 | CD2 | LZE6T | Human | Esophagus | ESCC | 3.15e-24 | 1.50e+00 | 0.0845 |
| 914 | CD2 | C21 | Human | Oral cavity | OSCC | 1.93e-15 | 6.64e-01 | 0.2678 |
| 914 | CD2 | C30 | Human | Oral cavity | OSCC | 2.02e-06 | 2.12e-01 | 0.3055 |
| 914 | CD2 | C38 | Human | Oral cavity | OSCC | 6.23e-08 | 1.25e+00 | 0.172 |
| 914 | CD2 | C46 | Human | Oral cavity | OSCC | 5.10e-05 | 2.47e-01 | 0.1673 |
| 914 | CD2 | C51 | Human | Oral cavity | OSCC | 1.67e-03 | 1.61e-01 | 0.2674 |
| 914 | CD2 | C57 | Human | Oral cavity | OSCC | 8.29e-04 | 1.33e-01 | 0.1679 |
| 914 | CD2 | C06 | Human | Oral cavity | OSCC | 2.51e-03 | 9.88e-01 | 0.2699 |
| 914 | CD2 | C07 | Human | Oral cavity | OSCC | 1.79e-03 | 3.19e-01 | 0.2491 |
| 914 | CD2 | LN22 | Human | Oral cavity | OSCC | 2.16e-04 | 7.29e-01 | 0.1733 |
| 914 | CD2 | LN38 | Human | Oral cavity | OSCC | 2.02e-02 | 6.93e-01 | 0.168 |
| Page: 1 |
| Tissue | Expression Dynamics | Abbreviation |
| Breast |  | IDC: Invasive ductal carcinoma |
| DCIS: Ductal carcinoma in situ | ||
| Precancer(BRCA1-mut): Precancerous lesion from BRCA1 mutation carriers | ||
| Esophagus | 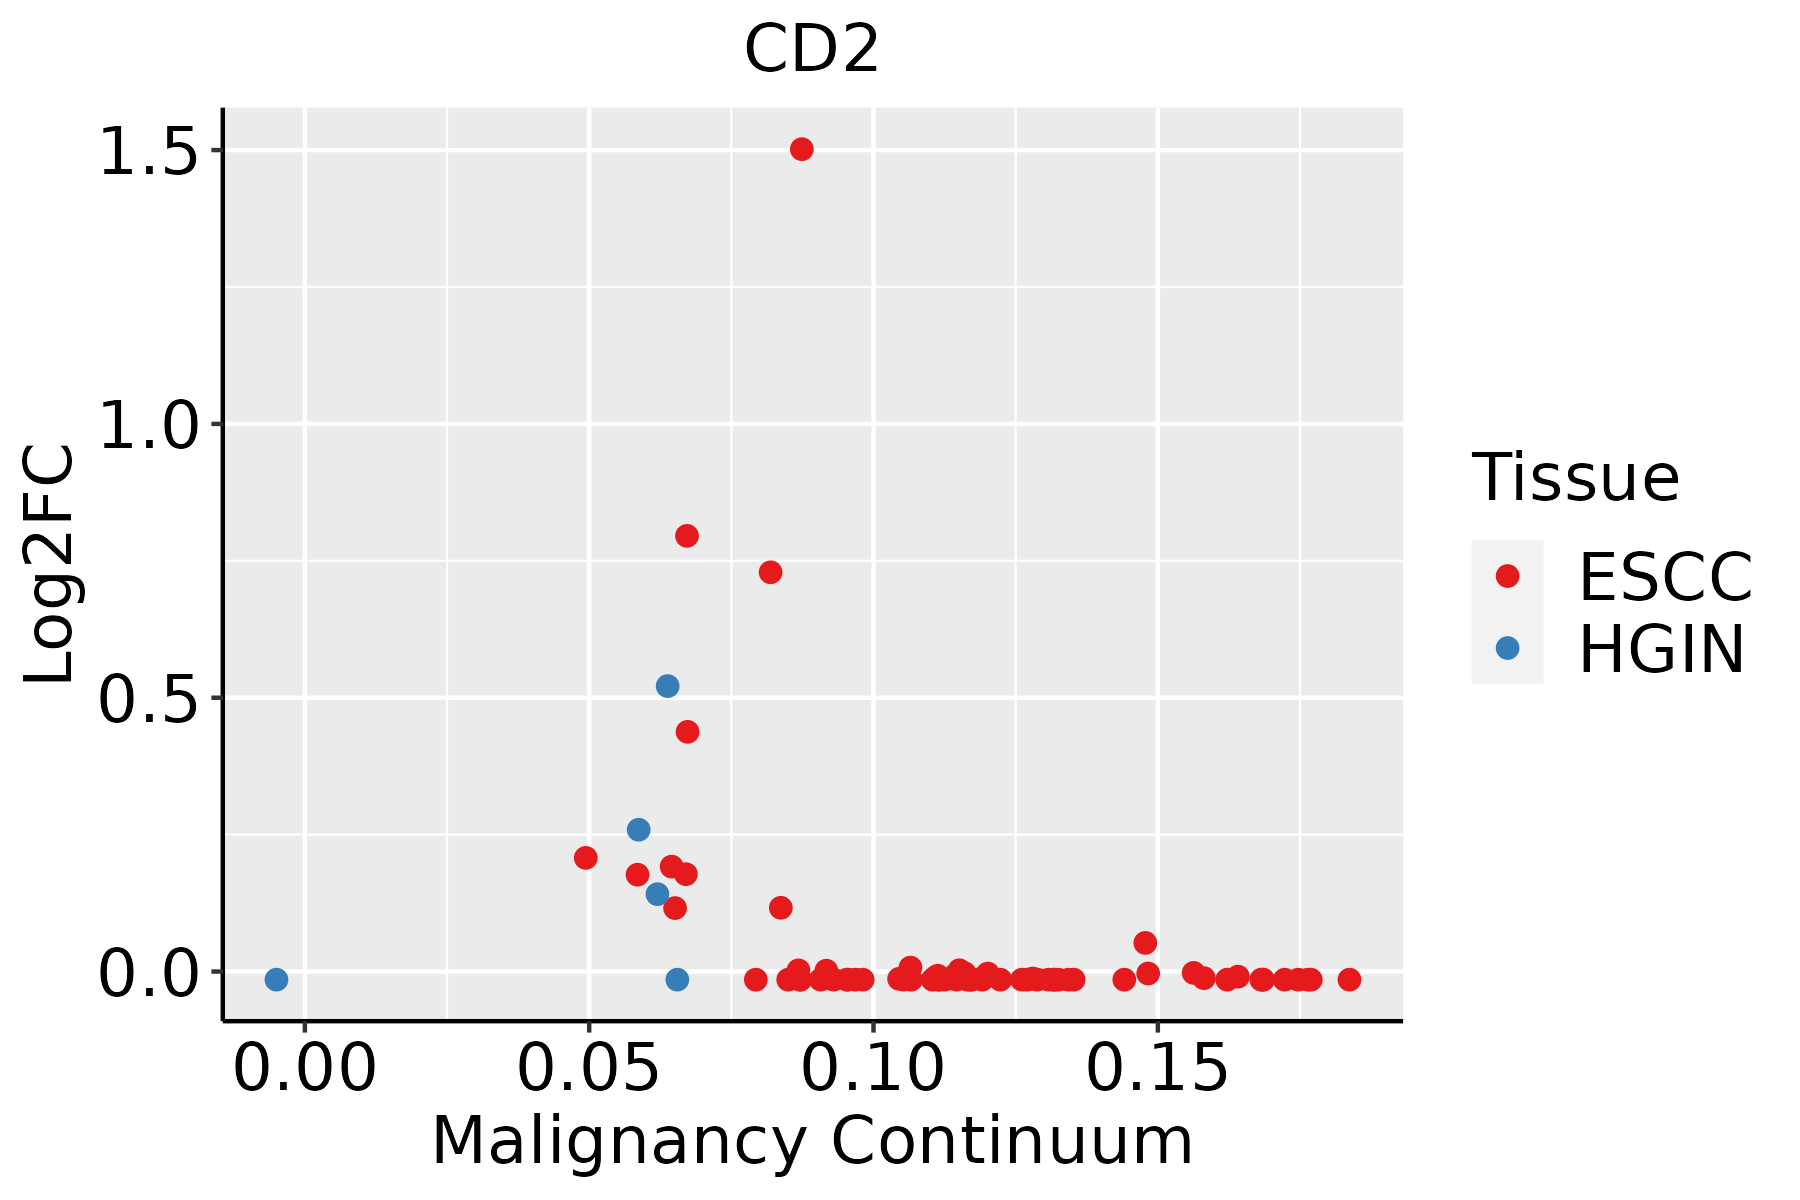 | ESCC: Esophageal squamous cell carcinoma |
| HGIN: High-grade intraepithelial neoplasias | ||
| LGIN: Low-grade intraepithelial neoplasias | ||
| Oral Cavity | 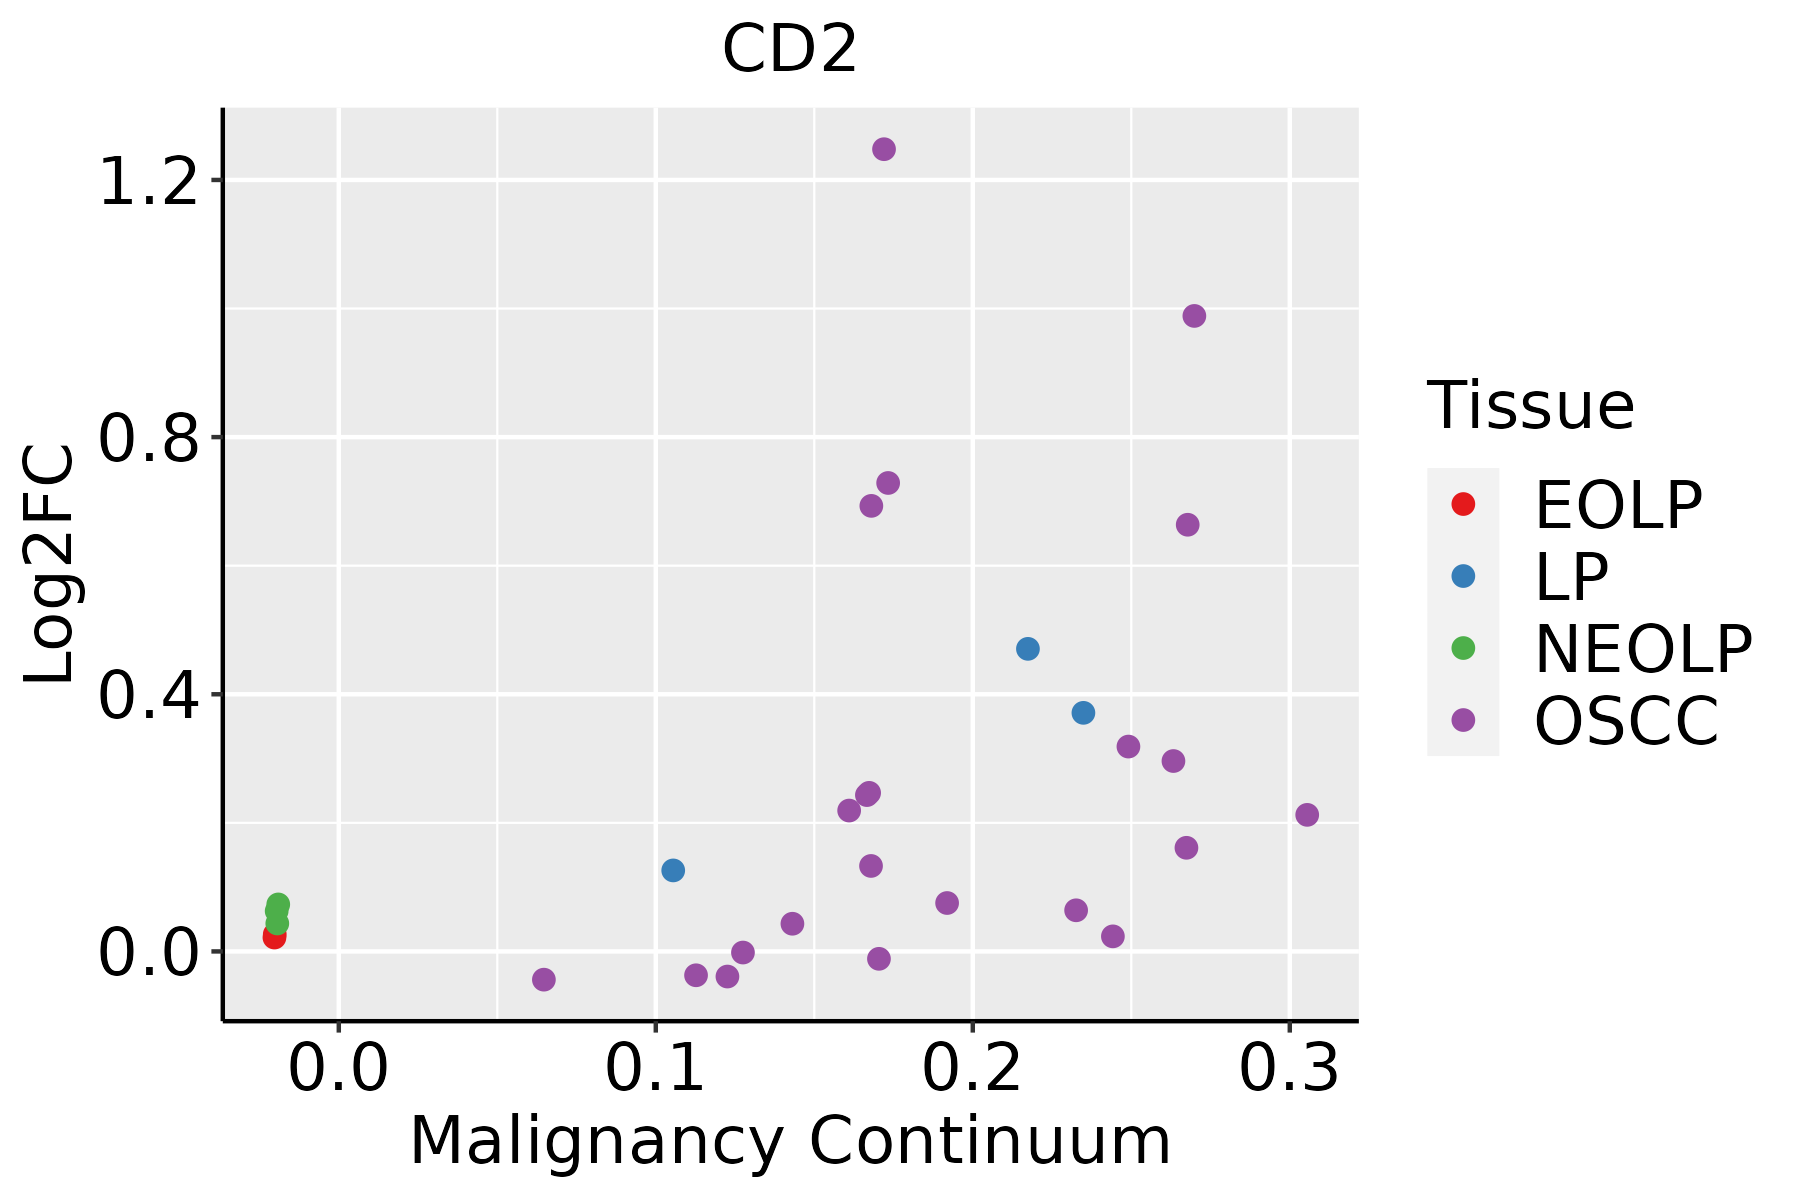 | EOLP: Erosive Oral lichen planus |
| LP: leukoplakia | ||
| NEOLP: Non-erosive oral lichen planus | ||
| OSCC: Oral squamous cell carcinoma |
| ∗log2FC in expression of this searched gene in stem-like cells from each diseased tissue sample relative to stem-like cells in normal samples in each tissue plotted against the malignancy continuum. Samples are colored based on if they are from different disease stage. |
Top |
Malignant transformation related pathway analysis |
| Find out the enriched GO biological processes and KEGG pathways involved in transition from healthy to precancer to cancer |
| Tissue | Disease Stage | Enriched GO biological Processes |
| Colorectum | AD |  |
| Colorectum | SER |  |
| Colorectum | MSS |  |
| Colorectum | MSI-H |  |
| Colorectum | FAP |  |
| ∗Top 15 enriched GO BP terms are showed in the bar plot of each disease state in each tissue. Each row represents a significant GO biological process which is colored according to the -log10(p.adjust). |
| Page: 1 2 3 4 5 6 7 8 9 |
| GO ID | Tissue | Disease Stage | Description | Gene Ratio | Bg Ratio | pvalue | p.adjust | Count |
| GO:009015017 | Prostate | Tumor | establishment of protein localization to membrane | 77/3246 | 260/18723 | 6.46e-07 | 1.33e-05 | 77 |
| GO:004586015 | Prostate | Tumor | positive regulation of protein kinase activity | 105/3246 | 386/18723 | 7.09e-07 | 1.43e-05 | 105 |
| GO:007190014 | Prostate | Tumor | regulation of protein serine/threonine kinase activity | 98/3246 | 359/18723 | 1.39e-06 | 2.51e-05 | 98 |
| GO:003153215 | Prostate | Tumor | actin cytoskeleton reorganization | 38/3246 | 107/18723 | 4.76e-06 | 7.44e-05 | 38 |
| GO:000915218 | Prostate | Tumor | purine ribonucleotide biosynthetic process | 53/3246 | 169/18723 | 5.62e-06 | 8.63e-05 | 53 |
| GO:005123613 | Prostate | Tumor | establishment of RNA localization | 52/3246 | 166/18723 | 7.11e-06 | 1.07e-04 | 52 |
| GO:005065713 | Prostate | Tumor | nucleic acid transport | 51/3246 | 163/18723 | 8.99e-06 | 1.32e-04 | 51 |
| GO:005065813 | Prostate | Tumor | RNA transport | 51/3246 | 163/18723 | 8.99e-06 | 1.32e-04 | 51 |
| GO:000165513 | Prostate | Tumor | urogenital system development | 90/3246 | 338/18723 | 1.08e-05 | 1.56e-04 | 90 |
| GO:007050714 | Prostate | Tumor | regulation of microtubule cytoskeleton organization | 47/3246 | 148/18723 | 1.29e-05 | 1.78e-04 | 47 |
| GO:000632514 | Prostate | Tumor | chromatin organization | 104/3246 | 409/18723 | 2.02e-05 | 2.62e-04 | 104 |
| GO:001097011 | Prostate | Tumor | transport along microtubule | 48/3246 | 155/18723 | 2.20e-05 | 2.80e-04 | 48 |
| GO:002240717 | Prostate | Tumor | regulation of cell-cell adhesion | 112/3246 | 448/18723 | 2.20e-05 | 2.80e-04 | 112 |
| GO:003406712 | Prostate | Tumor | protein localization to Golgi apparatus | 15/3246 | 29/18723 | 2.48e-05 | 3.10e-04 | 15 |
| GO:000926016 | Prostate | Tumor | ribonucleotide biosynthetic process | 54/3246 | 182/18723 | 2.71e-05 | 3.29e-04 | 54 |
| GO:000911718 | Prostate | Tumor | nucleotide metabolic process | 120/3246 | 489/18723 | 2.81e-05 | 3.41e-04 | 120 |
| GO:000675317 | Prostate | Tumor | nucleoside phosphate metabolic process | 121/3246 | 497/18723 | 3.81e-05 | 4.41e-04 | 121 |
| GO:005105613 | Prostate | Tumor | regulation of small GTPase mediated signal transduction | 80/3246 | 302/18723 | 3.96e-05 | 4.57e-04 | 80 |
| GO:003010015 | Prostate | Tumor | regulation of endocytosis | 60/3246 | 211/18723 | 4.05e-05 | 4.62e-04 | 60 |
| GO:004639016 | Prostate | Tumor | ribose phosphate biosynthetic process | 55/3246 | 190/18723 | 4.89e-05 | 5.42e-04 | 55 |
| Page: 1 2 3 4 5 6 7 8 9 10 11 12 13 14 15 16 17 18 19 20 21 22 23 24 25 26 27 28 29 30 31 32 33 34 35 36 37 38 39 40 41 42 43 44 45 46 47 48 49 50 51 52 53 54 55 56 57 58 59 60 61 62 63 64 65 66 67 68 69 70 71 72 73 74 75 76 77 78 79 80 81 82 83 84 85 86 87 88 89 90 91 92 93 94 95 96 97 98 99 100 101 102 103 104 105 106 107 108 109 110 111 112 113 114 115 116 117 |
| Pathway ID | Tissue | Disease Stage | Description | Gene Ratio | Bg Ratio | pvalue | p.adjust | qvalue | Count |
| Page: 1 |
Top |
Cell-cell communication analysis |
| Identification of potential cell-cell interactions between two cell types and their ligand-receptor pairs for different disease states |
| Ligand | Receptor | LRpair | Pathway | Tissue | Disease Stage |
| ITGB2 | CD226 | ITGB2_CD226 | ITGB2 | Breast | ADJ |
| NECTIN2 | CD226 | NECTIN2_CD226 | NECTIN | Breast | ADJ |
| PVR | CD226 | PVR_CD226 | PVR | Breast | ADJ |
| CD70 | CD27 | CD70_CD27 | CD70 | Breast | ADJ |
| PTPRC | CD22 | PTPRC_CD22 | CD45 | Breast | DCIS |
| ITGB2 | CD226 | ITGB2_CD226 | ITGB2 | Breast | DCIS |
| NECTIN2 | CD226 | NECTIN2_CD226 | NECTIN | Breast | DCIS |
| PTPRC | CD22 | PTPRC_CD22 | CD45 | Breast | IDC |
| PTPRC | CD22 | PTPRC_CD22 | CD45 | Cervix | ADJ |
| ITGB2 | CD226 | ITGB2_CD226 | ITGB2 | Cervix | ADJ |
| NECTIN2 | CD226 | NECTIN2_CD226 | NECTIN | Cervix | ADJ |
| CD70 | CD27 | CD70_CD27 | CD70 | Cervix | ADJ |
| PTPRC | CD22 | PTPRC_CD22 | CD45 | Cervix | CC |
| ITGB2 | CD226 | ITGB2_CD226 | ITGB2 | Cervix | CC |
| NECTIN2 | CD226 | NECTIN2_CD226 | NECTIN | Cervix | CC |
| PTPRC | CD22 | PTPRC_CD22 | CD45 | Cervix | Healthy |
| PTPRC | CD22 | PTPRC_CD22 | CD45 | Cervix | Precancer |
| PTPRC | CD22 | PTPRC_CD22 | CD45 | CRC | AD |
| CD48 | CD244 | CD48_CD244A | CD48 | CRC | AD |
| PTPRC | CD22 | PTPRC_CD22 | CD45 | CRC | ADJ |
| Page: 1 |
Top |
Single-cell gene regulatory network inference analysis |
| Find out the significant the regulons (TFs) and the target genes of each regulon across cell types for different disease states |
| TF | Cell Type | Tissue | Disease Stage | Target Gene | RSS | Regulon Activity |
| ∗The dot plots of a searched regulon are shown for all cell subpopulations in each disease state of each tissue based on the regulon specific score inferred using pySCENIC and by calculating the average expression. |
| Page: 1 |
Top |
Somatic mutation of malignant transformation related genes |
| Annotation of somatic variants for genes involved in malignant transformation |
| Hugo Symbol | Variant Class | Variant Classification | dbSNP RS | HGVSc | HGVSp | HGVSp Short | SWISSPROT | BIOTYPE | SIFT | PolyPhen | Tumor Sample Barcode | Tissue | Histology | Sex | Age | Stage | Therapy Types | Drugs | Outcome |
| CD2 | SNV | Missense_Mutation | c.205N>A | p.Ala69Thr | p.A69T | P06729 | protein_coding | deleterious(0.04) | probably_damaging(0.929) | TCGA-A8-A09Z-01 | Breast | breast invasive carcinoma | Female | >=65 | I/II | Unknown | Unknown | SD | |
| CD2 | SNV | Missense_Mutation | c.150N>C | p.Met50Ile | p.M50I | P06729 | protein_coding | tolerated(0.08) | benign(0.196) | TCGA-AN-A0FJ-01 | Breast | breast invasive carcinoma | Female | <65 | III/IV | Unknown | Unknown | SD | |
| CD2 | SNV | Missense_Mutation | c.776A>C | p.Glu259Ala | p.E259A | P06729 | protein_coding | tolerated(0.06) | possibly_damaging(0.669) | TCGA-D8-A1XM-01 | Breast | breast invasive carcinoma | Female | <65 | I/II | Unknown | Unknown | SD | |
| CD2 | SNV | Missense_Mutation | novel | c.420C>G | p.Ile140Met | p.I140M | P06729 | protein_coding | tolerated(0.11) | possibly_damaging(0.687) | TCGA-DS-A1OB-01 | Cervix | cervical & endocervical cancer | Female | <65 | I/II | Chemotherapy | carboplatin | PD |
| CD2 | SNV | Missense_Mutation | c.141T>G | p.Ser47Arg | p.S47R | P06729 | protein_coding | tolerated(0.17) | benign(0.005) | TCGA-AA-A00N-01 | Colorectum | colon adenocarcinoma | Male | >=65 | I/II | Unknown | Unknown | PD | |
| CD2 | SNV | Missense_Mutation | rs769894316 | c.595G>A | p.Glu199Lys | p.E199K | P06729 | protein_coding | tolerated(0.84) | benign(0.001) | TCGA-AA-A00N-01 | Colorectum | colon adenocarcinoma | Male | >=65 | I/II | Unknown | Unknown | PD |
| CD2 | SNV | Missense_Mutation | c.67N>T | p.Val23Phe | p.V23F | P06729 | protein_coding | tolerated(0.06) | benign(0.086) | TCGA-AA-A010-01 | Colorectum | colon adenocarcinoma | Female | <65 | I/II | Chemotherapy | folinic | CR | |
| CD2 | SNV | Missense_Mutation | c.166N>A | p.Asp56Asn | p.D56N | P06729 | protein_coding | tolerated(0.09) | probably_damaging(0.927) | TCGA-CA-6717-01 | Colorectum | colon adenocarcinoma | Male | <65 | I/II | Chemotherapy | oxaliplatin | CR | |
| CD2 | SNV | Missense_Mutation | c.881N>T | p.Ser294Ile | p.S294I | P06729 | protein_coding | deleterious(0.02) | benign(0.077) | TCGA-CA-6718-01 | Colorectum | colon adenocarcinoma | Male | <65 | I/II | Unknown | Unknown | PD | |
| CD2 | SNV | Missense_Mutation | novel | c.320N>C | p.Val107Ala | p.V107A | P06729 | protein_coding | deleterious(0.05) | possibly_damaging(0.811) | TCGA-EI-6917-01 | Colorectum | rectum adenocarcinoma | Male | <65 | III/IV | Chemotherapy | 5fluorouracil+oxaciplatina+l-folinian | SD |
| Page: 1 2 3 4 |
Top |
Related drugs of malignant transformation related genes |
| Identification of chemicals and drugs interact with genes involved in malignant transfromation |
| (DGIdb 4.0) |
| Entrez ID | Symbol | Category | Interaction Types | Drug Claim Name | Drug Name | PMIDs |
| 914 | CD2 | CELL SURFACE, EXTERNAL SIDE OF PLASMA MEMBRANE, DRUGGABLE GENOME | inhibitor | 178103393 | ALEFACEPT | |
| 914 | CD2 | CELL SURFACE, EXTERNAL SIDE OF PLASMA MEMBRANE, DRUGGABLE GENOME | ALEFACEPT | ALEFACEPT | ||
| 914 | CD2 | CELL SURFACE, EXTERNAL SIDE OF PLASMA MEMBRANE, DRUGGABLE GENOME | inhibitor | CHEMBL2108742 | SIPLIZUMAB | |
| 914 | CD2 | CELL SURFACE, EXTERNAL SIDE OF PLASMA MEMBRANE, DRUGGABLE GENOME | ZNCL2 | 8131214 | ||
| 914 | CD2 | CELL SURFACE, EXTERNAL SIDE OF PLASMA MEMBRANE, DRUGGABLE GENOME | SMS 201-995 | 7628916 | ||
| 914 | CD2 | CELL SURFACE, EXTERNAL SIDE OF PLASMA MEMBRANE, DRUGGABLE GENOME | inhibitor | CHEMBL1201571 | ALEFACEPT | |
| 914 | CD2 | CELL SURFACE, EXTERNAL SIDE OF PLASMA MEMBRANE, DRUGGABLE GENOME | Siplizumab | SIPLIZUMAB | ||
| 914 | CD2 | CELL SURFACE, EXTERNAL SIDE OF PLASMA MEMBRANE, DRUGGABLE GENOME | TUMOR NECROSIS FACTOR | 1359970 | ||
| 914 | CD2 | CELL SURFACE, EXTERNAL SIDE OF PLASMA MEMBRANE, DRUGGABLE GENOME | COBALT | 8131214 | ||
| 914 | CD2 | CELL SURFACE, EXTERNAL SIDE OF PLASMA MEMBRANE, DRUGGABLE GENOME | ALEFACEPT | ALEFACEPT |
| Page: 1 2 |

Copyright 2023-Present -The University of Texas Health Science Center at Houston |