
|
|||||
|
 | |
| |
| |
| |
| |
| |
|
Gene: GK |
Gene summary for GK |
| Gene information | Species | Human | Gene symbol | GK | Gene ID | 2710 |
| Gene name | glycerol kinase | |
| Gene Alias | GK1 | |
| Cytomap | Xp21.2 | |
| Gene Type | protein-coding | GO ID | GO:0005975 | UniProtAcc | B4DH54 |
Top |
Malignant transformation analysis |
| Identification of the aberrant gene expression in precancerous and cancerous lesions by comparing the gene expression of stem-like cells in diseased tissues with normal stem cells |
| Entrez ID | Symbol | Replicates | Species | Organ | Tissue | Adj P-value | Log2FC | Malignancy |
| 2710 | GK | LZE20T | Human | Esophagus | ESCC | 2.64e-04 | 3.81e-01 | 0.0662 |
| 2710 | GK | LZE24T | Human | Esophagus | ESCC | 5.03e-06 | 1.70e-01 | 0.0596 |
| 2710 | GK | LZE21T | Human | Esophagus | ESCC | 1.01e-07 | 6.53e-01 | 0.0655 |
| 2710 | GK | LZE6T | Human | Esophagus | ESCC | 4.44e-08 | 5.59e-01 | 0.0845 |
| 2710 | GK | P1T-E | Human | Esophagus | ESCC | 2.39e-12 | 1.35e+00 | 0.0875 |
| 2710 | GK | P2T-E | Human | Esophagus | ESCC | 1.19e-09 | 2.12e-01 | 0.1177 |
| 2710 | GK | P8T-E | Human | Esophagus | ESCC | 6.50e-05 | 1.89e-01 | 0.0889 |
| 2710 | GK | P11T-E | Human | Esophagus | ESCC | 5.83e-07 | 2.10e-01 | 0.1426 |
| 2710 | GK | P12T-E | Human | Esophagus | ESCC | 4.51e-04 | 1.21e-01 | 0.1122 |
| 2710 | GK | P16T-E | Human | Esophagus | ESCC | 4.44e-10 | 2.05e-01 | 0.1153 |
| 2710 | GK | P21T-E | Human | Esophagus | ESCC | 1.34e-06 | 2.57e-01 | 0.1617 |
| 2710 | GK | P23T-E | Human | Esophagus | ESCC | 3.73e-22 | 1.20e+00 | 0.108 |
| 2710 | GK | P26T-E | Human | Esophagus | ESCC | 2.11e-09 | 2.23e-01 | 0.1276 |
| 2710 | GK | P27T-E | Human | Esophagus | ESCC | 3.44e-07 | 1.65e-01 | 0.1055 |
| 2710 | GK | P28T-E | Human | Esophagus | ESCC | 2.08e-03 | 2.04e-01 | 0.1149 |
| 2710 | GK | P37T-E | Human | Esophagus | ESCC | 1.09e-08 | 2.47e-01 | 0.1371 |
| 2710 | GK | P39T-E | Human | Esophagus | ESCC | 5.31e-08 | 2.55e-01 | 0.0894 |
| 2710 | GK | P47T-E | Human | Esophagus | ESCC | 2.16e-06 | 1.26e-01 | 0.1067 |
| 2710 | GK | P48T-E | Human | Esophagus | ESCC | 5.79e-06 | 1.28e-01 | 0.0959 |
| 2710 | GK | P52T-E | Human | Esophagus | ESCC | 4.03e-19 | 5.76e-01 | 0.1555 |
| Page: 1 2 3 |
| Tissue | Expression Dynamics | Abbreviation |
| Esophagus | 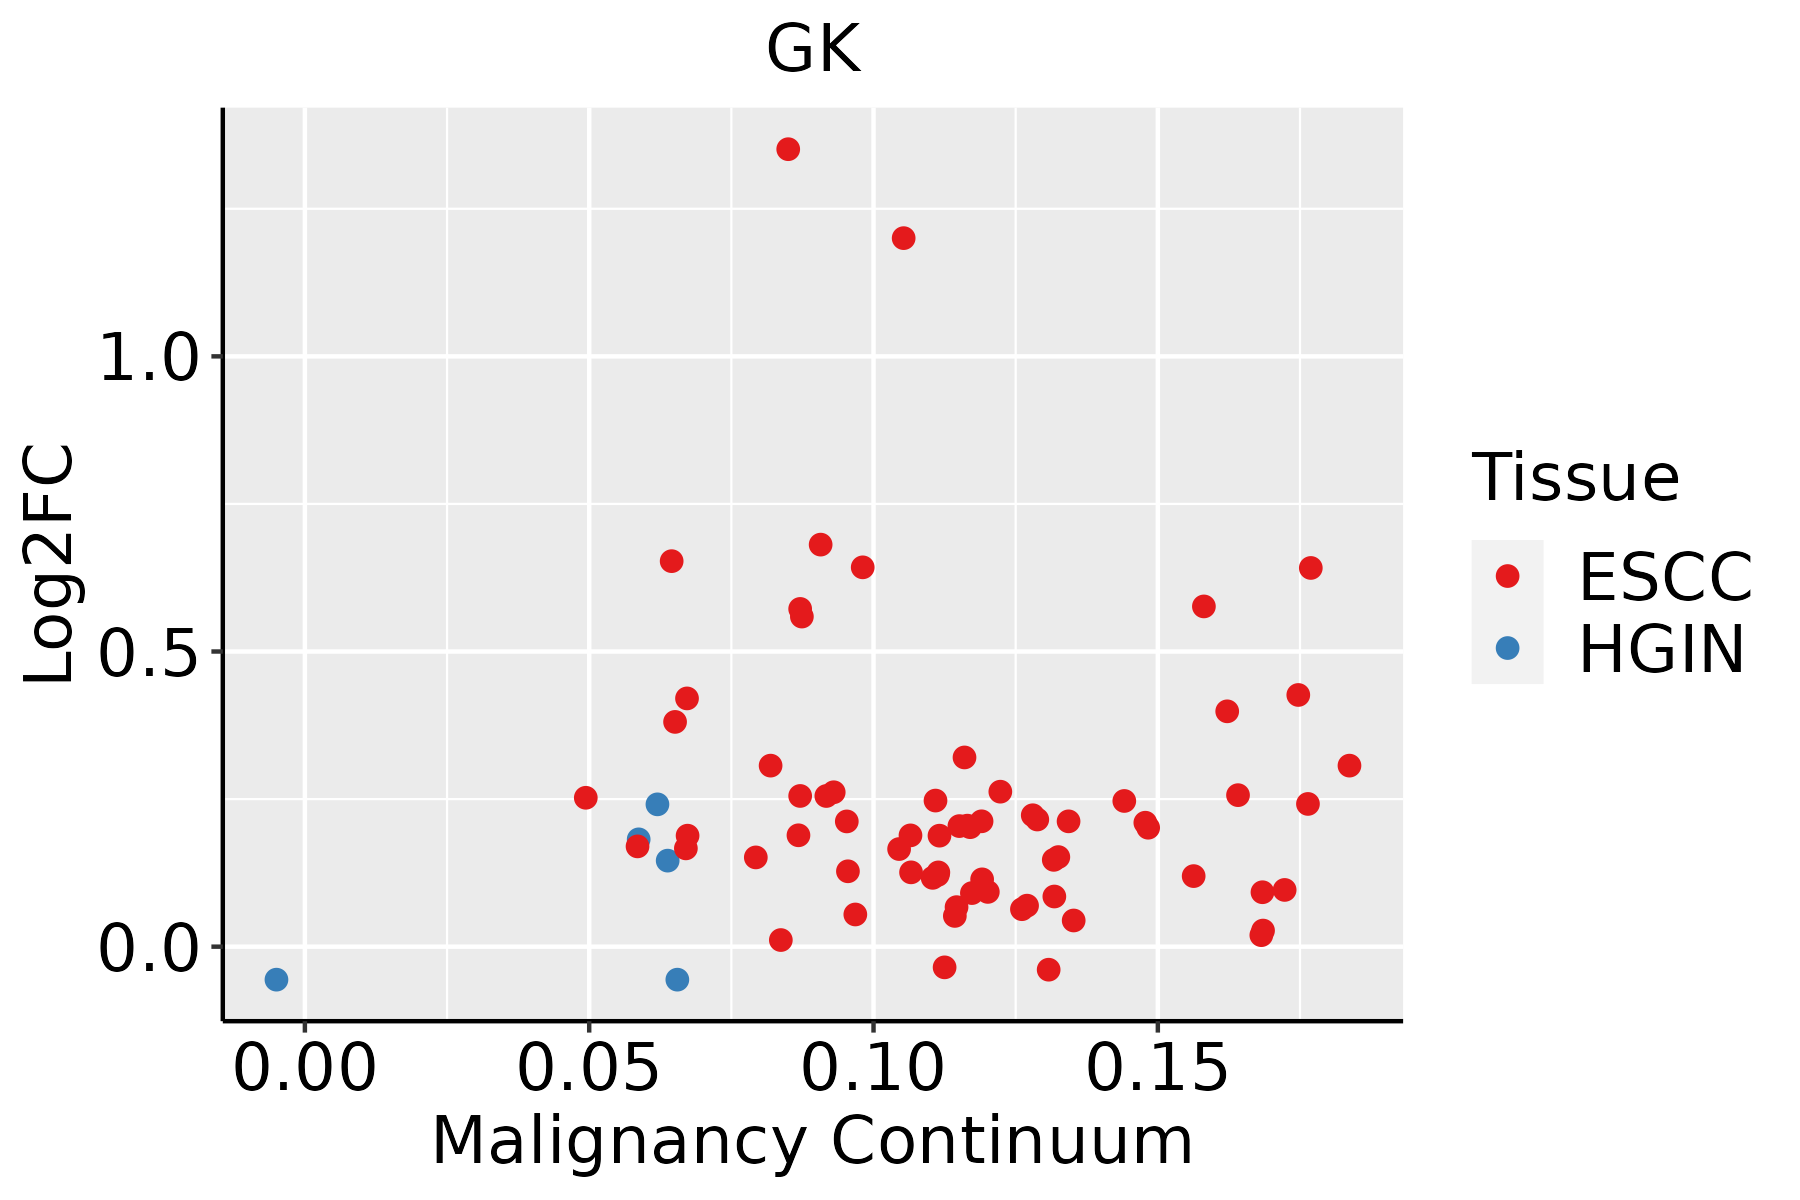 | ESCC: Esophageal squamous cell carcinoma |
| HGIN: High-grade intraepithelial neoplasias | ||
| LGIN: Low-grade intraepithelial neoplasias | ||
| GC | 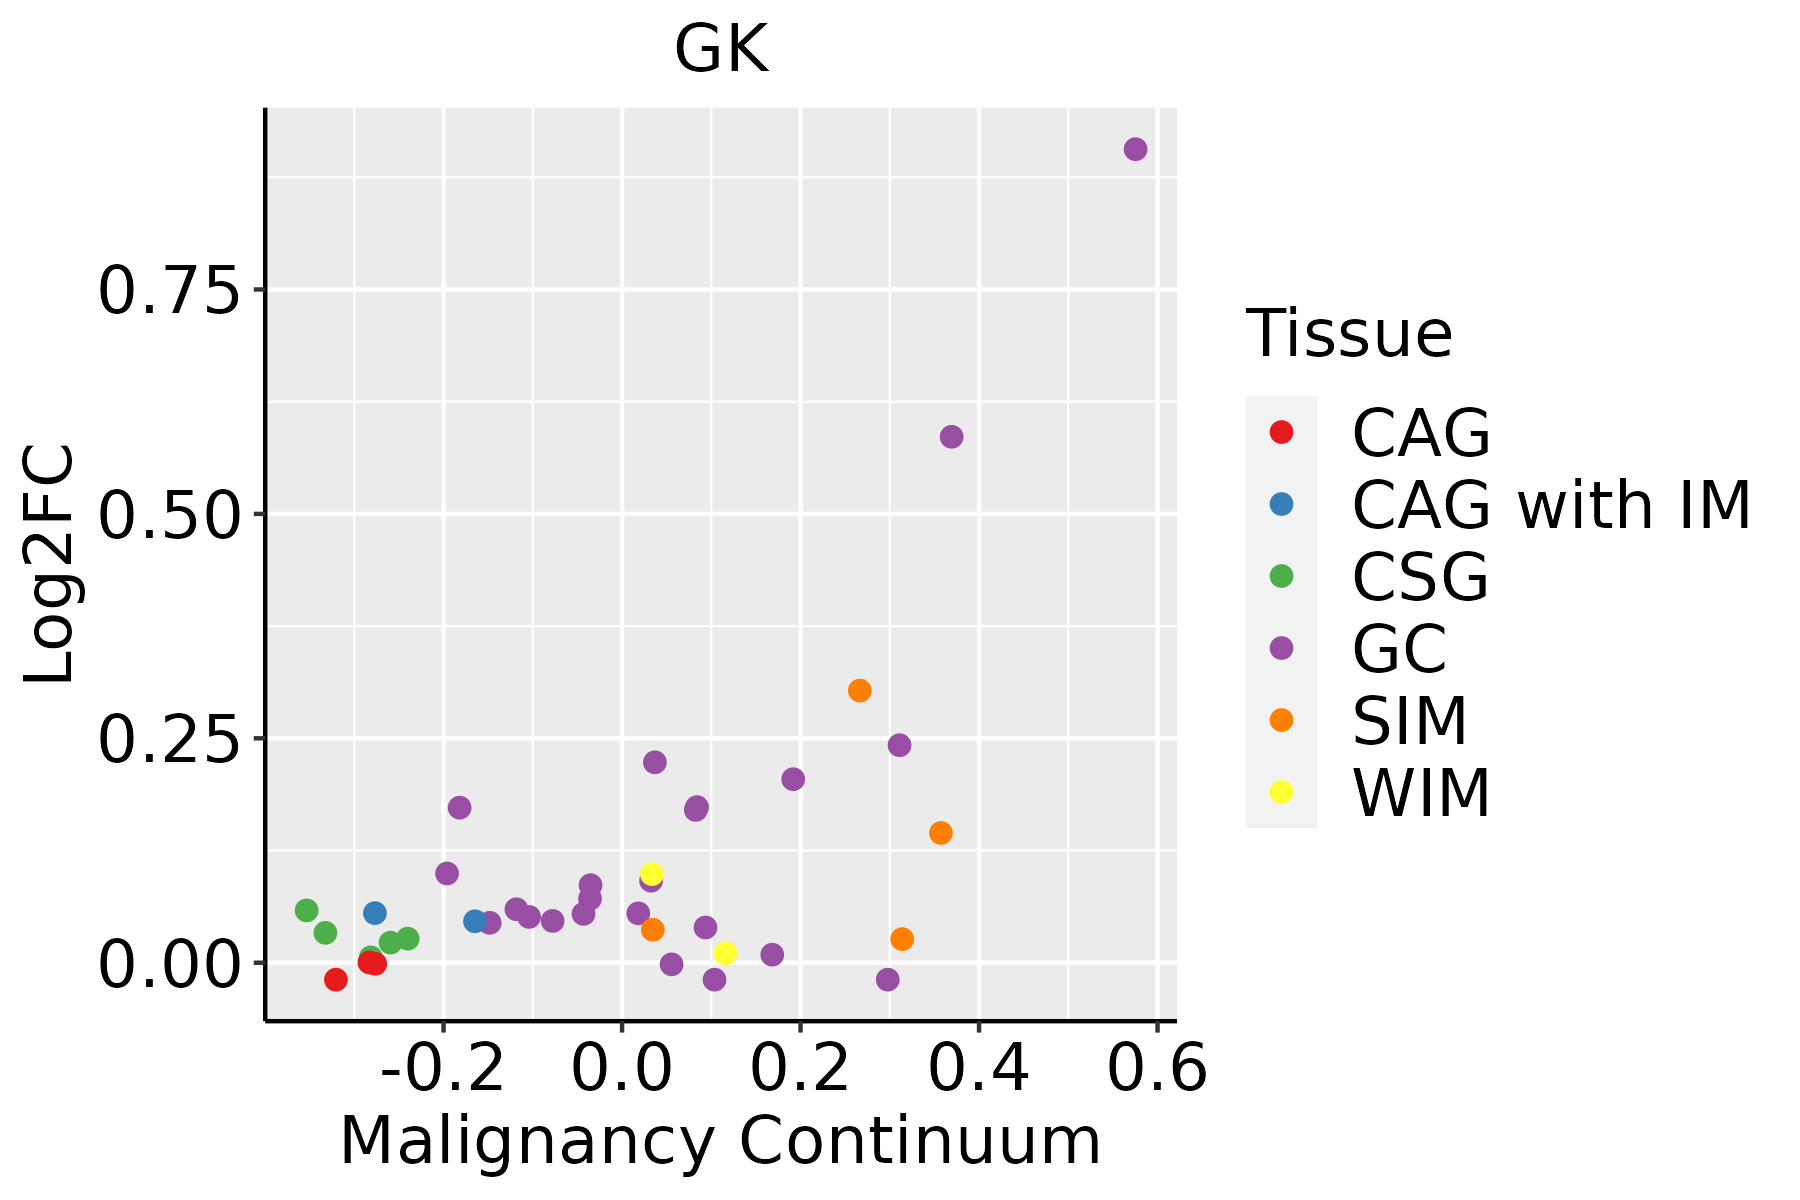 | CAG: Chronic atrophic gastritis |
| CAG with IM: Chronic atrophic gastritis with intestinal metaplasia | ||
| CSG: Chronic superficial gastritis | ||
| GC: Gastric cancer | ||
| SIM: Severe intestinal metaplasia | ||
| WIM: Wild intestinal metaplasia | ||
| Liver | 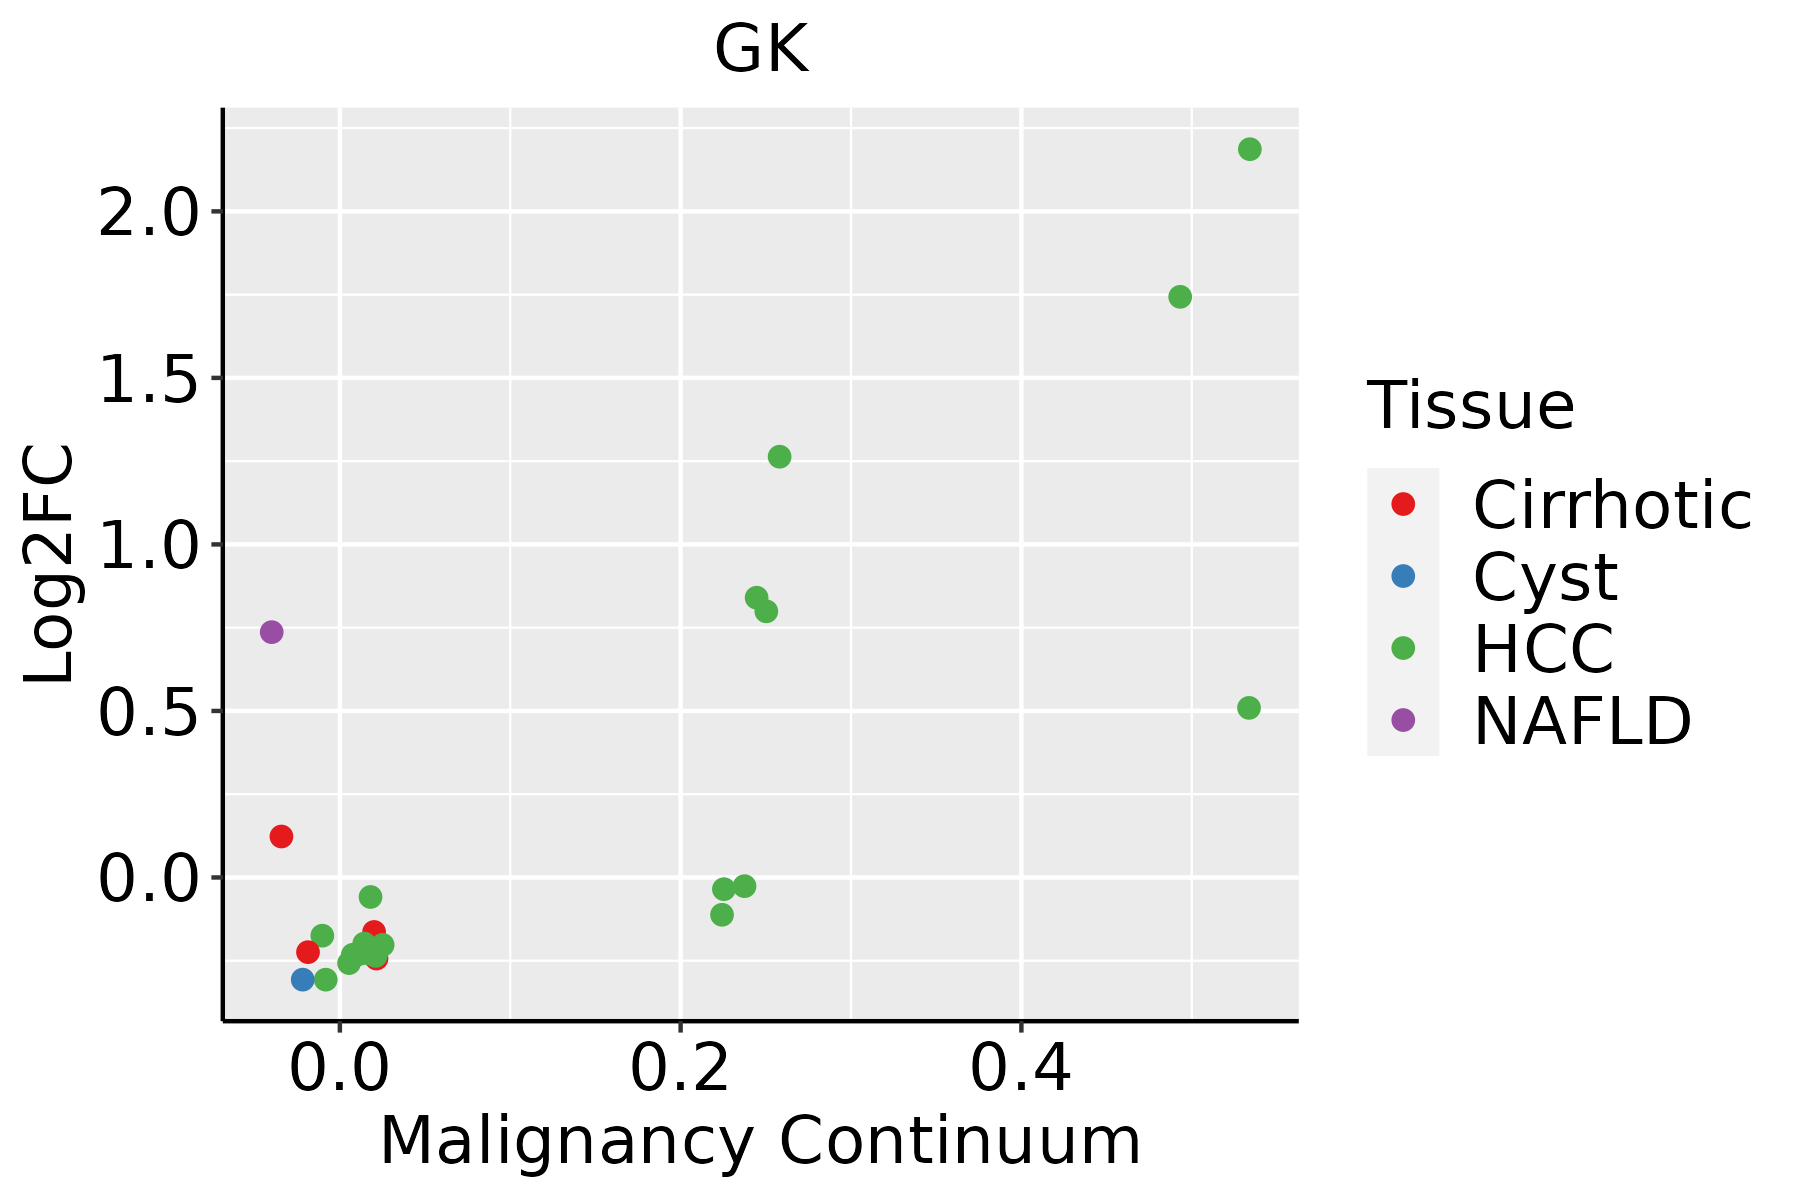 | HCC: Hepatocellular carcinoma |
| NAFLD: Non-alcoholic fatty liver disease |
| ∗log2FC in expression of this searched gene in stem-like cells from each diseased tissue sample relative to stem-like cells in normal samples in each tissue plotted against the malignancy continuum. Samples are colored based on if they are from different disease stage. |
Top |
Malignant transformation related pathway analysis |
| Find out the enriched GO biological processes and KEGG pathways involved in transition from healthy to precancer to cancer |
| Tissue | Disease Stage | Enriched GO biological Processes |
| Colorectum | AD |  |
| Colorectum | SER |  |
| Colorectum | MSS |  |
| Colorectum | MSI-H |  |
| Colorectum | FAP |  |
| ∗Top 15 enriched GO BP terms are showed in the bar plot of each disease state in each tissue. Each row represents a significant GO biological process which is colored according to the -log10(p.adjust). |
| Page: 1 2 3 4 5 6 7 8 9 |
| GO ID | Tissue | Disease Stage | Description | Gene Ratio | Bg Ratio | pvalue | p.adjust | Count |
| GO:000698618 | Prostate | BPH | response to unfolded protein | 61/3107 | 137/18723 | 1.40e-14 | 1.80e-12 | 61 |
| GO:190382918 | Prostate | BPH | positive regulation of cellular protein localization | 98/3107 | 276/18723 | 1.46e-14 | 1.84e-12 | 98 |
| GO:004586218 | Prostate | BPH | positive regulation of proteolysis | 121/3107 | 372/18723 | 2.05e-14 | 2.44e-12 | 121 |
| GO:003596618 | Prostate | BPH | response to topologically incorrect protein | 66/3107 | 159/18723 | 7.35e-14 | 7.98e-12 | 66 |
| GO:004316118 | Prostate | BPH | proteasome-mediated ubiquitin-dependent protein catabolic process | 127/3107 | 412/18723 | 3.84e-13 | 3.60e-11 | 127 |
| GO:200005818 | Prostate | BPH | regulation of ubiquitin-dependent protein catabolic process | 66/3107 | 164/18723 | 4.20e-13 | 3.88e-11 | 66 |
| GO:004854518 | Prostate | BPH | response to steroid hormone | 109/3107 | 339/18723 | 9.35e-13 | 8.15e-11 | 109 |
| GO:190305018 | Prostate | BPH | regulation of proteolysis involved in cellular protein catabolic process | 80/3107 | 221/18723 | 1.20e-12 | 1.02e-10 | 80 |
| GO:004573218 | Prostate | BPH | positive regulation of protein catabolic process | 82/3107 | 231/18723 | 2.08e-12 | 1.72e-10 | 82 |
| GO:007233118 | Prostate | BPH | signal transduction by p53 class mediator | 64/3107 | 163/18723 | 3.51e-12 | 2.82e-10 | 64 |
| GO:001604910 | Prostate | BPH | cell growth | 139/3107 | 482/18723 | 7.53e-12 | 5.90e-10 | 139 |
| GO:005254718 | Prostate | BPH | regulation of peptidase activity | 133/3107 | 461/18723 | 2.08e-11 | 1.43e-09 | 133 |
| GO:003243418 | Prostate | BPH | regulation of proteasomal ubiquitin-dependent protein catabolic process | 54/3107 | 134/18723 | 5.22e-11 | 3.29e-09 | 54 |
| GO:004206018 | Prostate | BPH | wound healing | 123/3107 | 422/18723 | 5.74e-11 | 3.59e-09 | 123 |
| GO:006113618 | Prostate | BPH | regulation of proteasomal protein catabolic process | 67/3107 | 187/18723 | 1.34e-10 | 7.74e-09 | 67 |
| GO:00709728 | Prostate | BPH | protein localization to endoplasmic reticulum | 36/3107 | 74/18723 | 1.61e-10 | 9.22e-09 | 36 |
| GO:007138316 | Prostate | BPH | cellular response to steroid hormone stimulus | 71/3107 | 204/18723 | 1.72e-10 | 9.79e-09 | 71 |
| GO:007048217 | Prostate | BPH | response to oxygen levels | 104/3107 | 347/18723 | 3.13e-10 | 1.67e-08 | 104 |
| GO:003462017 | Prostate | BPH | cellular response to unfolded protein | 42/3107 | 96/18723 | 3.43e-10 | 1.81e-08 | 42 |
| GO:005110118 | Prostate | BPH | regulation of DNA binding | 48/3107 | 118/18723 | 4.13e-10 | 2.15e-08 | 48 |
| Page: 1 2 3 4 5 6 7 8 9 10 11 12 13 14 15 16 17 18 19 20 21 22 23 24 25 26 27 28 29 30 31 32 33 34 35 36 37 38 39 40 41 42 43 44 45 46 47 48 49 50 51 52 53 54 55 56 57 58 59 60 61 62 63 64 65 66 67 68 69 70 71 72 73 74 75 76 77 78 79 80 81 82 83 84 85 86 87 88 89 90 91 92 93 94 95 96 97 98 99 100 101 102 103 104 105 106 107 108 109 110 111 112 113 114 115 116 117 118 119 120 121 122 123 124 125 126 |
| Pathway ID | Tissue | Disease Stage | Description | Gene Ratio | Bg Ratio | pvalue | p.adjust | qvalue | Count |
| hsa033206 | Liver | NAFLD | PPAR signaling pathway | 25/1043 | 75/8465 | 1.61e-06 | 6.62e-05 | 5.33e-05 | 25 |
| hsa0332011 | Liver | NAFLD | PPAR signaling pathway | 25/1043 | 75/8465 | 1.61e-06 | 6.62e-05 | 5.33e-05 | 25 |
| hsa0332021 | Liver | Cirrhotic | PPAR signaling pathway | 32/2530 | 75/8465 | 1.24e-02 | 3.92e-02 | 2.42e-02 | 32 |
| hsa0332031 | Liver | Cirrhotic | PPAR signaling pathway | 32/2530 | 75/8465 | 1.24e-02 | 3.92e-02 | 2.42e-02 | 32 |
| hsa033204 | Liver | HCC | PPAR signaling pathway | 48/4020 | 75/8465 | 2.83e-03 | 9.37e-03 | 5.21e-03 | 48 |
| hsa005615 | Liver | HCC | Glycerolipid metabolism | 41/4020 | 63/8465 | 3.59e-03 | 1.12e-02 | 6.22e-03 | 41 |
| hsa033205 | Liver | HCC | PPAR signaling pathway | 48/4020 | 75/8465 | 2.83e-03 | 9.37e-03 | 5.21e-03 | 48 |
| hsa0056112 | Liver | HCC | Glycerolipid metabolism | 41/4020 | 63/8465 | 3.59e-03 | 1.12e-02 | 6.22e-03 | 41 |
| hsa03320 | Stomach | GC | PPAR signaling pathway | 18/708 | 75/8465 | 3.26e-05 | 4.01e-04 | 2.82e-04 | 18 |
| hsa005614 | Stomach | GC | Glycerolipid metabolism | 12/708 | 63/8465 | 5.36e-03 | 3.01e-02 | 2.12e-02 | 12 |
| hsa033201 | Stomach | GC | PPAR signaling pathway | 18/708 | 75/8465 | 3.26e-05 | 4.01e-04 | 2.82e-04 | 18 |
| hsa0056111 | Stomach | GC | Glycerolipid metabolism | 12/708 | 63/8465 | 5.36e-03 | 3.01e-02 | 2.12e-02 | 12 |
| Page: 1 |
Top |
Cell-cell communication analysis |
| Identification of potential cell-cell interactions between two cell types and their ligand-receptor pairs for different disease states |
| Ligand | Receptor | LRpair | Pathway | Tissue | Disease Stage |
| Page: 1 |
Top |
Single-cell gene regulatory network inference analysis |
| Find out the significant the regulons (TFs) and the target genes of each regulon across cell types for different disease states |
| TF | Cell Type | Tissue | Disease Stage | Target Gene | RSS | Regulon Activity |
| ∗The dot plots of a searched regulon are shown for all cell subpopulations in each disease state of each tissue based on the regulon specific score inferred using pySCENIC and by calculating the average expression. |
| Page: 1 |
Top |
Somatic mutation of malignant transformation related genes |
| Annotation of somatic variants for genes involved in malignant transformation |
| Hugo Symbol | Variant Class | Variant Classification | dbSNP RS | HGVSc | HGVSp | HGVSp Short | SWISSPROT | BIOTYPE | SIFT | PolyPhen | Tumor Sample Barcode | Tissue | Histology | Sex | Age | Stage | Therapy Types | Drugs | Outcome |
| GK | SNV | Missense_Mutation | c.65C>T | p.Ser22Leu | p.S22L | P32189 | protein_coding | deleterious(0) | possibly_damaging(0.874) | TCGA-AN-A046-01 | Breast | breast invasive carcinoma | Female | >=65 | I/II | Unknown | Unknown | SD | |
| GK | SNV | Missense_Mutation | rs772353152 | c.1256G>A | p.Arg419Gln | p.R419Q | P32189 | protein_coding | tolerated(0.32) | benign(0.003) | TCGA-AN-A046-01 | Breast | breast invasive carcinoma | Female | >=65 | I/II | Unknown | Unknown | SD |
| GK | SNV | Missense_Mutation | c.11C>T | p.Ser4Leu | p.S4L | P32189 | protein_coding | tolerated(0.14) | benign(0.012) | TCGA-BH-A209-01 | Breast | breast invasive carcinoma | Female | >=65 | I/II | Unknown | Unknown | SD | |
| GK | SNV | Missense_Mutation | novel | c.1423G>C | p.Val475Leu | p.V475L | P32189 | protein_coding | tolerated(0.07) | benign(0.075) | TCGA-BH-A6R8-01 | Breast | breast invasive carcinoma | Female | <65 | I/II | Unknown | Unknown | SD |
| GK | SNV | Missense_Mutation | novel | c.772C>G | p.Pro258Ala | p.P258A | P32189 | protein_coding | deleterious(0.02) | probably_damaging(0.981) | TCGA-C5-A8XI-01 | Cervix | cervical & endocervical cancer | Female | >=65 | I/II | Chemotherapy | cisplatin | SD |
| GK | SNV | Missense_Mutation | rs757334363 | c.1403N>T | p.Ala468Val | p.A468V | P32189 | protein_coding | tolerated(0.06) | benign(0.287) | TCGA-VS-A8QA-01 | Cervix | cervical & endocervical cancer | Female | <65 | I/II | Unknown | Unknown | SD |
| GK | SNV | Missense_Mutation | c.1654G>T | p.Ala552Ser | p.A552S | P32189 | protein_coding | tolerated(0.19) | probably_damaging(0.997) | TCGA-A6-5661-01 | Colorectum | colon adenocarcinoma | Female | >=65 | I/II | Unknown | Unknown | SD | |
| GK | SNV | Missense_Mutation | c.1258N>T | p.Asp420Tyr | p.D420Y | P32189 | protein_coding | deleterious(0) | probably_damaging(1) | TCGA-AA-A010-01 | Colorectum | colon adenocarcinoma | Female | <65 | I/II | Chemotherapy | folinic | CR | |
| GK | SNV | Missense_Mutation | c.1527G>T | p.Trp509Cys | p.W509C | P32189 | protein_coding | deleterious(0) | probably_damaging(1) | TCGA-G4-6321-01 | Colorectum | colon adenocarcinoma | Female | <65 | III/IV | Chemotherapy | fluorouracil | SD | |
| GK | SNV | Missense_Mutation | c.1651G>A | p.Gly551Arg | p.G551R | P32189 | protein_coding | tolerated(0.35) | probably_damaging(0.99) | TCGA-NH-A5IV-01 | Colorectum | colon adenocarcinoma | Female | >=65 | I/II | Unknown | Unknown | SD |
| Page: 1 2 3 4 5 6 7 8 9 |
Top |
Related drugs of malignant transformation related genes |
| Identification of chemicals and drugs interact with genes involved in malignant transfromation |
| (DGIdb 4.0) |
| Entrez ID | Symbol | Category | Interaction Types | Drug Claim Name | Drug Name | PMIDs |
| Page: 1 |

Copyright 2023-Present -The University of Texas Health Science Center at Houston |