
|
|||||
|
 | |
| |
| |
| |
| |
| |
|
Gene: TMSB4X |
Gene summary for TMSB4X |
| Gene information | Species | Human | Gene symbol | TMSB4X | Gene ID | 7114 |
| Gene name | thymosin beta 4 X-linked | |
| Gene Alias | FX | |
| Cytomap | Xp22.2 | |
| Gene Type | protein-coding | GO ID | GO:0001667 | UniProtAcc | A2VCK8 |
Top |
Malignant transformation analysis |
| Identification of the aberrant gene expression in precancerous and cancerous lesions by comparing the gene expression of stem-like cells in diseased tissues with normal stem cells |
| Entrez ID | Symbol | Replicates | Species | Organ | Tissue | Adj P-value | Log2FC | Malignancy |
| 7114 | TMSB4X | GSM4909281 | Human | Breast | IDC | 5.58e-08 | 2.93e-01 | 0.21 |
| 7114 | TMSB4X | GSM4909282 | Human | Breast | IDC | 1.17e-28 | 4.43e-01 | -0.0288 |
| 7114 | TMSB4X | GSM4909285 | Human | Breast | IDC | 7.11e-22 | -3.45e-01 | 0.21 |
| 7114 | TMSB4X | GSM4909286 | Human | Breast | IDC | 3.17e-23 | -6.68e-01 | 0.1081 |
| 7114 | TMSB4X | GSM4909291 | Human | Breast | IDC | 1.25e-23 | 5.46e-01 | 0.1753 |
| 7114 | TMSB4X | GSM4909293 | Human | Breast | IDC | 3.79e-08 | -1.84e-01 | 0.1581 |
| 7114 | TMSB4X | GSM4909294 | Human | Breast | IDC | 1.24e-07 | 2.95e-01 | 0.2022 |
| 7114 | TMSB4X | GSM4909295 | Human | Breast | IDC | 3.55e-05 | 3.83e-01 | 0.0898 |
| 7114 | TMSB4X | GSM4909296 | Human | Breast | IDC | 1.02e-13 | 3.98e-01 | 0.1524 |
| 7114 | TMSB4X | GSM4909297 | Human | Breast | IDC | 1.72e-27 | 4.79e-01 | 0.1517 |
| 7114 | TMSB4X | GSM4909298 | Human | Breast | IDC | 9.80e-15 | 3.01e-01 | 0.1551 |
| 7114 | TMSB4X | GSM4909301 | Human | Breast | IDC | 4.06e-08 | 2.48e-01 | 0.1577 |
| 7114 | TMSB4X | GSM4909302 | Human | Breast | IDC | 1.90e-65 | 6.81e-01 | 0.1545 |
| 7114 | TMSB4X | GSM4909304 | Human | Breast | IDC | 1.17e-20 | -3.26e-01 | 0.1636 |
| 7114 | TMSB4X | GSM4909305 | Human | Breast | IDC | 2.25e-04 | 2.51e-01 | 0.0436 |
| 7114 | TMSB4X | GSM4909306 | Human | Breast | IDC | 1.90e-17 | 3.81e-01 | 0.1564 |
| 7114 | TMSB4X | GSM4909307 | Human | Breast | IDC | 1.09e-54 | 6.29e-01 | 0.1569 |
| 7114 | TMSB4X | GSM4909308 | Human | Breast | IDC | 7.20e-54 | 6.29e-01 | 0.158 |
| 7114 | TMSB4X | GSM4909311 | Human | Breast | IDC | 4.55e-02 | -1.98e-01 | 0.1534 |
| 7114 | TMSB4X | GSM4909312 | Human | Breast | IDC | 3.29e-02 | -2.80e-01 | 0.1552 |
| Page: 1 2 3 4 5 6 7 8 9 10 11 12 13 14 15 16 17 18 19 20 21 22 |
| Tissue | Expression Dynamics | Abbreviation |
| Breast | 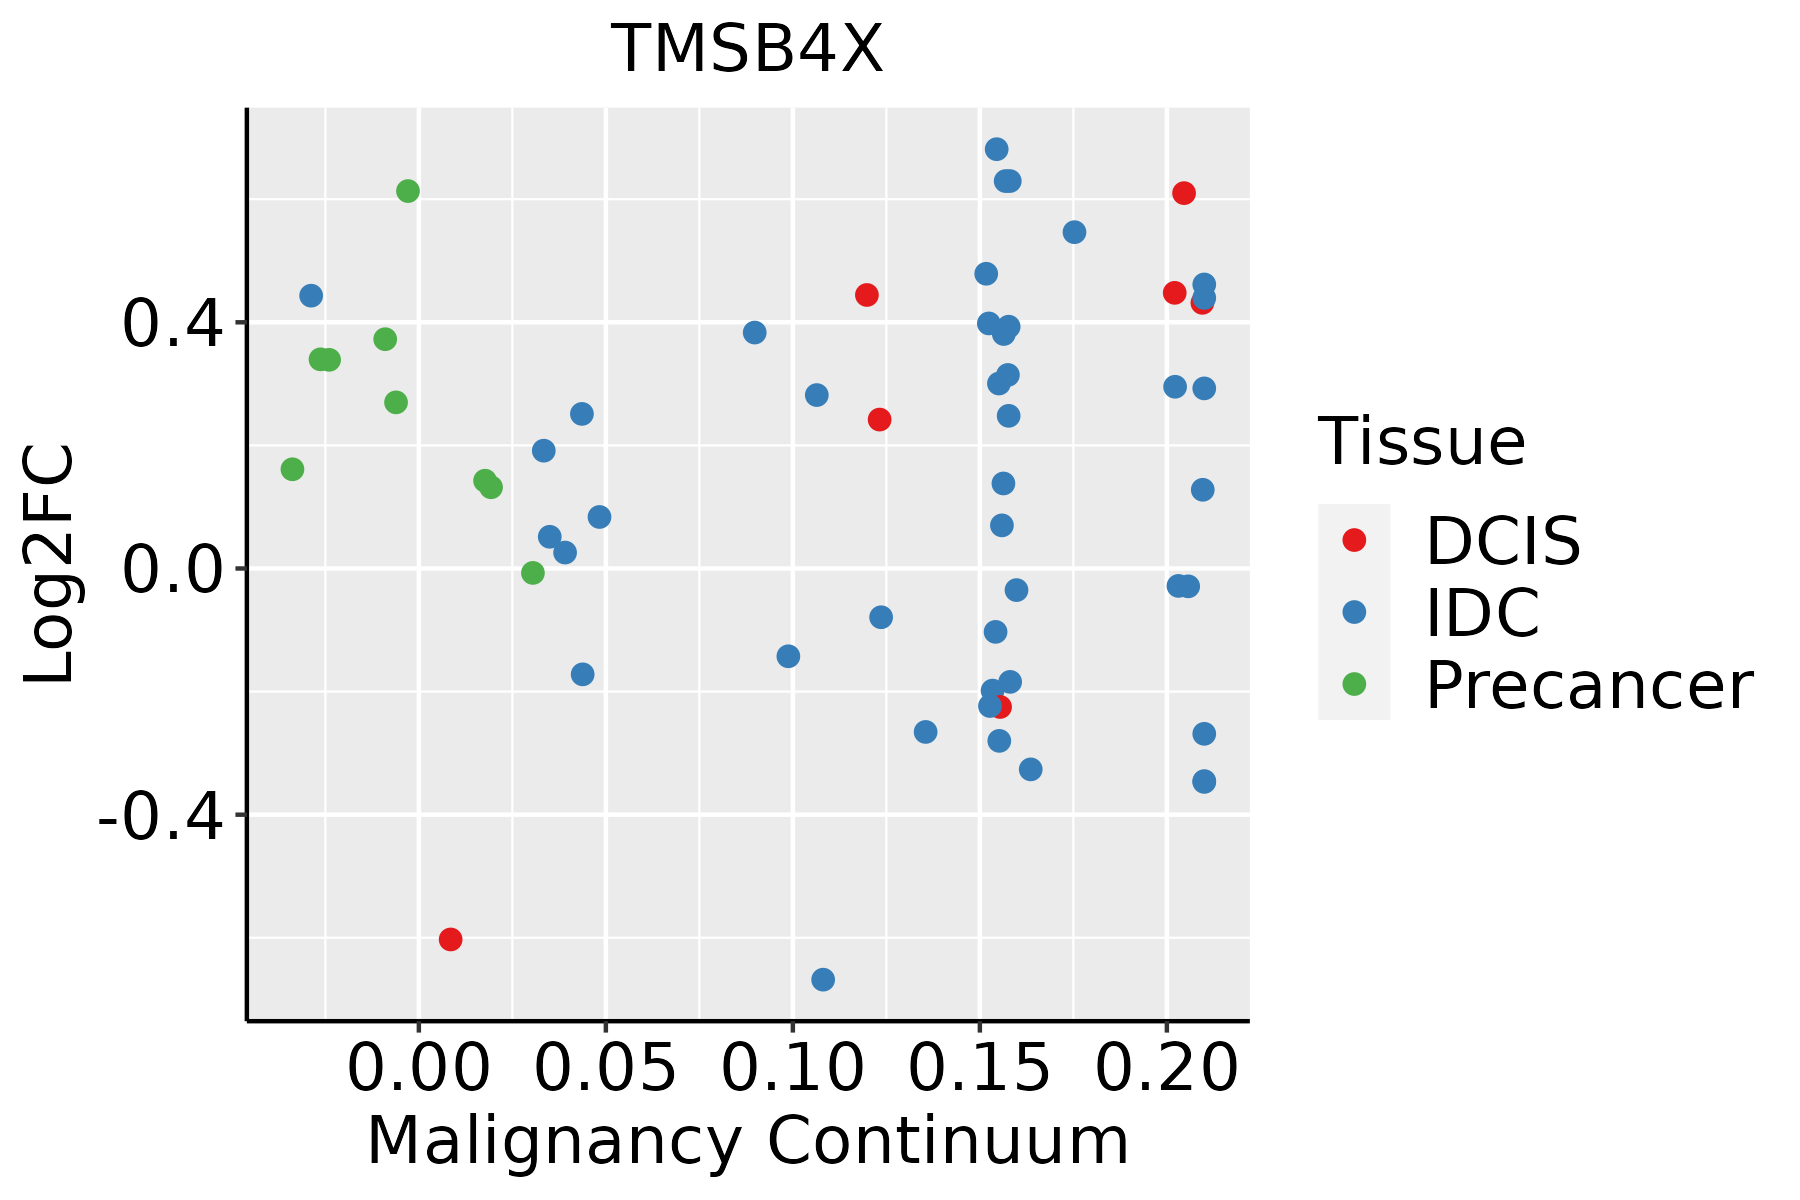 | IDC: Invasive ductal carcinoma |
| DCIS: Ductal carcinoma in situ | ||
| Precancer(BRCA1-mut): Precancerous lesion from BRCA1 mutation carriers | ||
| Cervix |  | CC: Cervix cancer |
| HSIL_HPV: HPV-infected high-grade squamous intraepithelial lesions | ||
| N_HPV: HPV-infected normal cervix | ||
| Colorectum (GSE201348) |  | FAP: Familial adenomatous polyposis |
| CRC: Colorectal cancer | ||
| Colorectum (HTA11) |  | AD: Adenomas |
| SER: Sessile serrated lesions | ||
| MSI-H: Microsatellite-high colorectal cancer | ||
| MSS: Microsatellite stable colorectal cancer | ||
| Endometrium |  | AEH: Atypical endometrial hyperplasia |
| EEC: Endometrioid Cancer | ||
| Esophagus | 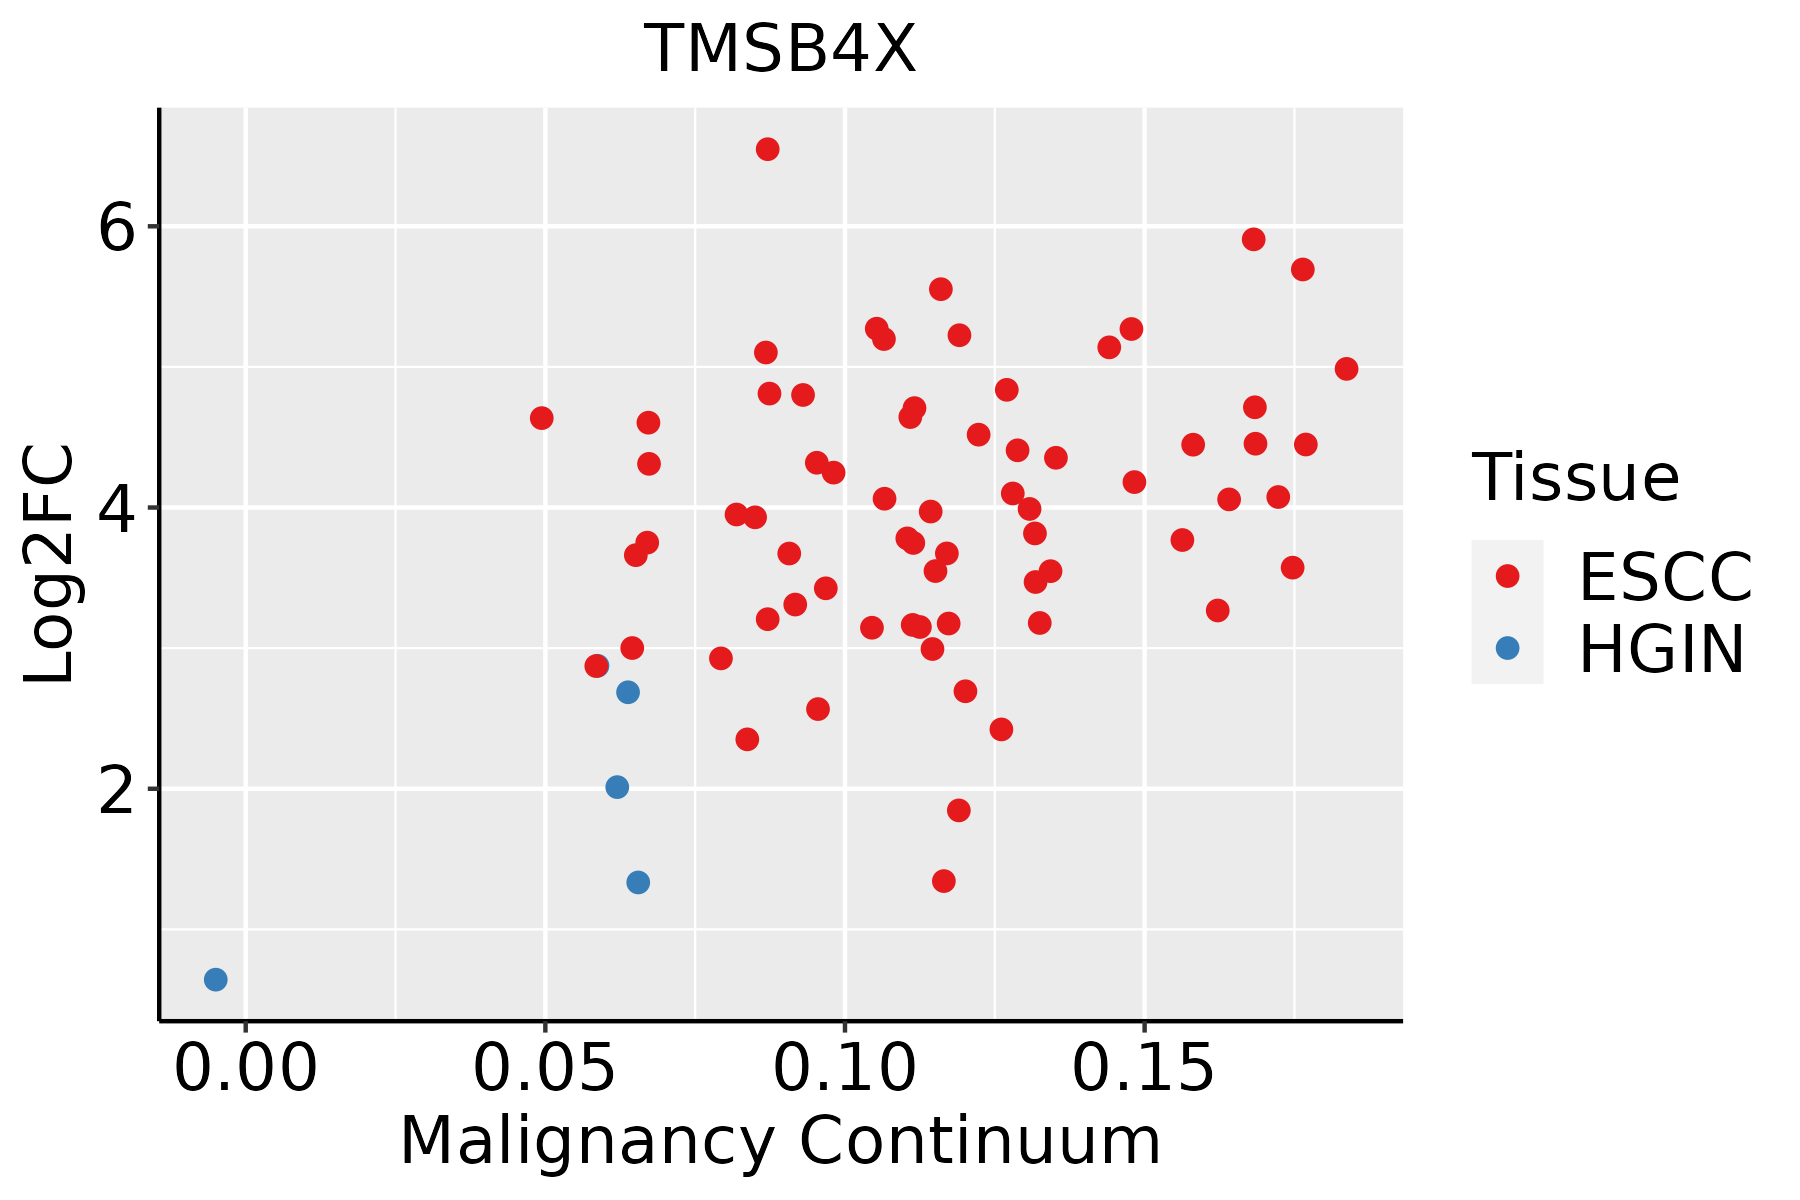 | ESCC: Esophageal squamous cell carcinoma |
| HGIN: High-grade intraepithelial neoplasias | ||
| LGIN: Low-grade intraepithelial neoplasias | ||
| GC |  | CAG: Chronic atrophic gastritis |
| CAG with IM: Chronic atrophic gastritis with intestinal metaplasia | ||
| CSG: Chronic superficial gastritis | ||
| GC: Gastric cancer | ||
| SIM: Severe intestinal metaplasia | ||
| WIM: Wild intestinal metaplasia | ||
| Liver |  | HCC: Hepatocellular carcinoma |
| NAFLD: Non-alcoholic fatty liver disease | ||
| Lung | 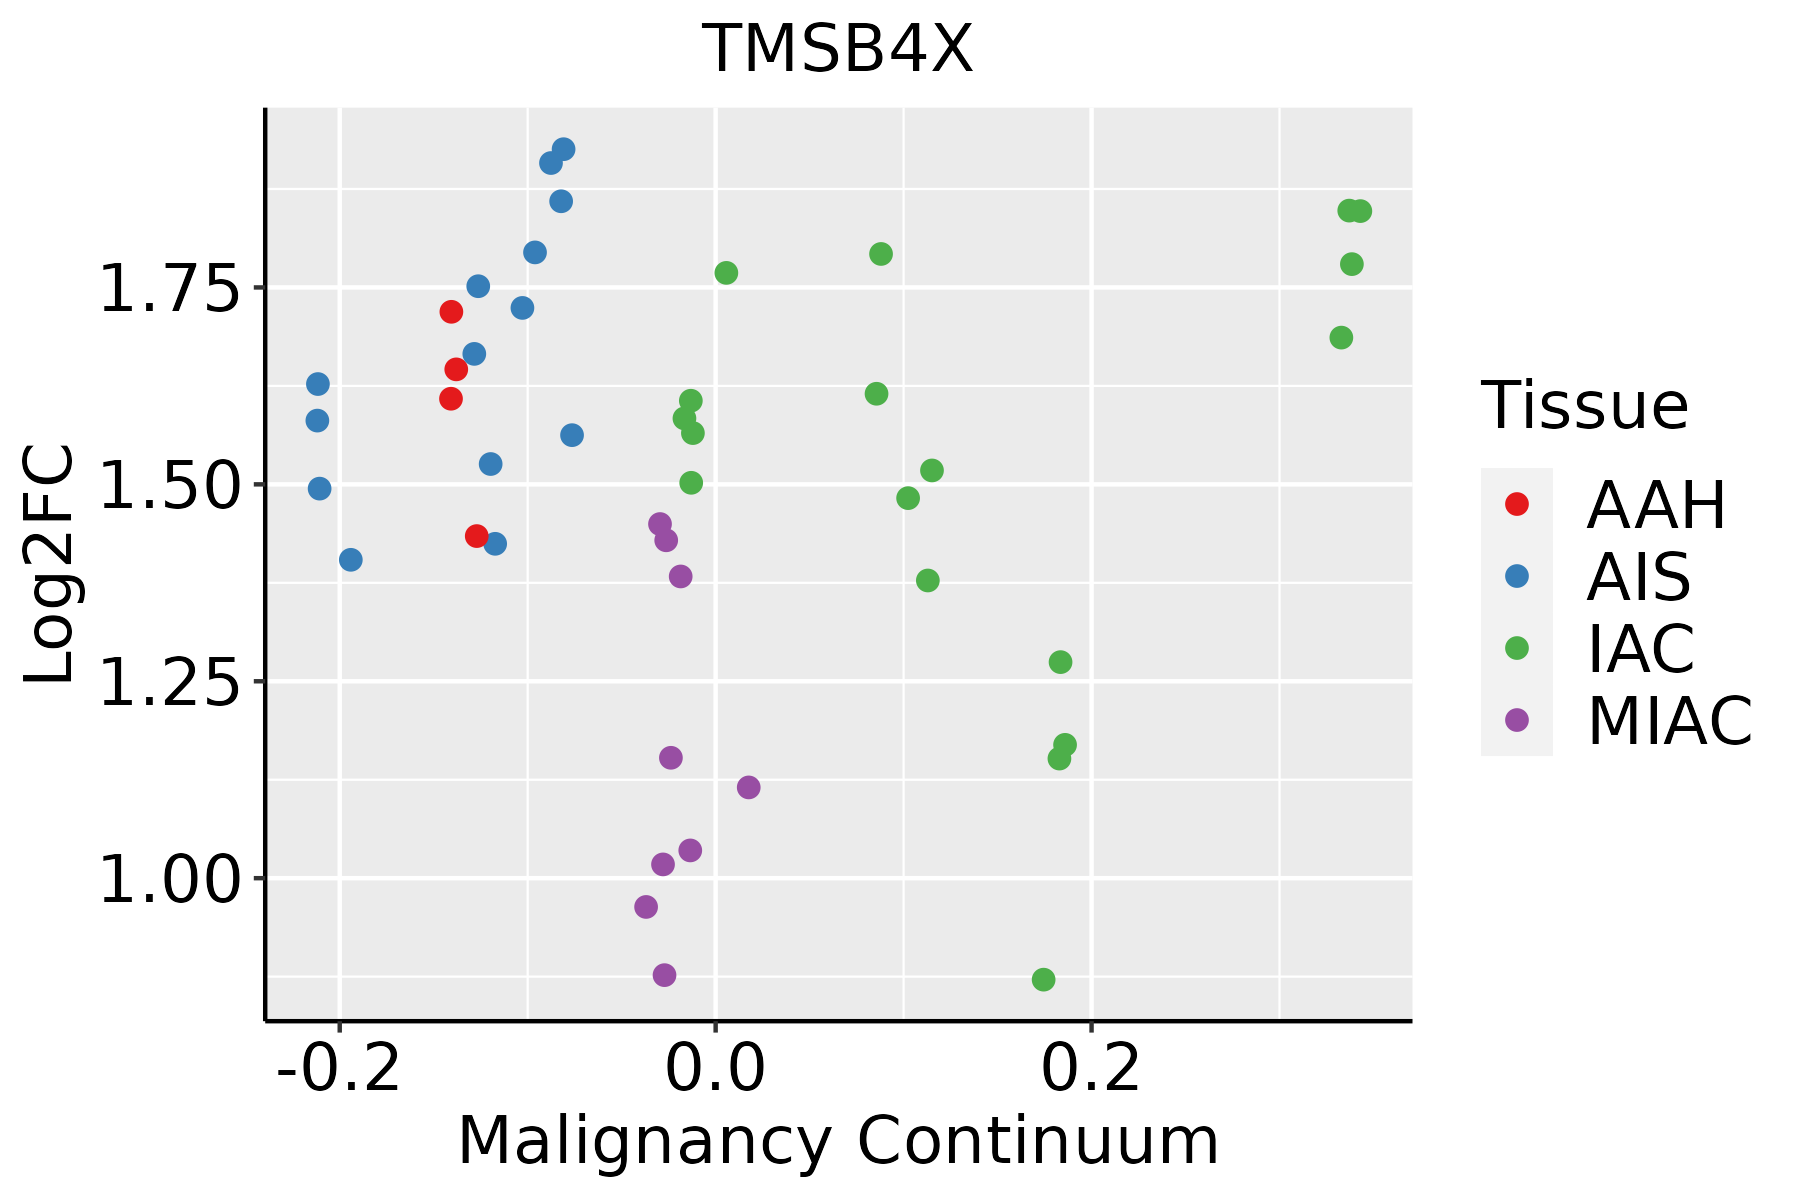 | AAH: Atypical adenomatous hyperplasia |
| AIS: Adenocarcinoma in situ | ||
| IAC: Invasive lung adenocarcinoma | ||
| MIA: Minimally invasive adenocarcinoma | ||
| Oral Cavity |  | EOLP: Erosive Oral lichen planus |
| LP: leukoplakia | ||
| NEOLP: Non-erosive oral lichen planus | ||
| OSCC: Oral squamous cell carcinoma | ||
| Prostate |  | BPH: Benign Prostatic Hyperplasia |
| Skin |  | AK: Actinic keratosis |
| cSCC: Cutaneous squamous cell carcinoma | ||
| SCCIS:squamous cell carcinoma in situ | ||
| Thyroid | 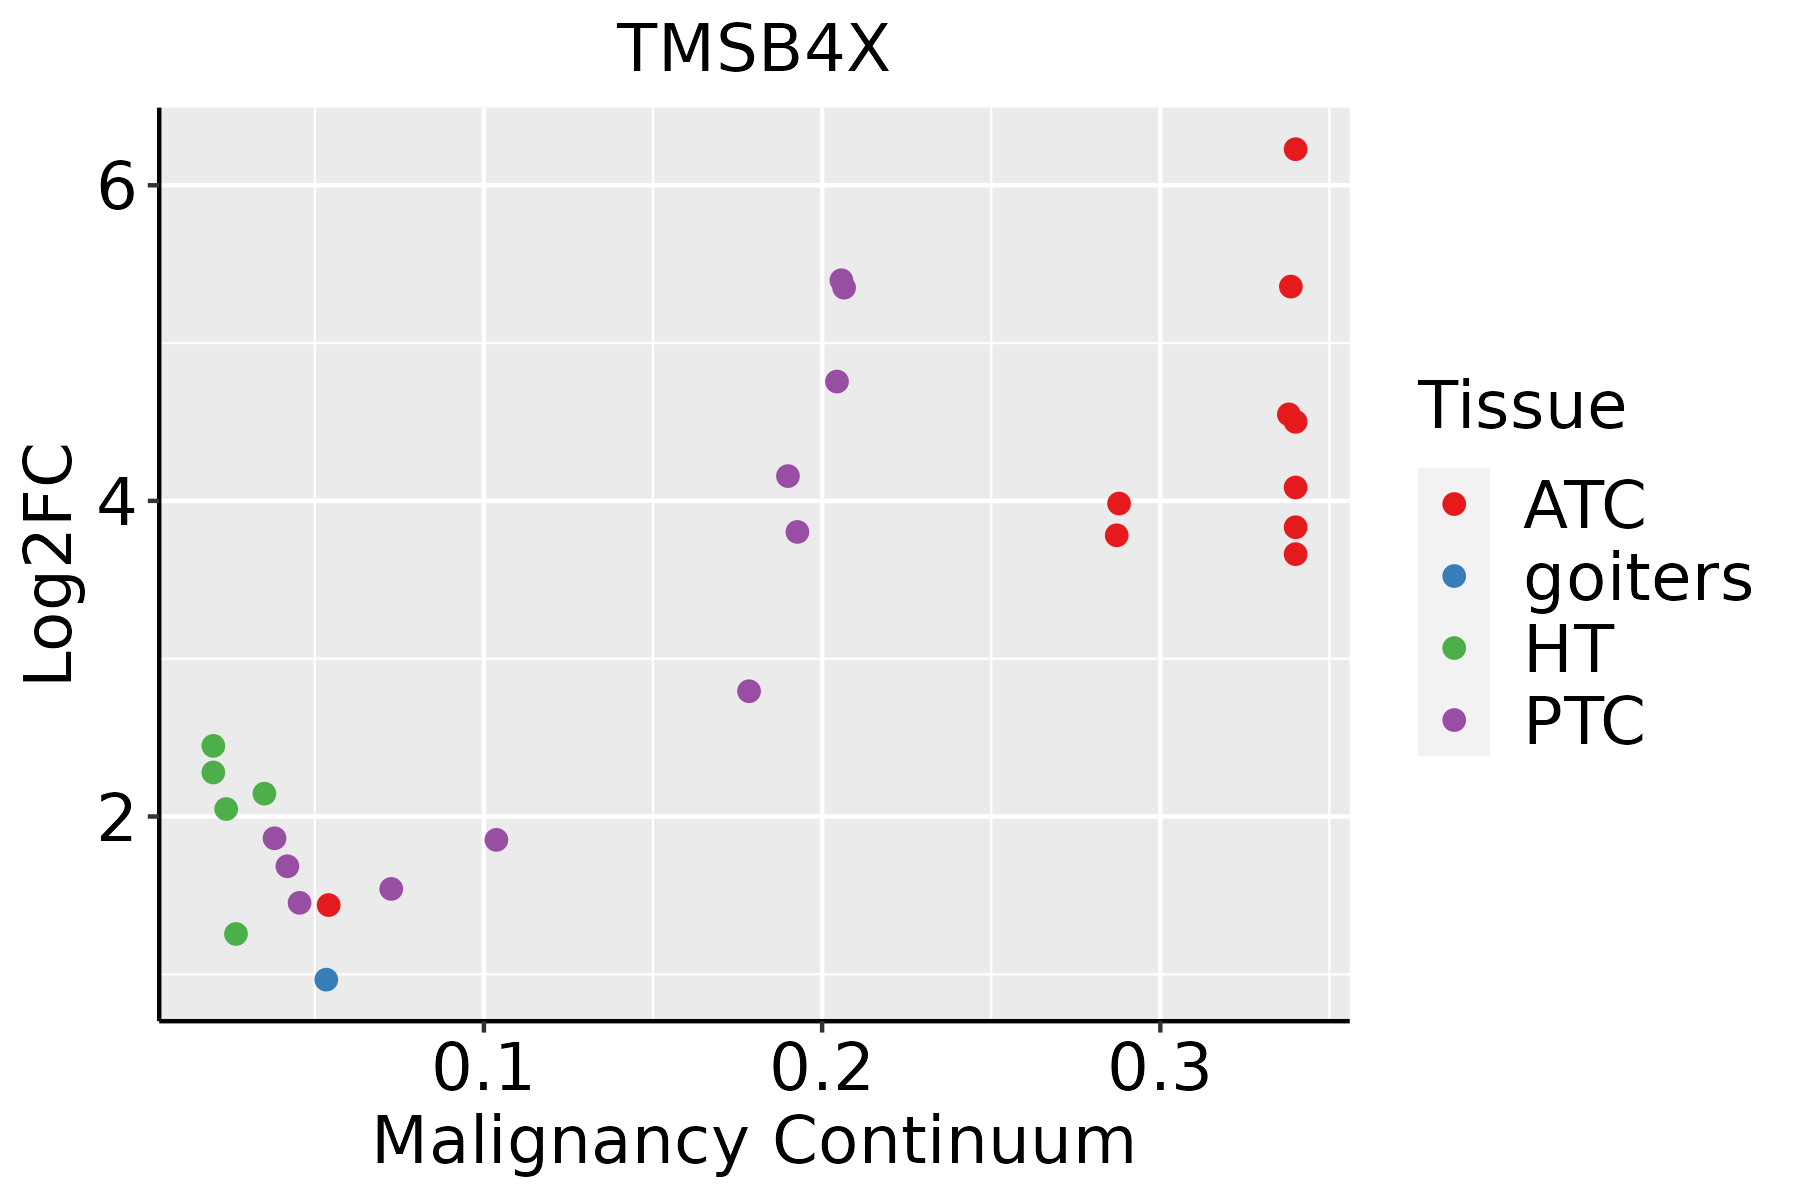 | ATC: Anaplastic thyroid cancer |
| HT: Hashimoto's thyroiditis | ||
| PTC: Papillary thyroid cancer |
| ∗log2FC in expression of this searched gene in stem-like cells from each diseased tissue sample relative to stem-like cells in normal samples in each tissue plotted against the malignancy continuum. Samples are colored based on if they are from different disease stage. |
Top |
Malignant transformation related pathway analysis |
| Find out the enriched GO biological processes and KEGG pathways involved in transition from healthy to precancer to cancer |
| Tissue | Disease Stage | Enriched GO biological Processes |
| Colorectum | AD |  |
| Colorectum | SER |  |
| Colorectum | MSS |  |
| Colorectum | MSI-H |  |
| Colorectum | FAP |  |
| ∗Top 15 enriched GO BP terms are showed in the bar plot of each disease state in each tissue. Each row represents a significant GO biological process which is colored according to the -log10(p.adjust). |
| Page: 1 2 3 4 5 6 7 8 9 |
| GO ID | Tissue | Disease Stage | Description | Gene Ratio | Bg Ratio | pvalue | p.adjust | Count |
| GO:00433923 | Prostate | BPH | negative regulation of DNA binding | 18/3107 | 52/18723 | 1.22e-03 | 7.41e-03 | 18 |
| GO:00091657 | Prostate | BPH | nucleotide biosynthetic process | 60/3107 | 254/18723 | 2.34e-03 | 1.28e-02 | 60 |
| GO:19012937 | Prostate | BPH | nucleoside phosphate biosynthetic process | 60/3107 | 256/18723 | 2.83e-03 | 1.49e-02 | 60 |
| GO:003083710 | Prostate | BPH | negative regulation of actin filament polymerization | 20/3107 | 65/18723 | 3.36e-03 | 1.73e-02 | 20 |
| GO:19005426 | Prostate | BPH | regulation of purine nucleotide metabolic process | 24/3107 | 84/18723 | 4.13e-03 | 2.04e-02 | 24 |
| GO:00435343 | Prostate | BPH | blood vessel endothelial cell migration | 43/3107 | 176/18723 | 4.79e-03 | 2.29e-02 | 43 |
| GO:00435363 | Prostate | BPH | positive regulation of blood vessel endothelial cell migration | 22/3107 | 76/18723 | 4.96e-03 | 2.34e-02 | 22 |
| GO:00061405 | Prostate | BPH | regulation of nucleotide metabolic process | 24/3107 | 86/18723 | 5.71e-03 | 2.65e-02 | 24 |
| GO:19035807 | Prostate | BPH | positive regulation of ATP metabolic process | 13/3107 | 38/18723 | 6.29e-03 | 2.88e-02 | 13 |
| GO:20010283 | Prostate | BPH | positive regulation of endothelial cell chemotaxis | 7/3107 | 15/18723 | 6.42e-03 | 2.91e-02 | 7 |
| GO:00509215 | Prostate | BPH | positive regulation of chemotaxis | 35/3107 | 141/18723 | 7.89e-03 | 3.45e-02 | 35 |
| GO:2000678 | Prostate | BPH | negative regulation of transcription regulatory region DNA binding | 8/3107 | 20/18723 | 1.09e-02 | 4.50e-02 | 8 |
| GO:004603419 | Prostate | Tumor | ATP metabolic process | 122/3246 | 277/18723 | 1.71e-25 | 5.33e-22 | 122 |
| GO:190290319 | Prostate | Tumor | regulation of supramolecular fiber organization | 131/3246 | 383/18723 | 6.68e-16 | 1.26e-13 | 131 |
| GO:003297019 | Prostate | Tumor | regulation of actin filament-based process | 133/3246 | 397/18723 | 2.59e-15 | 4.35e-13 | 133 |
| GO:000701519 | Prostate | Tumor | actin filament organization | 142/3246 | 442/18723 | 1.40e-14 | 1.89e-12 | 142 |
| GO:005109819 | Prostate | Tumor | regulation of binding | 122/3246 | 363/18723 | 2.86e-14 | 3.63e-12 | 122 |
| GO:003295619 | Prostate | Tumor | regulation of actin cytoskeleton organization | 117/3246 | 358/18723 | 8.34e-13 | 8.22e-11 | 117 |
| GO:004325419 | Prostate | Tumor | regulation of protein-containing complex assembly | 132/3246 | 428/18723 | 3.32e-12 | 2.78e-10 | 132 |
| GO:011005319 | Prostate | Tumor | regulation of actin filament organization | 94/3246 | 278/18723 | 1.77e-11 | 1.25e-09 | 94 |
| Page: 1 2 3 4 5 6 7 8 9 10 11 12 13 14 15 16 17 18 19 20 21 22 23 24 25 26 27 28 29 30 31 32 33 34 35 36 37 38 39 40 41 42 43 44 45 46 47 48 49 50 51 52 53 54 55 56 57 58 59 60 61 62 63 64 65 66 67 68 69 70 71 72 73 74 75 76 77 78 79 80 81 82 83 84 85 86 87 88 89 90 91 92 93 94 95 96 97 98 99 100 101 102 103 104 105 106 107 108 109 110 111 112 113 114 115 116 117 118 119 120 |
| Pathway ID | Tissue | Disease Stage | Description | Gene Ratio | Bg Ratio | pvalue | p.adjust | qvalue | Count |
| hsa0481014 | Breast | IDC | Regulation of actin cytoskeleton | 36/867 | 229/8465 | 5.79e-03 | 3.13e-02 | 2.34e-02 | 36 |
| hsa0481015 | Breast | IDC | Regulation of actin cytoskeleton | 36/867 | 229/8465 | 5.79e-03 | 3.13e-02 | 2.34e-02 | 36 |
| hsa0481023 | Breast | DCIS | Regulation of actin cytoskeleton | 35/846 | 229/8465 | 6.89e-03 | 3.37e-02 | 2.48e-02 | 35 |
| hsa0481033 | Breast | DCIS | Regulation of actin cytoskeleton | 35/846 | 229/8465 | 6.89e-03 | 3.37e-02 | 2.48e-02 | 35 |
| hsa0481016 | Cervix | CC | Regulation of actin cytoskeleton | 64/1267 | 229/8465 | 2.24e-07 | 2.59e-06 | 1.53e-06 | 64 |
| hsa0481017 | Cervix | CC | Regulation of actin cytoskeleton | 64/1267 | 229/8465 | 2.24e-07 | 2.59e-06 | 1.53e-06 | 64 |
| hsa04810 | Colorectum | AD | Regulation of actin cytoskeleton | 75/2092 | 229/8465 | 3.36e-03 | 1.76e-02 | 1.12e-02 | 75 |
| hsa048101 | Colorectum | AD | Regulation of actin cytoskeleton | 75/2092 | 229/8465 | 3.36e-03 | 1.76e-02 | 1.12e-02 | 75 |
| hsa048102 | Colorectum | SER | Regulation of actin cytoskeleton | 60/1580 | 229/8465 | 2.74e-03 | 2.02e-02 | 1.47e-02 | 60 |
| hsa048103 | Colorectum | SER | Regulation of actin cytoskeleton | 60/1580 | 229/8465 | 2.74e-03 | 2.02e-02 | 1.47e-02 | 60 |
| hsa048104 | Colorectum | MSS | Regulation of actin cytoskeleton | 68/1875 | 229/8465 | 4.27e-03 | 1.86e-02 | 1.14e-02 | 68 |
| hsa048105 | Colorectum | MSS | Regulation of actin cytoskeleton | 68/1875 | 229/8465 | 4.27e-03 | 1.86e-02 | 1.14e-02 | 68 |
| hsa048106 | Colorectum | FAP | Regulation of actin cytoskeleton | 65/1404 | 229/8465 | 4.07e-06 | 5.91e-05 | 3.59e-05 | 65 |
| hsa048107 | Colorectum | FAP | Regulation of actin cytoskeleton | 65/1404 | 229/8465 | 4.07e-06 | 5.91e-05 | 3.59e-05 | 65 |
| hsa048108 | Colorectum | CRC | Regulation of actin cytoskeleton | 52/1091 | 229/8465 | 2.34e-05 | 5.57e-04 | 3.78e-04 | 52 |
| hsa048109 | Colorectum | CRC | Regulation of actin cytoskeleton | 52/1091 | 229/8465 | 2.34e-05 | 5.57e-04 | 3.78e-04 | 52 |
| hsa0481018 | Endometrium | AEH | Regulation of actin cytoskeleton | 50/1197 | 229/8465 | 9.08e-04 | 5.78e-03 | 4.23e-03 | 50 |
| hsa0481019 | Endometrium | AEH | Regulation of actin cytoskeleton | 50/1197 | 229/8465 | 9.08e-04 | 5.78e-03 | 4.23e-03 | 50 |
| hsa0481024 | Endometrium | EEC | Regulation of actin cytoskeleton | 49/1237 | 229/8465 | 3.20e-03 | 1.78e-02 | 1.33e-02 | 49 |
| hsa0481034 | Endometrium | EEC | Regulation of actin cytoskeleton | 49/1237 | 229/8465 | 3.20e-03 | 1.78e-02 | 1.33e-02 | 49 |
| Page: 1 2 |
Top |
Cell-cell communication analysis |
| Identification of potential cell-cell interactions between two cell types and their ligand-receptor pairs for different disease states |
| Ligand | Receptor | LRpair | Pathway | Tissue | Disease Stage |
| Page: 1 |
Top |
Single-cell gene regulatory network inference analysis |
| Find out the significant the regulons (TFs) and the target genes of each regulon across cell types for different disease states |
| TF | Cell Type | Tissue | Disease Stage | Target Gene | RSS | Regulon Activity |
| ∗The dot plots of a searched regulon are shown for all cell subpopulations in each disease state of each tissue based on the regulon specific score inferred using pySCENIC and by calculating the average expression. |
| Page: 1 |
Top |
Somatic mutation of malignant transformation related genes |
| Annotation of somatic variants for genes involved in malignant transformation |
| Hugo Symbol | Variant Class | Variant Classification | dbSNP RS | HGVSc | HGVSp | HGVSp Short | SWISSPROT | BIOTYPE | SIFT | PolyPhen | Tumor Sample Barcode | Tissue | Histology | Sex | Age | Stage | Therapy Types | Drugs | Outcome |
| TMSB4X | SNV | Missense_Mutation | novel | c.73N>A | p.Glu25Lys | p.E25K | P62328 | protein_coding | deleterious(0.03) | possibly_damaging(0.601) | TCGA-AO-A0JC-01 | Breast | breast invasive carcinoma | Female | <65 | I/II | Chemotherapy | fluorouracil | SD |
| TMSB4X | SNV | Missense_Mutation | c.40G>A | p.Asp14Asn | p.D14N | P62328 | protein_coding | tolerated(0.11) | probably_damaging(0.999) | TCGA-EK-A2PG-01 | Cervix | cervical & endocervical cancer | Female | >=65 | I/II | Unknown | Unknown | SD | |
| TMSB4X | SNV | Missense_Mutation | rs777121308 | c.23N>T | p.Ala8Val | p.A8V | P62328 | protein_coding | deleterious(0.04) | possibly_damaging(0.587) | TCGA-AA-3947-01 | Colorectum | colon adenocarcinoma | Female | <65 | I/II | Unknown | Unknown | SD |
| TMSB4X | SNV | Missense_Mutation | c.83N>A | p.Pro28Gln | p.P28Q | P62328 | protein_coding | deleterious(0) | probably_damaging(0.953) | TCGA-DF-A2KU-01 | Endometrium | uterine corpus endometrioid carcinoma | Female | Unknown | I/II | Unknown | Unknown | SD | |
| TMSB4X | SNV | Missense_Mutation | novel | c.39C>G | p.Phe13Leu | p.F13L | P62328 | protein_coding | deleterious(0.03) | possibly_damaging(0.861) | TCGA-34-2604-01 | Lung | lung squamous cell carcinoma | Female | >=65 | I/II | Unknown | Unknown | SD |
| Page: 1 |
Top |
Related drugs of malignant transformation related genes |
| Identification of chemicals and drugs interact with genes involved in malignant transfromation |
| (DGIdb 4.0) |
| Entrez ID | Symbol | Category | Interaction Types | Drug Claim Name | Drug Name | PMIDs |
| Page: 1 |

Copyright 2023-Present -The University of Texas Health Science Center at Houston |