
|
|||||
|
 | |
| |
| |
| |
| |
| |
|
Gene: DUSP1 |
Gene summary for DUSP1 |
| Gene information | Species | Human | Gene symbol | DUSP1 | Gene ID | 1843 |
| Gene name | dual specificity phosphatase 1 | |
| Gene Alias | CL100 | |
| Cytomap | 5q35.1 | |
| Gene Type | protein-coding | GO ID | GO:0000003 | UniProtAcc | B4DU40 |
Top |
Malignant transformation analysis |
| Identification of the aberrant gene expression in precancerous and cancerous lesions by comparing the gene expression of stem-like cells in diseased tissues with normal stem cells |
| Entrez ID | Symbol | Replicates | Species | Organ | Tissue | Adj P-value | Log2FC | Malignancy |
| 1843 | DUSP1 | GSM4909281 | Human | Breast | IDC | 2.13e-09 | -4.87e-01 | 0.21 |
| 1843 | DUSP1 | GSM4909282 | Human | Breast | IDC | 9.71e-15 | 4.74e-01 | -0.0288 |
| 1843 | DUSP1 | GSM4909285 | Human | Breast | IDC | 2.33e-06 | -3.69e-01 | 0.21 |
| 1843 | DUSP1 | GSM4909286 | Human | Breast | IDC | 1.48e-23 | -7.16e-01 | 0.1081 |
| 1843 | DUSP1 | GSM4909290 | Human | Breast | IDC | 3.78e-18 | -7.68e-01 | 0.2096 |
| 1843 | DUSP1 | GSM4909291 | Human | Breast | IDC | 2.48e-08 | 4.85e-01 | 0.1753 |
| 1843 | DUSP1 | GSM4909294 | Human | Breast | IDC | 4.46e-09 | -3.00e-01 | 0.2022 |
| 1843 | DUSP1 | GSM4909296 | Human | Breast | IDC | 8.22e-11 | -4.66e-01 | 0.1524 |
| 1843 | DUSP1 | GSM4909297 | Human | Breast | IDC | 4.73e-19 | -1.06e-01 | 0.1517 |
| 1843 | DUSP1 | GSM4909299 | Human | Breast | IDC | 6.14e-14 | 4.64e-01 | 0.035 |
| 1843 | DUSP1 | GSM4909300 | Human | Breast | IDC | 4.32e-09 | 6.03e-01 | 0.0334 |
| 1843 | DUSP1 | GSM4909304 | Human | Breast | IDC | 4.03e-12 | -5.17e-01 | 0.1636 |
| 1843 | DUSP1 | GSM4909305 | Human | Breast | IDC | 3.53e-11 | 4.95e-01 | 0.0436 |
| 1843 | DUSP1 | GSM4909307 | Human | Breast | IDC | 1.21e-03 | -3.68e-01 | 0.1569 |
| 1843 | DUSP1 | GSM4909308 | Human | Breast | IDC | 7.51e-20 | 5.75e-01 | 0.158 |
| 1843 | DUSP1 | GSM4909311 | Human | Breast | IDC | 9.38e-37 | -5.69e-01 | 0.1534 |
| 1843 | DUSP1 | GSM4909312 | Human | Breast | IDC | 5.02e-08 | -3.25e-01 | 0.1552 |
| 1843 | DUSP1 | GSM4909313 | Human | Breast | IDC | 5.50e-03 | 3.23e-01 | 0.0391 |
| 1843 | DUSP1 | GSM4909315 | Human | Breast | IDC | 1.47e-11 | -5.06e-01 | 0.21 |
| 1843 | DUSP1 | GSM4909316 | Human | Breast | IDC | 2.45e-04 | -6.59e-01 | 0.21 |
| Page: 1 2 3 4 5 6 7 8 9 10 11 12 13 14 15 |
| Tissue | Expression Dynamics | Abbreviation |
| Breast | 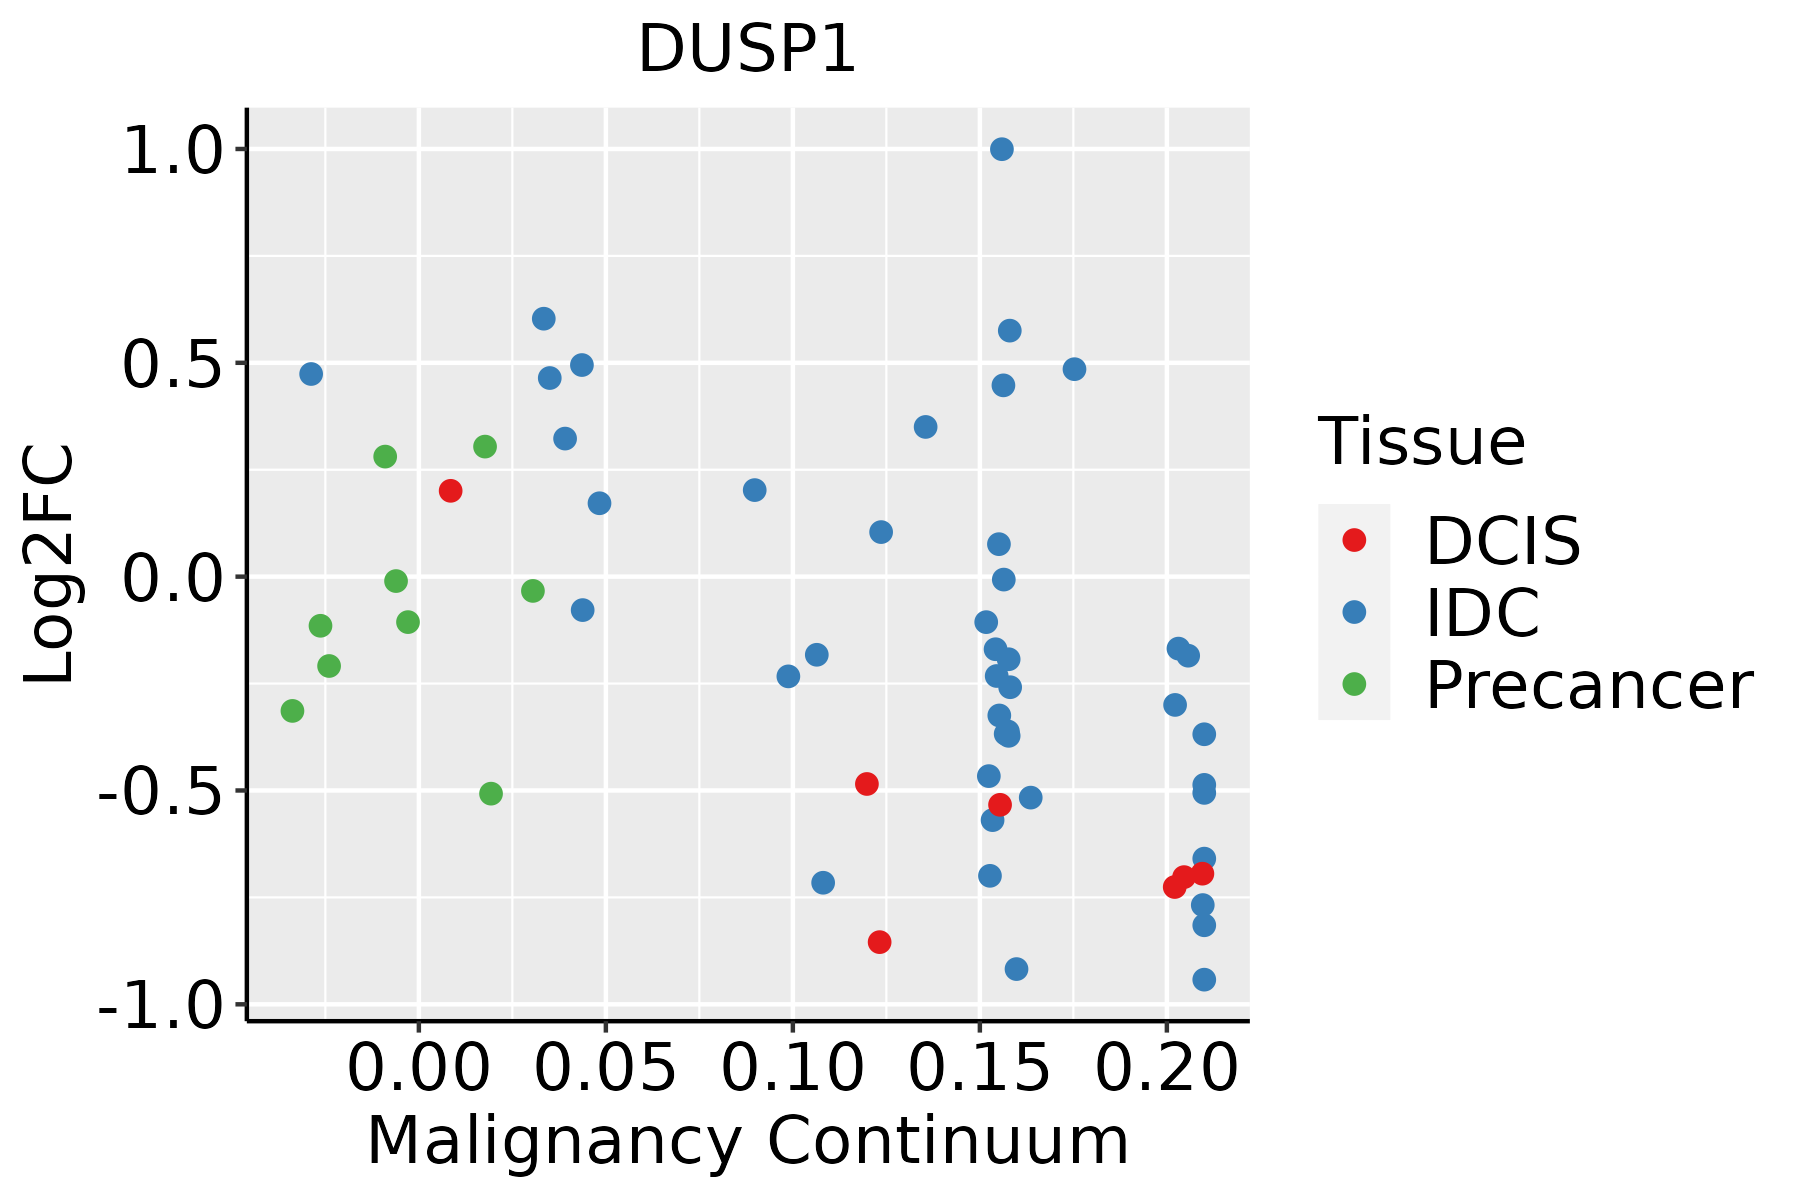 | IDC: Invasive ductal carcinoma |
| DCIS: Ductal carcinoma in situ | ||
| Precancer(BRCA1-mut): Precancerous lesion from BRCA1 mutation carriers | ||
| Cervix |  | CC: Cervix cancer |
| HSIL_HPV: HPV-infected high-grade squamous intraepithelial lesions | ||
| N_HPV: HPV-infected normal cervix | ||
| Colorectum (GSE201348) | 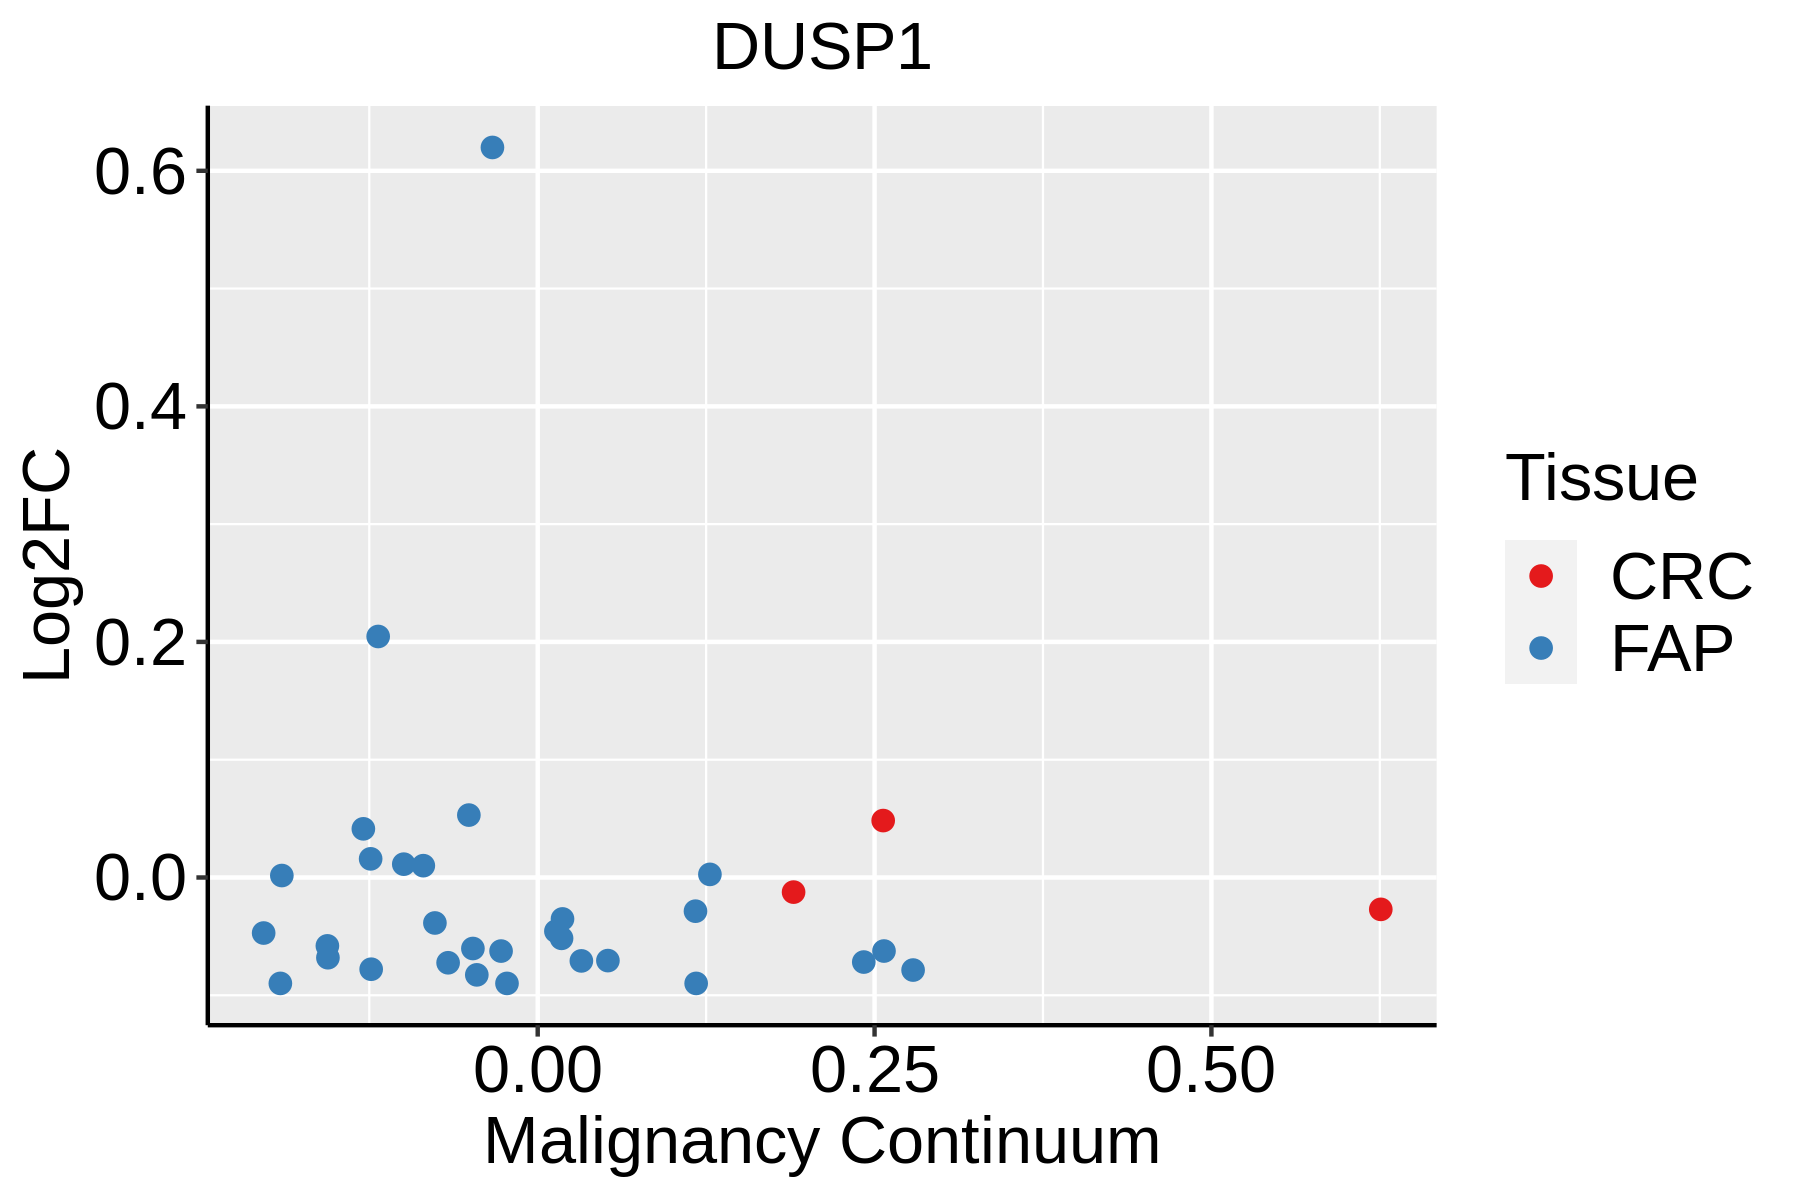 | FAP: Familial adenomatous polyposis |
| CRC: Colorectal cancer | ||
| Colorectum (HTA11) |  | AD: Adenomas |
| SER: Sessile serrated lesions | ||
| MSI-H: Microsatellite-high colorectal cancer | ||
| MSS: Microsatellite stable colorectal cancer | ||
| Endometrium |  | AEH: Atypical endometrial hyperplasia |
| EEC: Endometrioid Cancer | ||
| Esophagus | 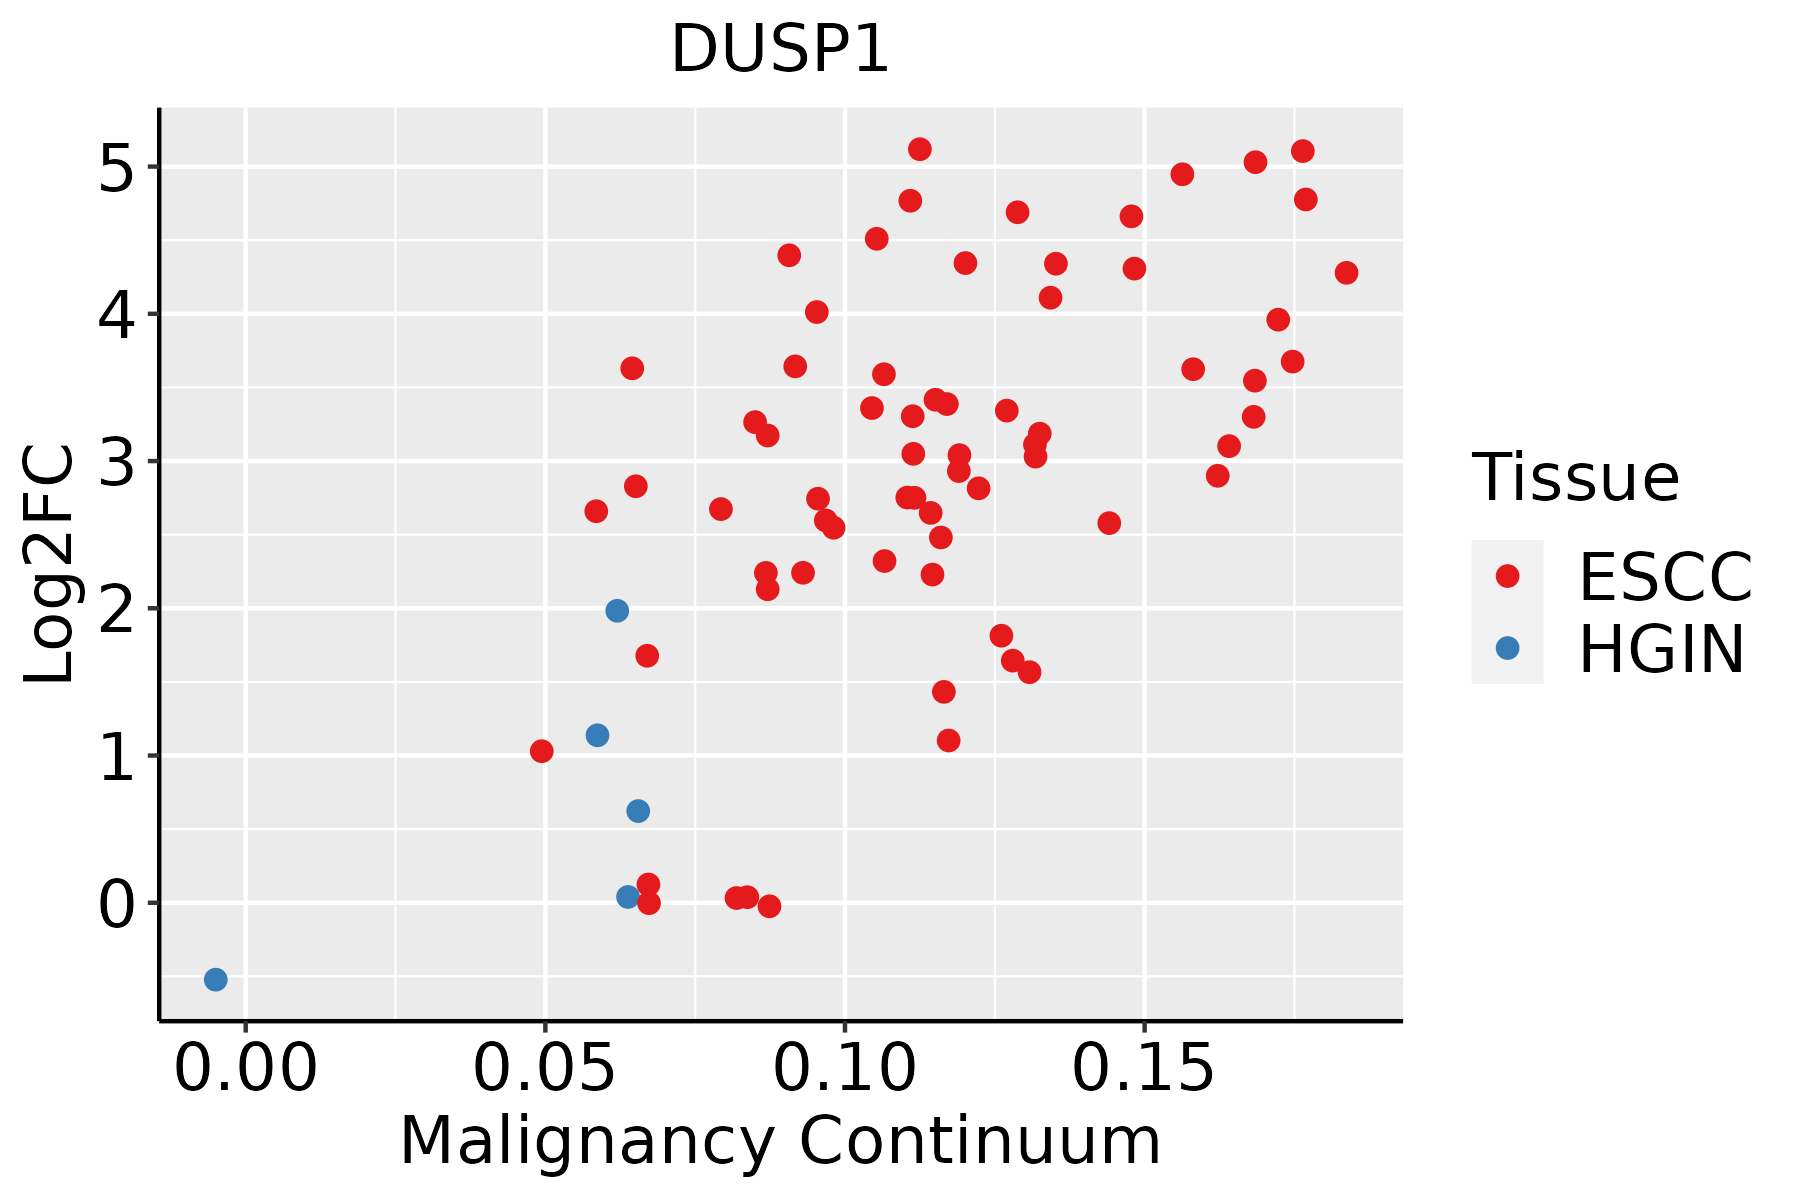 | ESCC: Esophageal squamous cell carcinoma |
| HGIN: High-grade intraepithelial neoplasias | ||
| LGIN: Low-grade intraepithelial neoplasias | ||
| GC |  | CAG: Chronic atrophic gastritis |
| CAG with IM: Chronic atrophic gastritis with intestinal metaplasia | ||
| CSG: Chronic superficial gastritis | ||
| GC: Gastric cancer | ||
| SIM: Severe intestinal metaplasia | ||
| WIM: Wild intestinal metaplasia | ||
| Liver | 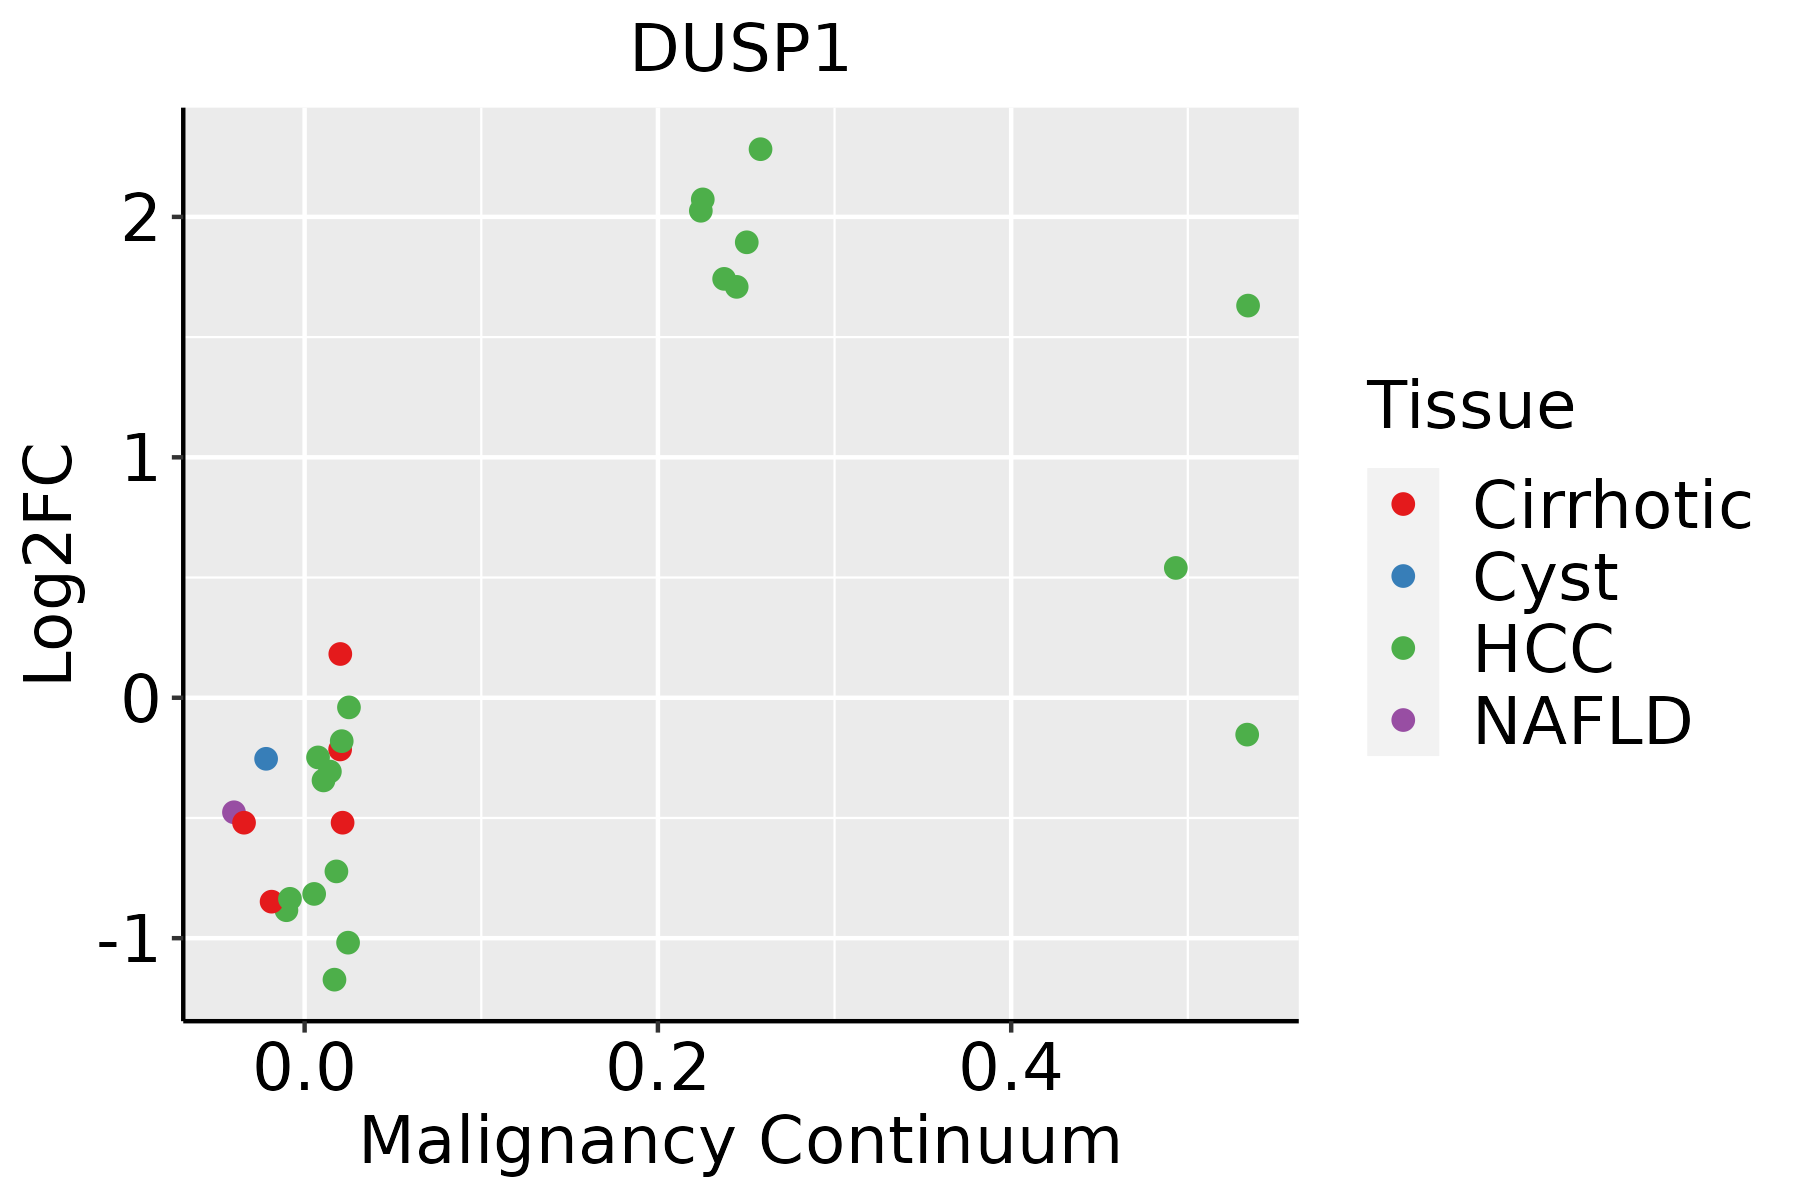 | HCC: Hepatocellular carcinoma |
| NAFLD: Non-alcoholic fatty liver disease | ||
| Lung |  | AAH: Atypical adenomatous hyperplasia |
| AIS: Adenocarcinoma in situ | ||
| IAC: Invasive lung adenocarcinoma | ||
| MIA: Minimally invasive adenocarcinoma | ||
| Oral Cavity | 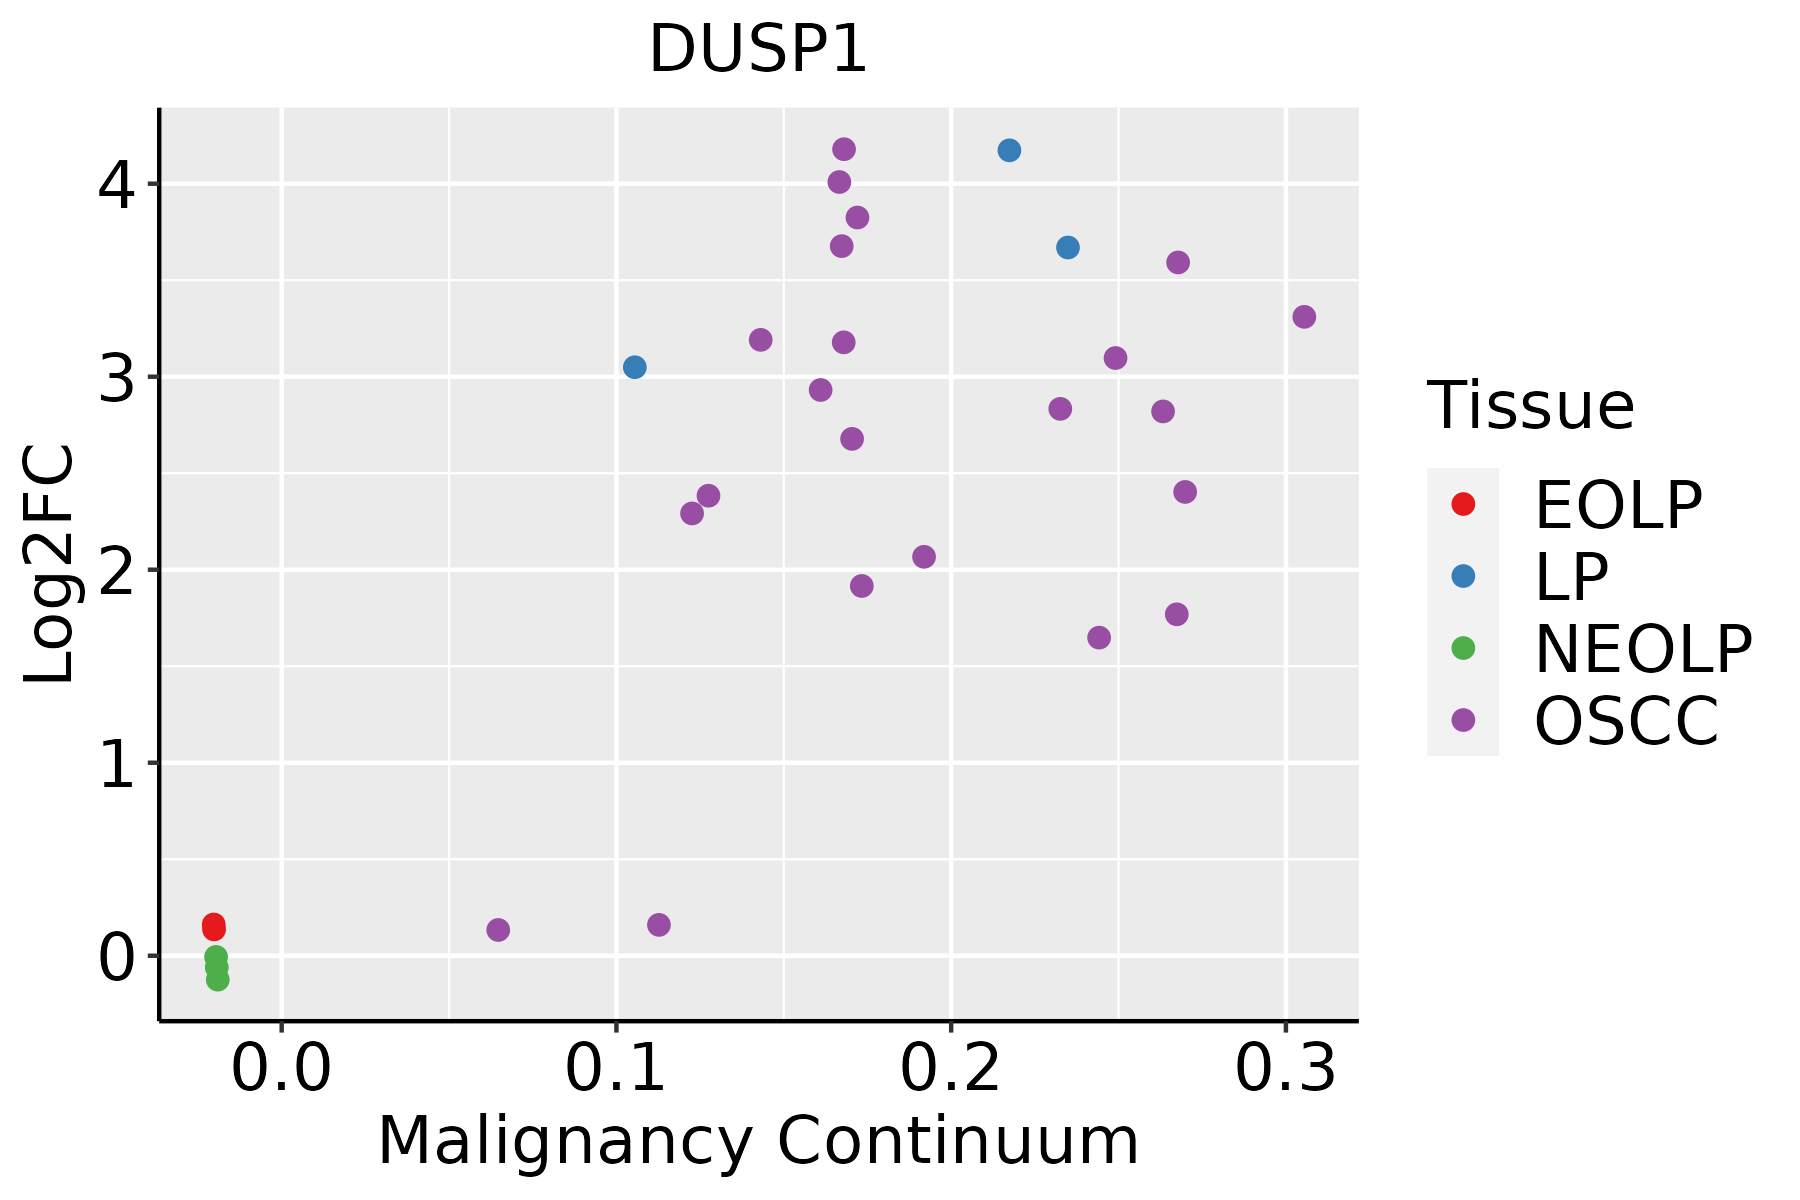 | EOLP: Erosive Oral lichen planus |
| LP: leukoplakia | ||
| NEOLP: Non-erosive oral lichen planus | ||
| OSCC: Oral squamous cell carcinoma | ||
| Prostate |  | BPH: Benign Prostatic Hyperplasia |
| Skin | 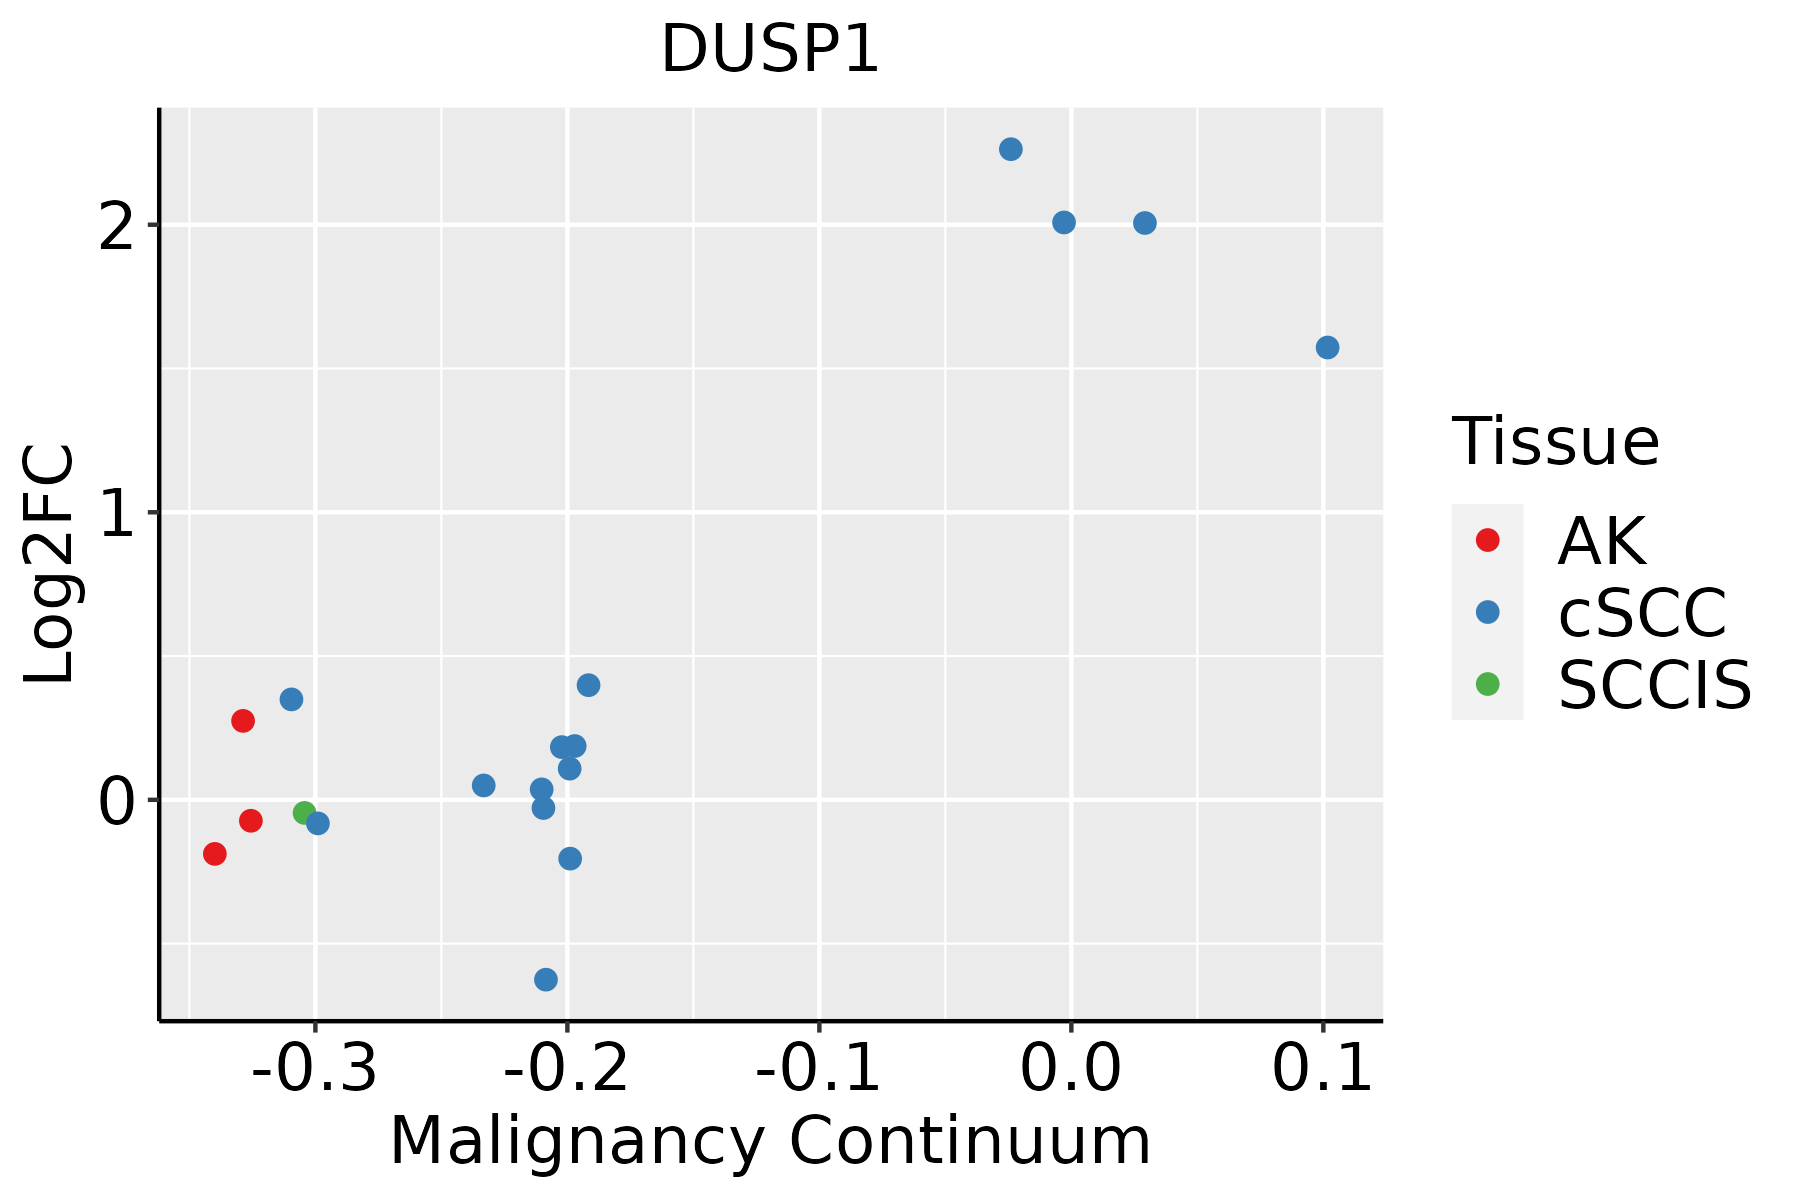 | AK: Actinic keratosis |
| cSCC: Cutaneous squamous cell carcinoma | ||
| SCCIS:squamous cell carcinoma in situ | ||
| Thyroid | 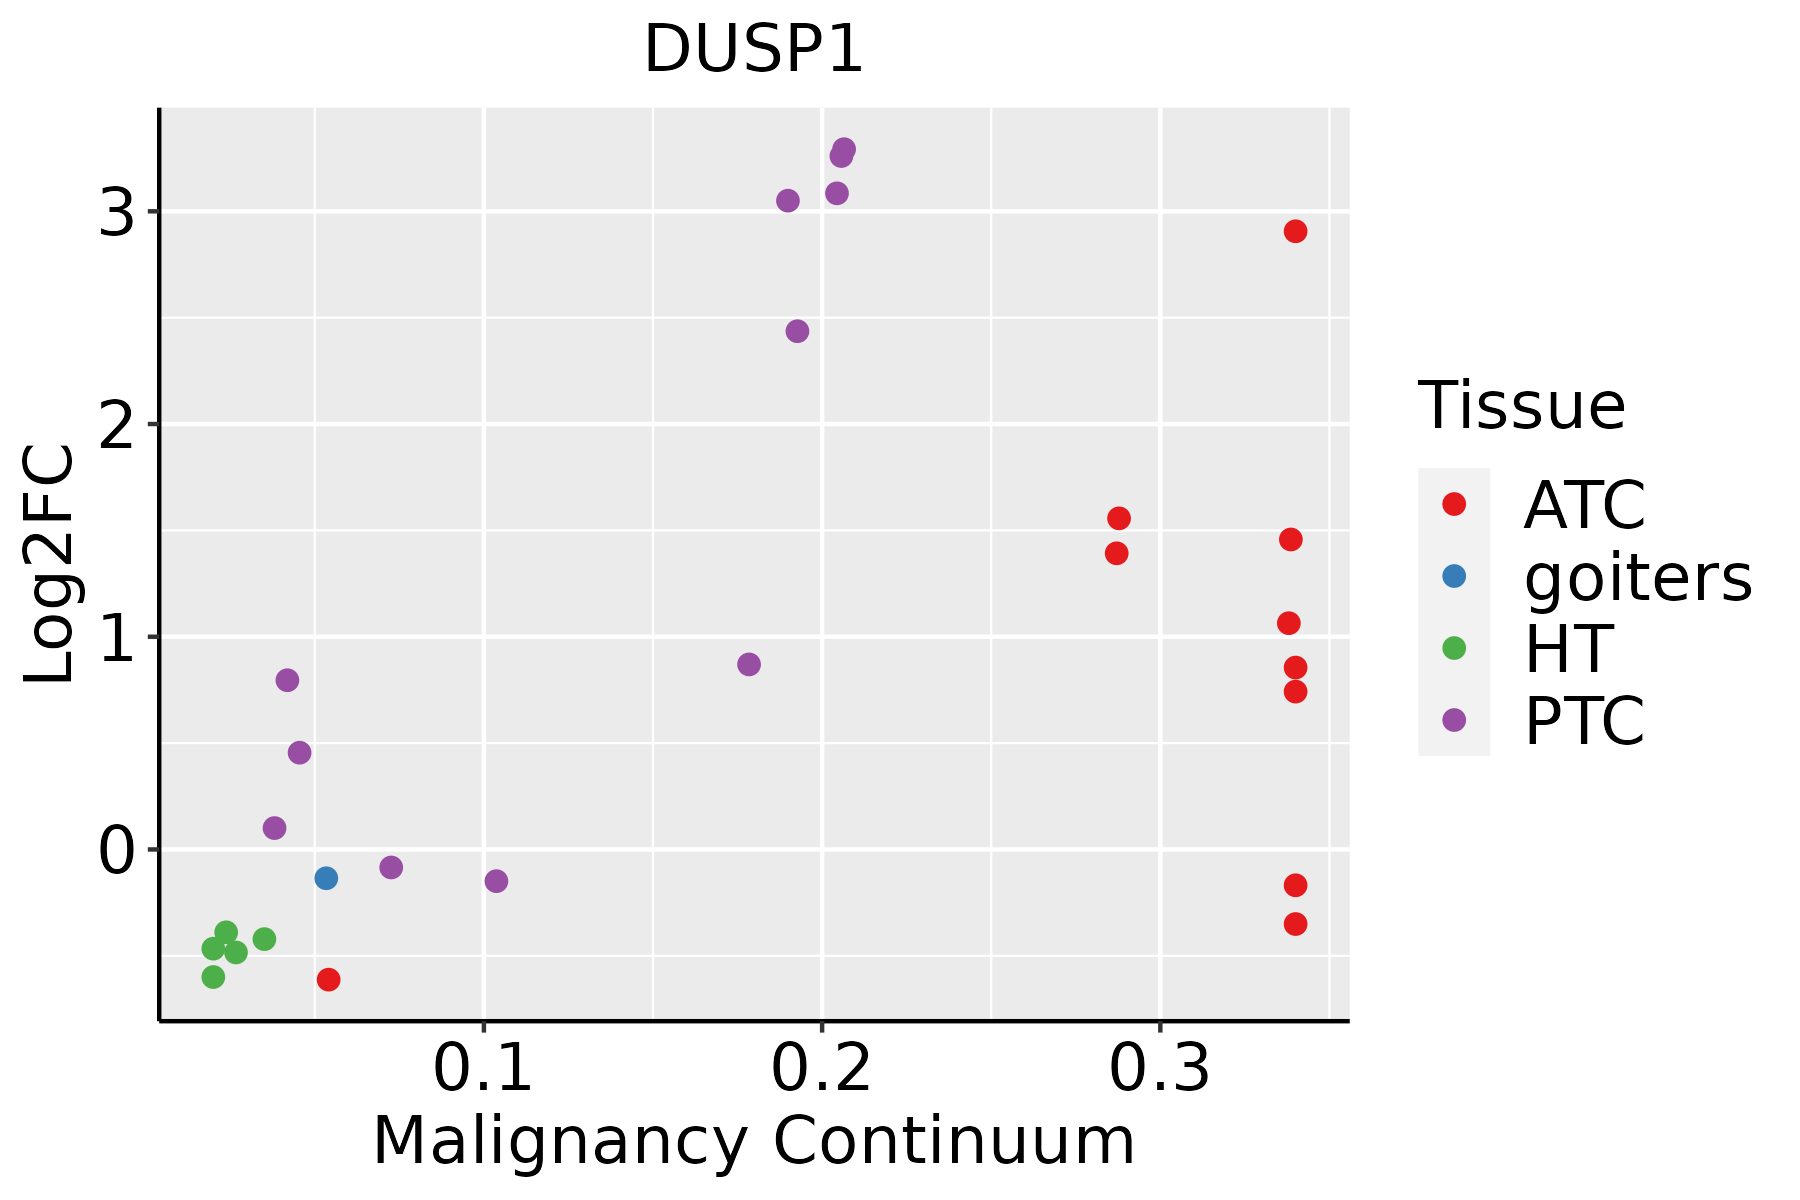 | ATC: Anaplastic thyroid cancer |
| HT: Hashimoto's thyroiditis | ||
| PTC: Papillary thyroid cancer |
| ∗log2FC in expression of this searched gene in stem-like cells from each diseased tissue sample relative to stem-like cells in normal samples in each tissue plotted against the malignancy continuum. Samples are colored based on if they are from different disease stage. |
Top |
Malignant transformation related pathway analysis |
| Find out the enriched GO biological processes and KEGG pathways involved in transition from healthy to precancer to cancer |
| Tissue | Disease Stage | Enriched GO biological Processes |
| Colorectum | AD |  |
| Colorectum | SER |  |
| Colorectum | MSS |  |
| Colorectum | MSI-H |  |
| Colorectum | FAP |  |
| ∗Top 15 enriched GO BP terms are showed in the bar plot of each disease state in each tissue. Each row represents a significant GO biological process which is colored according to the -log10(p.adjust). |
| Page: 1 2 3 4 5 6 7 8 9 |
| GO ID | Tissue | Disease Stage | Description | Gene Ratio | Bg Ratio | pvalue | p.adjust | Count |
| GO:20002786 | Stomach | GC | regulation of DNA biosynthetic process | 15/1159 | 106/18723 | 2.21e-03 | 2.18e-02 | 15 |
| GO:00071623 | Stomach | GC | negative regulation of cell adhesion | 32/1159 | 303/18723 | 2.24e-03 | 2.20e-02 | 32 |
| GO:00434096 | Stomach | GC | negative regulation of MAPK cascade | 21/1159 | 180/18723 | 3.86e-03 | 3.26e-02 | 21 |
| GO:00515922 | Stomach | GC | response to calcium ion | 18/1159 | 149/18723 | 4.97e-03 | 3.96e-02 | 18 |
| GO:000697911 | Stomach | CAG with IM | response to oxidative stress | 59/1050 | 446/18723 | 7.12e-10 | 1.02e-07 | 59 |
| GO:001003811 | Stomach | CAG with IM | response to metal ion | 46/1050 | 373/18723 | 4.33e-07 | 2.43e-05 | 46 |
| GO:00319601 | Stomach | CAG with IM | response to corticosteroid | 27/1050 | 167/18723 | 6.35e-07 | 3.36e-05 | 27 |
| GO:00513841 | Stomach | CAG with IM | response to glucocorticoid | 24/1050 | 148/18723 | 2.49e-06 | 1.07e-04 | 24 |
| GO:000030211 | Stomach | CAG with IM | response to reactive oxygen species | 31/1050 | 222/18723 | 2.54e-06 | 1.07e-04 | 31 |
| GO:004854511 | Stomach | CAG with IM | response to steroid hormone | 40/1050 | 339/18723 | 7.19e-06 | 2.57e-04 | 40 |
| GO:005134811 | Stomach | CAG with IM | negative regulation of transferase activity | 33/1050 | 268/18723 | 1.86e-05 | 5.68e-04 | 33 |
| GO:004254211 | Stomach | CAG with IM | response to hydrogen peroxide | 22/1050 | 146/18723 | 2.14e-05 | 6.19e-04 | 22 |
| GO:00509001 | Stomach | CAG with IM | leukocyte migration | 40/1050 | 369/18723 | 5.16e-05 | 1.32e-03 | 40 |
| GO:003287211 | Stomach | CAG with IM | regulation of stress-activated MAPK cascade | 25/1050 | 192/18723 | 7.51e-05 | 1.78e-03 | 25 |
| GO:190165411 | Stomach | CAG with IM | response to ketone | 25/1050 | 194/18723 | 8.90e-05 | 2.04e-03 | 25 |
| GO:00305951 | Stomach | CAG with IM | leukocyte chemotaxis | 28/1050 | 230/18723 | 9.52e-05 | 2.16e-03 | 28 |
| GO:007030211 | Stomach | CAG with IM | regulation of stress-activated protein kinase signaling cascade | 25/1050 | 195/18723 | 9.68e-05 | 2.19e-03 | 25 |
| GO:00026851 | Stomach | CAG with IM | regulation of leukocyte migration | 26/1050 | 210/18723 | 1.27e-04 | 2.64e-03 | 26 |
| GO:003109811 | Stomach | CAG with IM | stress-activated protein kinase signaling cascade | 29/1050 | 247/18723 | 1.37e-04 | 2.79e-03 | 29 |
| GO:001063911 | Stomach | CAG with IM | negative regulation of organelle organization | 37/1050 | 348/18723 | 1.45e-04 | 2.89e-03 | 37 |
| Page: 1 2 3 4 5 6 7 8 9 10 11 12 13 14 15 16 17 18 19 20 21 22 23 24 25 26 27 28 29 30 31 32 33 34 35 36 37 38 39 40 41 42 43 44 45 46 47 48 49 50 51 52 53 54 55 56 57 58 59 60 61 62 63 64 65 66 67 68 69 70 71 72 73 74 75 76 77 78 79 80 81 82 83 84 85 86 87 88 89 90 91 92 93 94 95 96 97 98 99 100 101 102 103 |
| Pathway ID | Tissue | Disease Stage | Description | Gene Ratio | Bg Ratio | pvalue | p.adjust | qvalue | Count |
| hsa0501224 | Breast | IDC | Parkinson disease | 107/867 | 266/8465 | 2.57e-39 | 8.36e-37 | 6.26e-37 | 107 |
| hsa0541824 | Breast | IDC | Fluid shear stress and atherosclerosis | 34/867 | 139/8465 | 9.41e-07 | 1.61e-05 | 1.20e-05 | 34 |
| hsa0501234 | Breast | IDC | Parkinson disease | 107/867 | 266/8465 | 2.57e-39 | 8.36e-37 | 6.26e-37 | 107 |
| hsa0541834 | Breast | IDC | Fluid shear stress and atherosclerosis | 34/867 | 139/8465 | 9.41e-07 | 1.61e-05 | 1.20e-05 | 34 |
| hsa0501243 | Breast | DCIS | Parkinson disease | 106/846 | 266/8465 | 1.64e-39 | 5.29e-37 | 3.90e-37 | 106 |
| hsa0501253 | Breast | DCIS | Parkinson disease | 106/846 | 266/8465 | 1.64e-39 | 5.29e-37 | 3.90e-37 | 106 |
| hsa0501220 | Cervix | CC | Parkinson disease | 102/1267 | 266/8465 | 1.81e-21 | 1.47e-19 | 8.66e-20 | 102 |
| hsa0541820 | Cervix | CC | Fluid shear stress and atherosclerosis | 50/1267 | 139/8465 | 5.71e-10 | 1.32e-08 | 7.81e-09 | 50 |
| hsa040109 | Cervix | CC | MAPK signaling pathway | 62/1267 | 302/8465 | 4.89e-03 | 1.67e-02 | 9.86e-03 | 62 |
| hsa05012110 | Cervix | CC | Parkinson disease | 102/1267 | 266/8465 | 1.81e-21 | 1.47e-19 | 8.66e-20 | 102 |
| hsa05418110 | Cervix | CC | Fluid shear stress and atherosclerosis | 50/1267 | 139/8465 | 5.71e-10 | 1.32e-08 | 7.81e-09 | 50 |
| hsa0401012 | Cervix | CC | MAPK signaling pathway | 62/1267 | 302/8465 | 4.89e-03 | 1.67e-02 | 9.86e-03 | 62 |
| hsa0501225 | Cervix | HSIL_HPV | Parkinson disease | 43/459 | 266/8465 | 6.69e-11 | 6.53e-09 | 5.28e-09 | 43 |
| hsa0541825 | Cervix | HSIL_HPV | Fluid shear stress and atherosclerosis | 16/459 | 139/8465 | 3.41e-03 | 2.08e-02 | 1.68e-02 | 16 |
| hsa0501235 | Cervix | HSIL_HPV | Parkinson disease | 43/459 | 266/8465 | 6.69e-11 | 6.53e-09 | 5.28e-09 | 43 |
| hsa0541835 | Cervix | HSIL_HPV | Fluid shear stress and atherosclerosis | 16/459 | 139/8465 | 3.41e-03 | 2.08e-02 | 1.68e-02 | 16 |
| hsa0501244 | Cervix | N_HPV | Parkinson disease | 45/349 | 266/8465 | 1.93e-16 | 1.75e-14 | 1.37e-14 | 45 |
| hsa0541845 | Cervix | N_HPV | Fluid shear stress and atherosclerosis | 20/349 | 139/8465 | 9.29e-07 | 1.41e-05 | 1.10e-05 | 20 |
| hsa0501254 | Cervix | N_HPV | Parkinson disease | 45/349 | 266/8465 | 1.93e-16 | 1.75e-14 | 1.37e-14 | 45 |
| hsa0541855 | Cervix | N_HPV | Fluid shear stress and atherosclerosis | 20/349 | 139/8465 | 9.29e-07 | 1.41e-05 | 1.10e-05 | 20 |
| Page: 1 2 3 4 5 6 |
Top |
Cell-cell communication analysis |
| Identification of potential cell-cell interactions between two cell types and their ligand-receptor pairs for different disease states |
| Ligand | Receptor | LRpair | Pathway | Tissue | Disease Stage |
| Page: 1 |
Top |
Single-cell gene regulatory network inference analysis |
| Find out the significant the regulons (TFs) and the target genes of each regulon across cell types for different disease states |
| TF | Cell Type | Tissue | Disease Stage | Target Gene | RSS | Regulon Activity |
| ∗The dot plots of a searched regulon are shown for all cell subpopulations in each disease state of each tissue based on the regulon specific score inferred using pySCENIC and by calculating the average expression. |
| Page: 1 |
Top |
Somatic mutation of malignant transformation related genes |
| Annotation of somatic variants for genes involved in malignant transformation |
| Hugo Symbol | Variant Class | Variant Classification | dbSNP RS | HGVSc | HGVSp | HGVSp Short | SWISSPROT | BIOTYPE | SIFT | PolyPhen | Tumor Sample Barcode | Tissue | Histology | Sex | Age | Stage | Therapy Types | Drugs | Outcome |
| DUSP1 | SNV | Missense_Mutation | c.595N>A | p.Gly199Ser | p.G199S | P28562 | protein_coding | deleterious(0.04) | probably_damaging(0.998) | TCGA-A8-A09Z-01 | Breast | breast invasive carcinoma | Female | >=65 | I/II | Unknown | Unknown | SD | |
| DUSP1 | insertion | In_Frame_Ins | novel | c.995_996insATC | p.Gly332_Thr333insSer | p.G332_T333insS | P28562 | protein_coding | TCGA-A8-A097-01 | Breast | breast invasive carcinoma | Female | >=65 | I/II | Hormone Therapy | tamoxiphen | SD | ||
| DUSP1 | insertion | Frame_Shift_Ins | novel | c.994_995insTCCATCTGACAAAATGGGGCAGAAGAGAAAGGACTCAGTGTGT | p.Gly332ValfsTer57 | p.G332Vfs*57 | P28562 | protein_coding | TCGA-A8-A097-01 | Breast | breast invasive carcinoma | Female | >=65 | I/II | Hormone Therapy | tamoxiphen | SD | ||
| DUSP1 | insertion | Nonsense_Mutation | novel | c.848_849insTTTAACTTCACCCGAGTTCCTCTGGGTTTCTAAGCAGTTATGGTGAT | p.Glu283AspfsTer16 | p.E283Dfs*16 | P28562 | protein_coding | TCGA-B6-A0IM-01 | Breast | breast invasive carcinoma | Female | >=65 | I/II | Unknown | Unknown | SD | ||
| DUSP1 | insertion | Frame_Shift_Ins | novel | c.665_666insGCACCTCCACCACCACCGTGTTCAACTTCCCCGTCTC | p.Ser222ArgfsTer33 | p.S222Rfs*33 | P28562 | protein_coding | TCGA-BH-A0BR-01 | Breast | breast invasive carcinoma | Female | <65 | I/II | Unknown | Unknown | SD | ||
| DUSP1 | insertion | Frame_Shift_Ins | novel | c.848_849insAAGGACTCAGTGTGTGATCCGGTTTCTT | p.Ala284ArgfsTer12 | p.A284Rfs*12 | P28562 | protein_coding | TCGA-BH-A0BV-01 | Breast | breast invasive carcinoma | Female | >=65 | I/II | Chemotherapy | doxorubicin | SD | ||
| DUSP1 | SNV | Missense_Mutation | c.609G>C | p.Leu203Phe | p.L203F | P28562 | protein_coding | deleterious(0) | probably_damaging(0.994) | TCGA-C5-A3HE-01 | Cervix | cervical & endocervical cancer | Female | <65 | I/II | Unknown | Unknown | PD | |
| DUSP1 | SNV | Missense_Mutation | novel | c.376N>C | p.Glu126Gln | p.E126Q | P28562 | protein_coding | tolerated(0.05) | possibly_damaging(0.565) | TCGA-VS-A958-01 | Cervix | cervical & endocervical cancer | Female | <65 | I/II | Chemotherapy | cisplatin | CR |
| DUSP1 | SNV | Missense_Mutation | c.565N>A | p.Ala189Thr | p.A189T | P28562 | protein_coding | deleterious(0) | probably_damaging(0.988) | TCGA-AG-A02N-01 | Colorectum | rectum adenocarcinoma | Male | >=65 | I/II | Chemotherapy | folinic | CR | |
| DUSP1 | SNV | Missense_Mutation | c.1056N>A | p.Ser352Arg | p.S352R | P28562 | protein_coding | deleterious(0.02) | benign(0.221) | TCGA-AP-A0LH-01 | Endometrium | uterine corpus endometrioid carcinoma | Female | <65 | I/II | Chemotherapy | paclitaxel | PD |
| Page: 1 2 3 |
Top |
Related drugs of malignant transformation related genes |
| Identification of chemicals and drugs interact with genes involved in malignant transfromation |
| (DGIdb 4.0) |
| Entrez ID | Symbol | Category | Interaction Types | Drug Claim Name | Drug Name | PMIDs |
| 1843 | DUSP1 | PROTEIN PHOSPHATASE, KINASE, DRUGGABLE GENOME | Avastin+/-Tarceva | |||
| 1843 | DUSP1 | PROTEIN PHOSPHATASE, KINASE, DRUGGABLE GENOME | HYDROXYUREA | HYDROXYUREA | 15856297 | |
| 1843 | DUSP1 | PROTEIN PHOSPHATASE, KINASE, DRUGGABLE GENOME | salbutamol | ALBUTEROL | 20673984 | |
| 1843 | DUSP1 | PROTEIN PHOSPHATASE, KINASE, DRUGGABLE GENOME | VASOPRESSIN | VASOPRESSIN | 9231829 | |
| 1843 | DUSP1 | PROTEIN PHOSPHATASE, KINASE, DRUGGABLE GENOME | ANTISENSE OLIGONUCLEOTIDES | 11988488 |
| Page: 1 |

Copyright 2023-Present -The University of Texas Health Science Center at Houston |