
|
|||||
|
 | |
| |
| |
| |
| |
| |
|
Gene: CHM |
Gene summary for CHM |
| Gene information | Species | Human | Gene symbol | CHM | Gene ID | 1121 |
| Gene name | CHM Rab escort protein | |
| Gene Alias | DXS540 | |
| Cytomap | Xq21.2 | |
| Gene Type | protein-coding | GO ID | GO:0003008 | UniProtAcc | A8K545 |
Top |
Malignant transformation analysis |
| Identification of the aberrant gene expression in precancerous and cancerous lesions by comparing the gene expression of stem-like cells in diseased tissues with normal stem cells |
| Entrez ID | Symbol | Replicates | Species | Organ | Tissue | Adj P-value | Log2FC | Malignancy |
| 1121 | CHM | LZE5T | Human | Esophagus | ESCC | 1.58e-03 | 2.27e-01 | 0.0514 |
| 1121 | CHM | LZE7T | Human | Esophagus | ESCC | 6.50e-03 | 3.43e-01 | 0.0667 |
| 1121 | CHM | LZE8T | Human | Esophagus | ESCC | 2.27e-02 | 9.67e-02 | 0.067 |
| 1121 | CHM | LZE24T | Human | Esophagus | ESCC | 1.04e-13 | 2.99e-01 | 0.0596 |
| 1121 | CHM | LZE6T | Human | Esophagus | ESCC | 3.49e-02 | 1.79e-01 | 0.0845 |
| 1121 | CHM | P2T-E | Human | Esophagus | ESCC | 2.47e-48 | 7.68e-01 | 0.1177 |
| 1121 | CHM | P4T-E | Human | Esophagus | ESCC | 1.39e-13 | 2.67e-01 | 0.1323 |
| 1121 | CHM | P5T-E | Human | Esophagus | ESCC | 5.18e-06 | 9.88e-02 | 0.1327 |
| 1121 | CHM | P8T-E | Human | Esophagus | ESCC | 4.20e-14 | 2.73e-01 | 0.0889 |
| 1121 | CHM | P9T-E | Human | Esophagus | ESCC | 1.61e-07 | 1.31e-01 | 0.1131 |
| 1121 | CHM | P10T-E | Human | Esophagus | ESCC | 3.28e-17 | 3.07e-01 | 0.116 |
| 1121 | CHM | P11T-E | Human | Esophagus | ESCC | 2.15e-05 | 2.97e-01 | 0.1426 |
| 1121 | CHM | P12T-E | Human | Esophagus | ESCC | 1.02e-16 | 3.29e-01 | 0.1122 |
| 1121 | CHM | P15T-E | Human | Esophagus | ESCC | 1.24e-12 | 1.27e-01 | 0.1149 |
| 1121 | CHM | P16T-E | Human | Esophagus | ESCC | 3.82e-06 | 1.34e-01 | 0.1153 |
| 1121 | CHM | P17T-E | Human | Esophagus | ESCC | 3.52e-04 | 2.60e-01 | 0.1278 |
| 1121 | CHM | P19T-E | Human | Esophagus | ESCC | 4.69e-02 | 1.92e-01 | 0.1662 |
| 1121 | CHM | P20T-E | Human | Esophagus | ESCC | 1.78e-05 | 1.65e-01 | 0.1124 |
| 1121 | CHM | P21T-E | Human | Esophagus | ESCC | 1.63e-09 | 1.19e-01 | 0.1617 |
| 1121 | CHM | P22T-E | Human | Esophagus | ESCC | 1.28e-07 | 1.89e-01 | 0.1236 |
| Page: 1 2 3 4 5 |
| Tissue | Expression Dynamics | Abbreviation |
| Esophagus |  | ESCC: Esophageal squamous cell carcinoma |
| HGIN: High-grade intraepithelial neoplasias | ||
| LGIN: Low-grade intraepithelial neoplasias | ||
| Liver |  | HCC: Hepatocellular carcinoma |
| NAFLD: Non-alcoholic fatty liver disease | ||
| Thyroid | 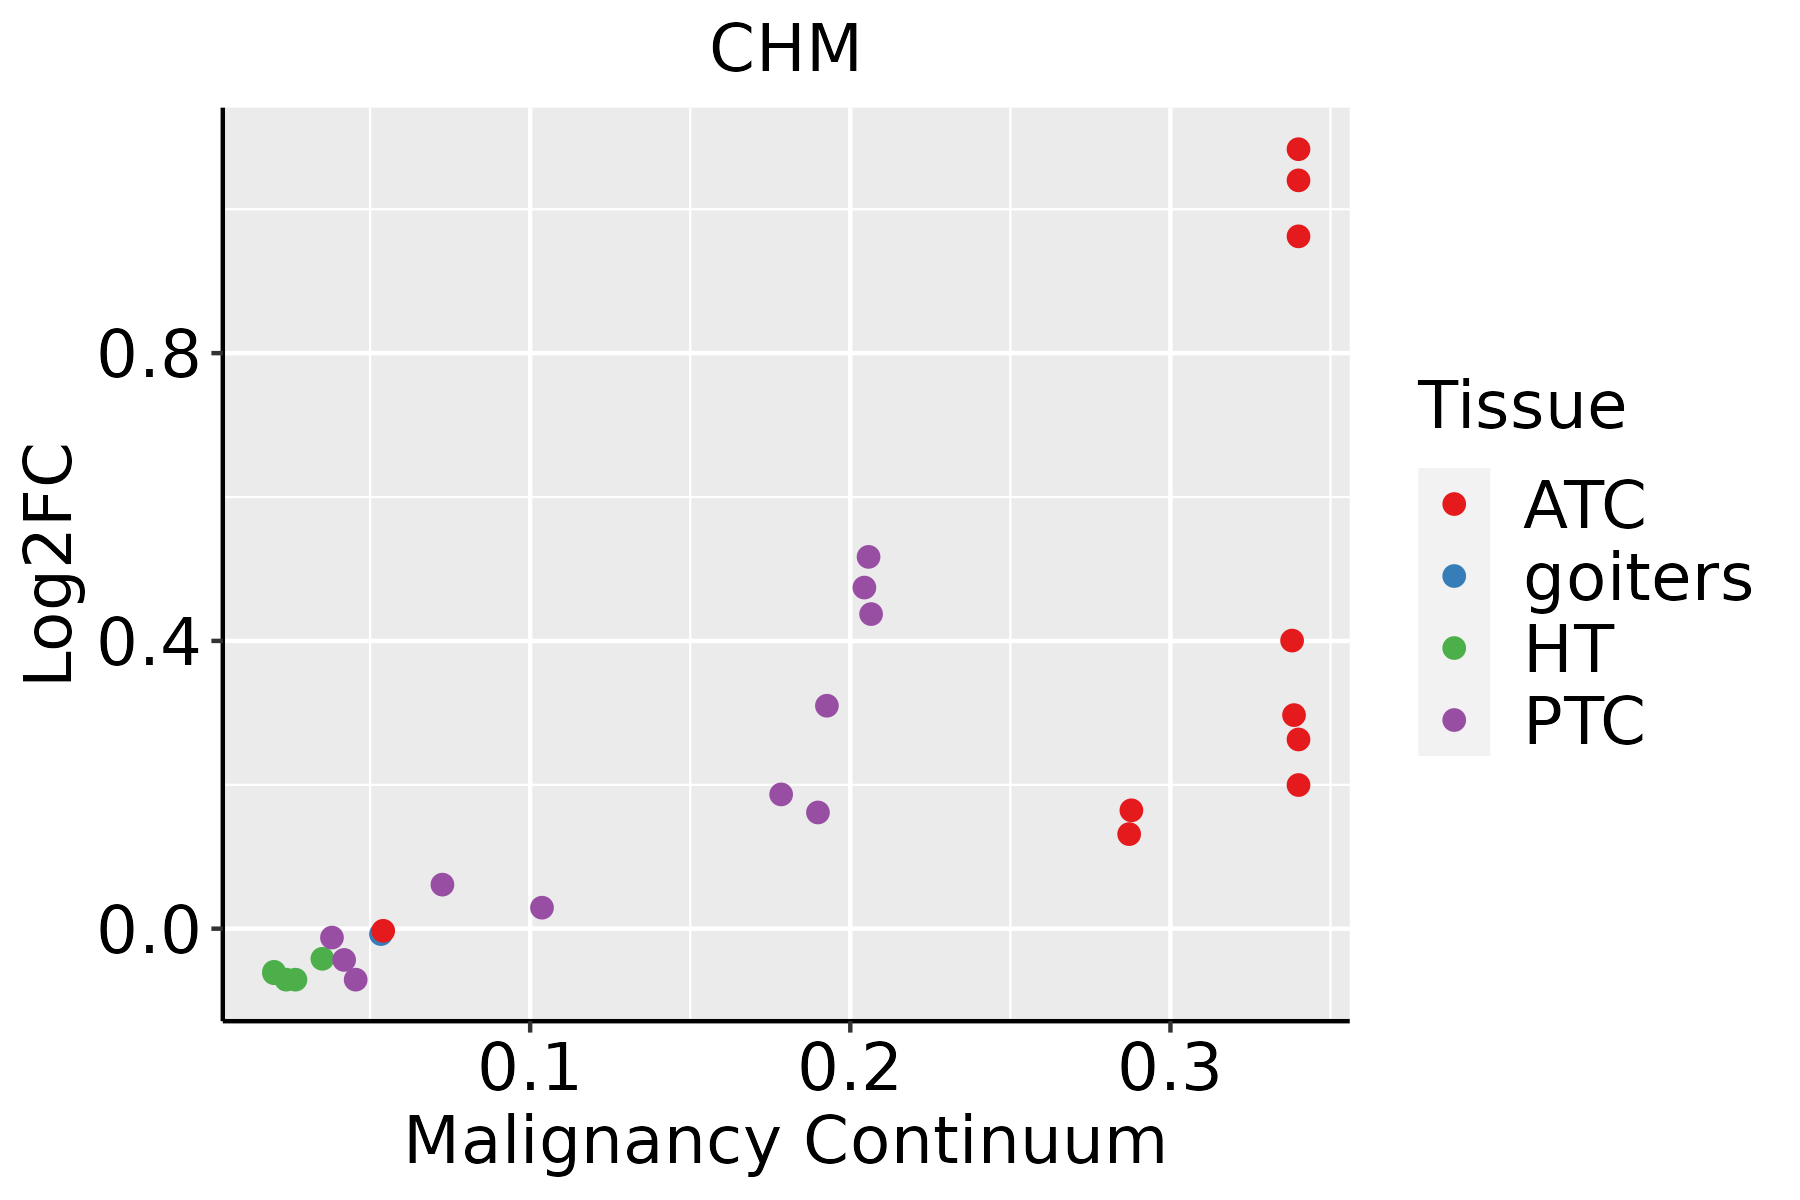 | ATC: Anaplastic thyroid cancer |
| HT: Hashimoto's thyroiditis | ||
| PTC: Papillary thyroid cancer |
| ∗log2FC in expression of this searched gene in stem-like cells from each diseased tissue sample relative to stem-like cells in normal samples in each tissue plotted against the malignancy continuum. Samples are colored based on if they are from different disease stage. |
Top |
Malignant transformation related pathway analysis |
| Find out the enriched GO biological processes and KEGG pathways involved in transition from healthy to precancer to cancer |
| Tissue | Disease Stage | Enriched GO biological Processes |
| Colorectum | AD |  |
| Colorectum | SER |  |
| Colorectum | MSS |  |
| Colorectum | MSI-H |  |
| Colorectum | FAP |  |
| ∗Top 15 enriched GO BP terms are showed in the bar plot of each disease state in each tissue. Each row represents a significant GO biological process which is colored according to the -log10(p.adjust). |
| Page: 1 2 3 4 5 6 7 8 9 |
| GO ID | Tissue | Disease Stage | Description | Gene Ratio | Bg Ratio | pvalue | p.adjust | Count |
| GO:007099728 | Skin | AK | neuron death | 63/1910 | 361/18723 | 1.50e-05 | 2.94e-04 | 63 |
| GO:190121425 | Skin | AK | regulation of neuron death | 57/1910 | 319/18723 | 1.87e-05 | 3.52e-04 | 57 |
| GO:000091017 | Skin | AK | cytokinesis | 36/1910 | 173/18723 | 2.48e-05 | 4.47e-04 | 36 |
| GO:00070594 | Skin | AK | chromosome segregation | 60/1910 | 346/18723 | 2.88e-05 | 4.98e-04 | 60 |
| GO:005125827 | Skin | AK | protein polymerization | 53/1910 | 297/18723 | 3.74e-05 | 6.20e-04 | 53 |
| GO:00070519 | Skin | AK | spindle organization | 37/1910 | 184/18723 | 4.21e-05 | 6.70e-04 | 37 |
| GO:005079226 | Skin | AK | regulation of viral process | 34/1910 | 164/18723 | 4.45e-05 | 7.03e-04 | 34 |
| GO:009006810 | Skin | AK | positive regulation of cell cycle process | 43/1910 | 236/18723 | 1.20e-04 | 1.50e-03 | 43 |
| GO:19021157 | Skin | AK | regulation of organelle assembly | 36/1910 | 186/18723 | 1.21e-04 | 1.50e-03 | 36 |
| GO:003253524 | Skin | AK | regulation of cellular component size | 62/1910 | 383/18723 | 1.66e-04 | 1.94e-03 | 62 |
| GO:000660526 | Skin | AK | protein targeting | 53/1910 | 314/18723 | 1.67e-04 | 1.94e-03 | 53 |
| GO:00705079 | Skin | AK | regulation of microtubule cytoskeleton organization | 30/1910 | 148/18723 | 1.85e-04 | 2.12e-03 | 30 |
| GO:190390026 | Skin | AK | regulation of viral life cycle | 30/1910 | 148/18723 | 1.85e-04 | 2.12e-03 | 30 |
| GO:001619716 | Skin | AK | endosomal transport | 41/1910 | 230/18723 | 2.76e-04 | 2.93e-03 | 41 |
| GO:009015023 | Skin | AK | establishment of protein localization to membrane | 45/1910 | 260/18723 | 2.84e-04 | 2.99e-03 | 45 |
| GO:00008195 | Skin | AK | sister chromatid segregation | 37/1910 | 202/18723 | 3.10e-04 | 3.19e-03 | 37 |
| GO:00901697 | Skin | AK | regulation of spindle assembly | 9/1910 | 25/18723 | 5.25e-04 | 4.79e-03 | 9 |
| GO:00903078 | Skin | AK | mitotic spindle assembly | 16/1910 | 65/18723 | 6.54e-04 | 5.64e-03 | 16 |
| GO:00512257 | Skin | AK | spindle assembly | 24/1910 | 117/18723 | 6.54e-04 | 5.64e-03 | 24 |
| GO:001050618 | Skin | AK | regulation of autophagy | 51/1910 | 317/18723 | 6.97e-04 | 5.96e-03 | 51 |
| Page: 1 2 3 4 5 6 7 8 9 10 11 12 13 14 15 16 17 18 19 20 21 22 23 24 25 26 27 28 29 30 31 32 33 34 35 36 37 38 39 40 41 42 43 44 45 46 47 48 49 50 51 52 53 54 55 56 57 58 59 60 61 62 63 64 65 66 67 68 69 70 71 72 73 74 75 76 77 78 79 80 81 82 83 84 85 86 87 88 89 90 91 92 93 94 95 96 97 98 99 100 101 102 103 104 105 106 107 108 109 110 111 112 113 114 115 116 117 118 |
| Pathway ID | Tissue | Disease Stage | Description | Gene Ratio | Bg Ratio | pvalue | p.adjust | qvalue | Count |
| Page: 1 |
Top |
Cell-cell communication analysis |
| Identification of potential cell-cell interactions between two cell types and their ligand-receptor pairs for different disease states |
| Ligand | Receptor | LRpair | Pathway | Tissue | Disease Stage |
| Page: 1 |
Top |
Single-cell gene regulatory network inference analysis |
| Find out the significant the regulons (TFs) and the target genes of each regulon across cell types for different disease states |
| TF | Cell Type | Tissue | Disease Stage | Target Gene | RSS | Regulon Activity |
| ∗The dot plots of a searched regulon are shown for all cell subpopulations in each disease state of each tissue based on the regulon specific score inferred using pySCENIC and by calculating the average expression. |
| Page: 1 |
Top |
Somatic mutation of malignant transformation related genes |
| Annotation of somatic variants for genes involved in malignant transformation |
| Hugo Symbol | Variant Class | Variant Classification | dbSNP RS | HGVSc | HGVSp | HGVSp Short | SWISSPROT | BIOTYPE | SIFT | PolyPhen | Tumor Sample Barcode | Tissue | Histology | Sex | Age | Stage | Therapy Types | Drugs | Outcome |
| CHM | SNV | Missense_Mutation | rs746300399 | c.10N>G | p.Thr4Ala | p.T4A | P24386 | protein_coding | tolerated(0.05) | benign(0.001) | TCGA-A2-A3XY-01 | Breast | breast invasive carcinoma | Female | <65 | I/II | Chemotherapy | adriamycin | PD |
| CHM | SNV | Missense_Mutation | c.741N>G | p.Ile247Met | p.I247M | P24386 | protein_coding | deleterious(0) | probably_damaging(1) | TCGA-AC-A23H-01 | Breast | breast invasive carcinoma | Female | >=65 | I/II | Unknown | Unknown | PD | |
| CHM | SNV | Missense_Mutation | c.1462C>T | p.Arg488Trp | p.R488W | P24386 | protein_coding | deleterious(0.02) | probably_damaging(0.988) | TCGA-AN-A046-01 | Breast | breast invasive carcinoma | Female | >=65 | I/II | Unknown | Unknown | SD | |
| CHM | SNV | Missense_Mutation | c.158N>T | p.Ser53Leu | p.S53L | P24386 | protein_coding | deleterious(0.01) | benign(0.408) | TCGA-D8-A1JN-01 | Breast | breast invasive carcinoma | Female | >=65 | III/IV | Hormone Therapy | anastrozolum | SD | |
| CHM | SNV | Missense_Mutation | c.1093C>A | p.Leu365Ile | p.L365I | P24386 | protein_coding | deleterious(0) | probably_damaging(1) | TCGA-D8-A1XQ-01 | Breast | breast invasive carcinoma | Female | >=65 | I/II | Unknown | Unknown | SD | |
| CHM | SNV | Missense_Mutation | novel | c.888G>A | p.Met296Ile | p.M296I | P24386 | protein_coding | deleterious(0.02) | possibly_damaging(0.551) | TCGA-LL-A9Q3-01 | Breast | breast invasive carcinoma | Female | >=65 | III/IV | Immunotherapy | herceptin | CR |
| CHM | SNV | Missense_Mutation | novel | c.1061N>A | p.Gly354Asp | p.G354D | P24386 | protein_coding | deleterious(0) | probably_damaging(0.999) | TCGA-2W-A8YY-01 | Cervix | cervical & endocervical cancer | Female | <65 | I/II | Chemotherapy | cisplatin | CR |
| CHM | SNV | Missense_Mutation | novel | c.180N>T | p.Lys60Asn | p.K60N | P24386 | protein_coding | deleterious(0.04) | benign(0.02) | TCGA-2W-A8YY-01 | Cervix | cervical & endocervical cancer | Female | <65 | I/II | Chemotherapy | cisplatin | CR |
| CHM | SNV | Missense_Mutation | c.677G>T | p.Arg226Ile | p.R226I | P24386 | protein_coding | deleterious(0) | probably_damaging(0.942) | TCGA-FU-A3HZ-01 | Cervix | cervical & endocervical cancer | Female | <65 | I/II | Chemotherapy | cisplatin | CR | |
| CHM | SNV | Missense_Mutation | rs780111922 | c.1727N>G | p.Ser576Cys | p.S576C | P24386 | protein_coding | deleterious(0.01) | benign(0.324) | TCGA-Q1-A73S-01 | Cervix | cervical & endocervical cancer | Female | <65 | I/II | Chemotherapy | cisplatin | SD |
| Page: 1 2 3 4 5 6 7 8 9 10 11 |
Top |
Related drugs of malignant transformation related genes |
| Identification of chemicals and drugs interact with genes involved in malignant transfromation |
| (DGIdb 4.0) |
| Entrez ID | Symbol | Category | Interaction Types | Drug Claim Name | Drug Name | PMIDs |
| Page: 1 |

Copyright 2023-Present -The University of Texas Health Science Center at Houston |