
|
|||||
|
 | |
| |
| |
| |
| |
| |
|
Gene: CDK5 |
Gene summary for CDK5 |
| Gene information | Species | Human | Gene symbol | CDK5 | Gene ID | 1020 |
| Gene name | cyclin dependent kinase 5 | |
| Gene Alias | LIS7 | |
| Cytomap | 7q36.1 | |
| Gene Type | protein-coding | GO ID | GO:0000082 | UniProtAcc | A0A0S2Z355 |
Top |
Malignant transformation analysis |
| Identification of the aberrant gene expression in precancerous and cancerous lesions by comparing the gene expression of stem-like cells in diseased tissues with normal stem cells |
| Entrez ID | Symbol | Replicates | Species | Organ | Tissue | Adj P-value | Log2FC | Malignancy |
| 1020 | CDK5 | LZE4T | Human | Esophagus | ESCC | 4.55e-06 | 1.94e-01 | 0.0811 |
| 1020 | CDK5 | LZE7T | Human | Esophagus | ESCC | 1.88e-02 | 3.23e-01 | 0.0667 |
| 1020 | CDK5 | LZE8T | Human | Esophagus | ESCC | 2.31e-02 | 1.73e-01 | 0.067 |
| 1020 | CDK5 | LZE24T | Human | Esophagus | ESCC | 6.38e-13 | 3.69e-01 | 0.0596 |
| 1020 | CDK5 | LZE6T | Human | Esophagus | ESCC | 1.64e-08 | 2.98e-01 | 0.0845 |
| 1020 | CDK5 | P1T-E | Human | Esophagus | ESCC | 5.30e-03 | 2.31e-01 | 0.0875 |
| 1020 | CDK5 | P2T-E | Human | Esophagus | ESCC | 1.29e-08 | 1.67e-01 | 0.1177 |
| 1020 | CDK5 | P4T-E | Human | Esophagus | ESCC | 8.04e-31 | 6.63e-01 | 0.1323 |
| 1020 | CDK5 | P5T-E | Human | Esophagus | ESCC | 6.16e-15 | 3.12e-01 | 0.1327 |
| 1020 | CDK5 | P8T-E | Human | Esophagus | ESCC | 4.46e-10 | 2.21e-01 | 0.0889 |
| 1020 | CDK5 | P9T-E | Human | Esophagus | ESCC | 5.88e-16 | 4.02e-01 | 0.1131 |
| 1020 | CDK5 | P10T-E | Human | Esophagus | ESCC | 6.10e-17 | 2.89e-01 | 0.116 |
| 1020 | CDK5 | P11T-E | Human | Esophagus | ESCC | 3.64e-04 | 2.24e-01 | 0.1426 |
| 1020 | CDK5 | P12T-E | Human | Esophagus | ESCC | 4.27e-36 | 6.45e-01 | 0.1122 |
| 1020 | CDK5 | P15T-E | Human | Esophagus | ESCC | 2.85e-22 | 4.85e-01 | 0.1149 |
| 1020 | CDK5 | P16T-E | Human | Esophagus | ESCC | 9.14e-22 | 3.63e-01 | 0.1153 |
| 1020 | CDK5 | P17T-E | Human | Esophagus | ESCC | 2.51e-02 | 1.94e-01 | 0.1278 |
| 1020 | CDK5 | P19T-E | Human | Esophagus | ESCC | 1.55e-09 | 7.40e-01 | 0.1662 |
| 1020 | CDK5 | P20T-E | Human | Esophagus | ESCC | 1.54e-10 | 2.51e-01 | 0.1124 |
| 1020 | CDK5 | P21T-E | Human | Esophagus | ESCC | 2.23e-40 | 7.61e-01 | 0.1617 |
| Page: 1 2 3 4 5 |
| Tissue | Expression Dynamics | Abbreviation |
| Esophagus |  | ESCC: Esophageal squamous cell carcinoma |
| HGIN: High-grade intraepithelial neoplasias | ||
| LGIN: Low-grade intraepithelial neoplasias | ||
| Liver | 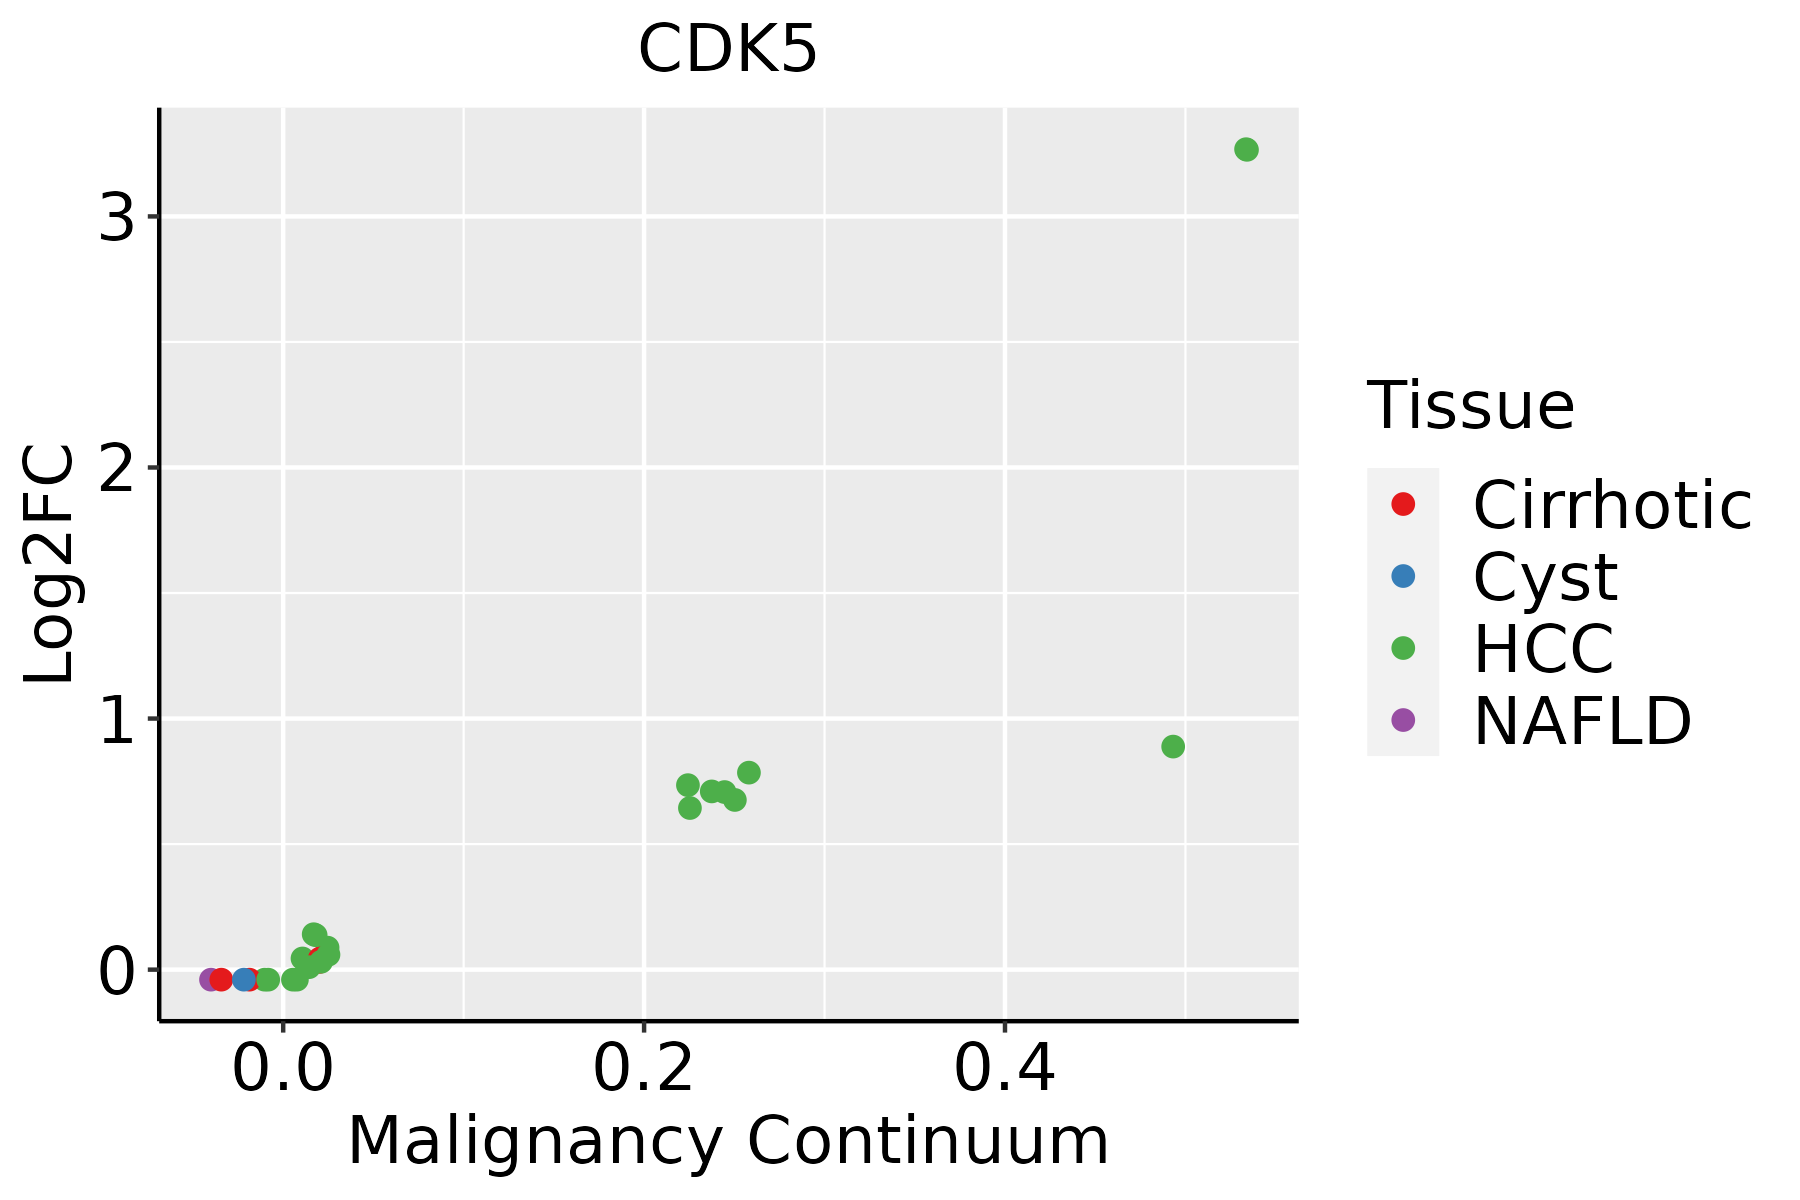 | HCC: Hepatocellular carcinoma |
| NAFLD: Non-alcoholic fatty liver disease | ||
| Oral Cavity | 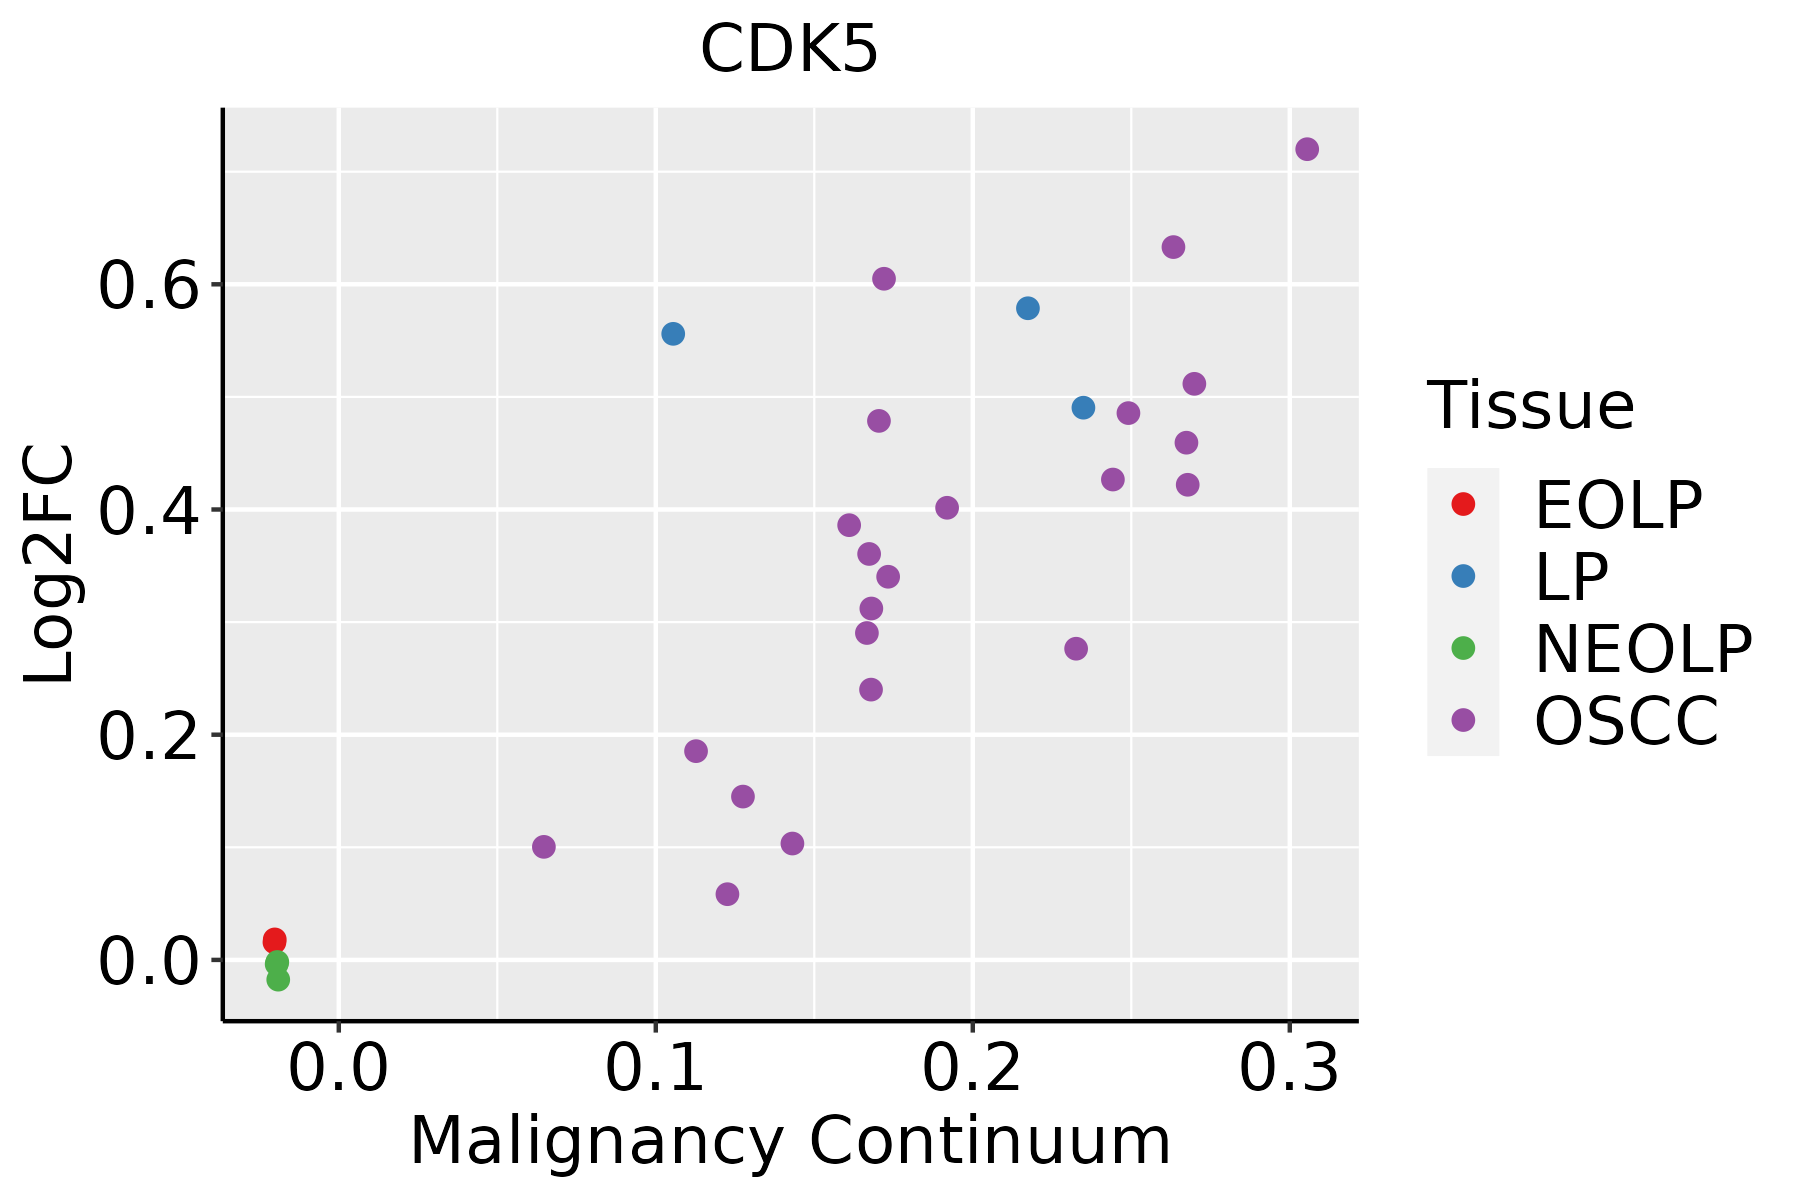 | EOLP: Erosive Oral lichen planus |
| LP: leukoplakia | ||
| NEOLP: Non-erosive oral lichen planus | ||
| OSCC: Oral squamous cell carcinoma | ||
| Thyroid | 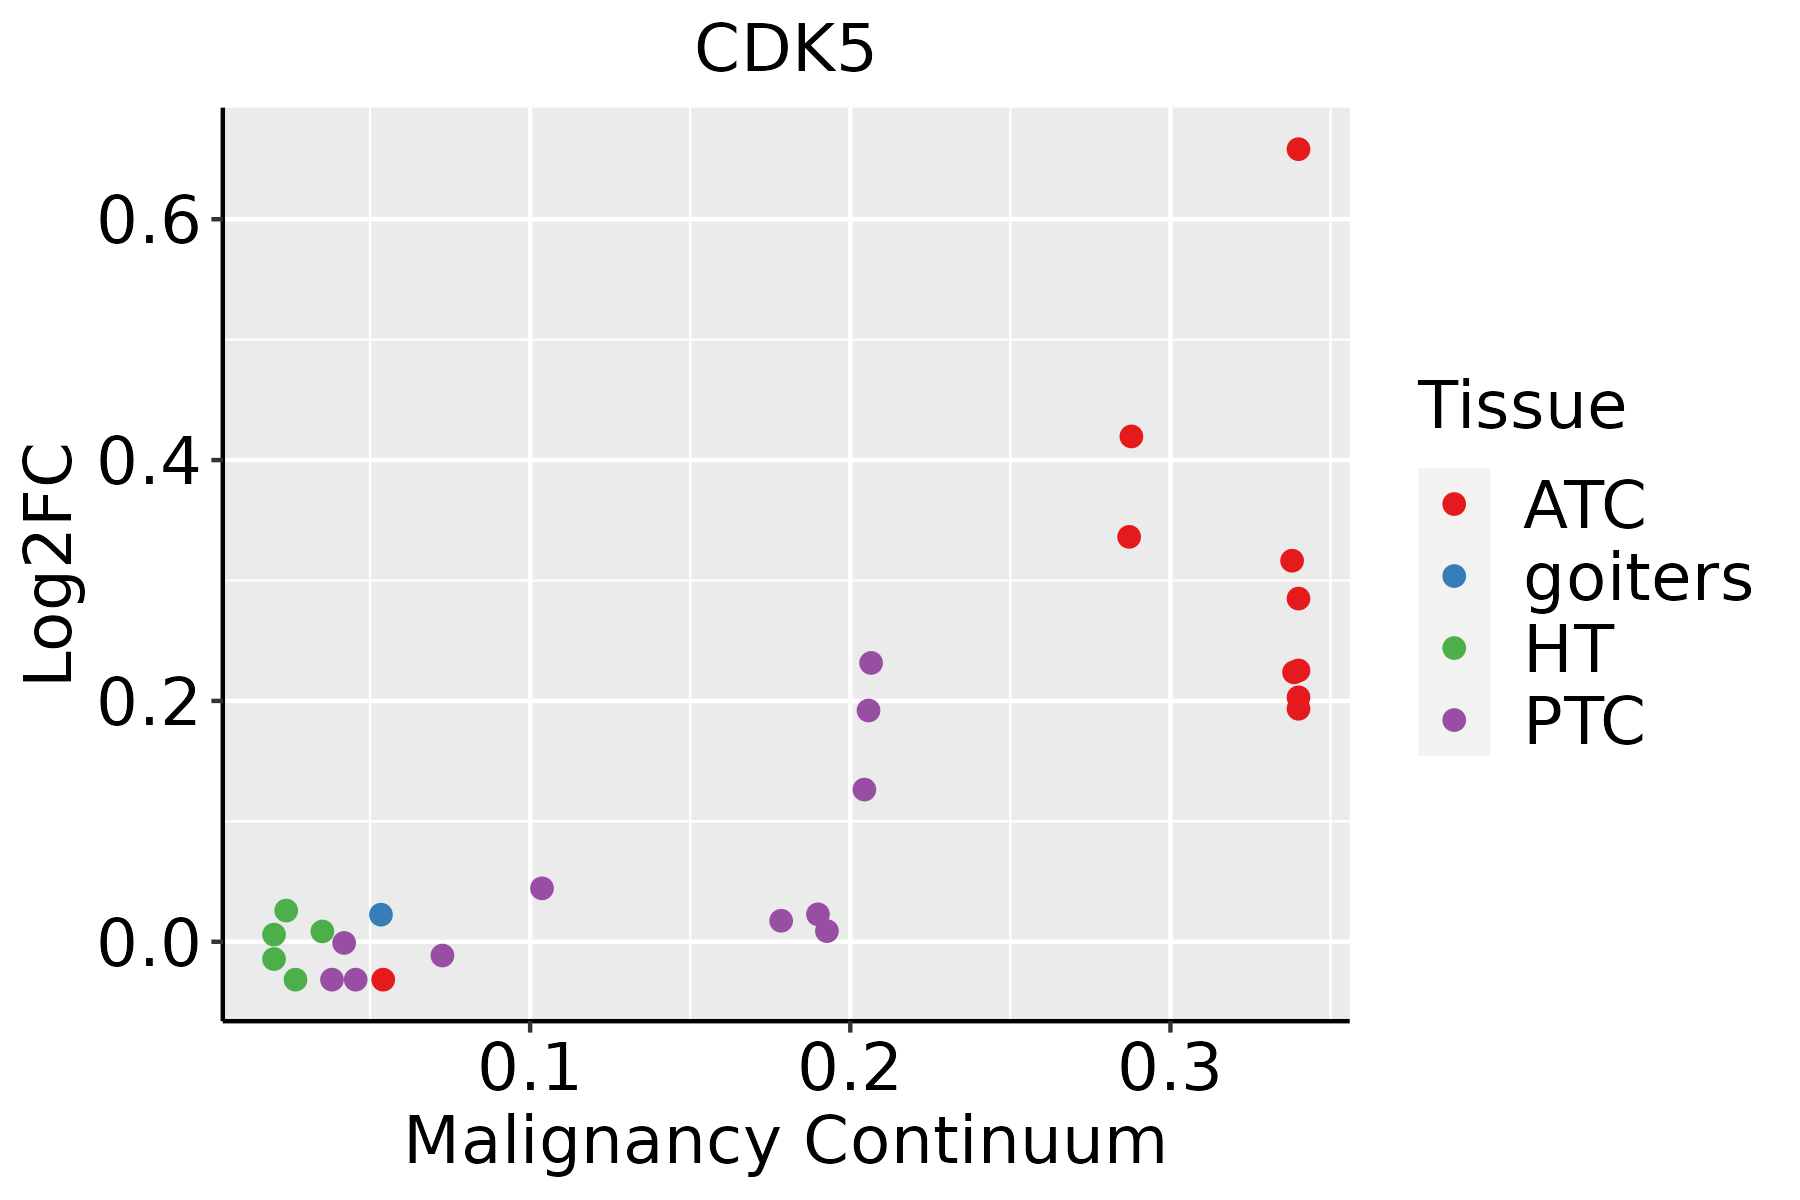 | ATC: Anaplastic thyroid cancer |
| HT: Hashimoto's thyroiditis | ||
| PTC: Papillary thyroid cancer |
| ∗log2FC in expression of this searched gene in stem-like cells from each diseased tissue sample relative to stem-like cells in normal samples in each tissue plotted against the malignancy continuum. Samples are colored based on if they are from different disease stage. |
Top |
Malignant transformation related pathway analysis |
| Find out the enriched GO biological processes and KEGG pathways involved in transition from healthy to precancer to cancer |
| Tissue | Disease Stage | Enriched GO biological Processes |
| Colorectum | AD |  |
| Colorectum | SER |  |
| Colorectum | MSS |  |
| Colorectum | MSI-H |  |
| Colorectum | FAP |  |
| ∗Top 15 enriched GO BP terms are showed in the bar plot of each disease state in each tissue. Each row represents a significant GO biological process which is colored according to the -log10(p.adjust). |
| Page: 1 2 3 4 5 6 7 8 9 |
| GO ID | Tissue | Disease Stage | Description | Gene Ratio | Bg Ratio | pvalue | p.adjust | Count |
| GO:000007912 | Thyroid | PTC | regulation of cyclin-dependent protein serine/threonine kinase activity | 47/5968 | 94/18723 | 1.90e-04 | 1.42e-03 | 47 |
| GO:00991754 | Thyroid | PTC | regulation of postsynapse organization | 45/5968 | 90/18723 | 2.57e-04 | 1.84e-03 | 45 |
| GO:00305167 | Thyroid | PTC | regulation of axon extension | 47/5968 | 95/18723 | 2.60e-04 | 1.86e-03 | 47 |
| GO:00109486 | Thyroid | PTC | negative regulation of cell cycle process | 122/5968 | 294/18723 | 2.94e-04 | 2.08e-03 | 122 |
| GO:00311105 | Thyroid | PTC | regulation of microtubule polymerization or depolymerization | 44/5968 | 88/18723 | 3.00e-04 | 2.11e-03 | 44 |
| GO:19049507 | Thyroid | PTC | negative regulation of establishment of protein localization | 61/5968 | 131/18723 | 3.01e-04 | 2.12e-03 | 61 |
| GO:20012515 | Thyroid | PTC | negative regulation of chromosome organization | 43/5968 | 86/18723 | 3.49e-04 | 2.40e-03 | 43 |
| GO:005149419 | Thyroid | PTC | negative regulation of cytoskeleton organization | 73/5968 | 163/18723 | 3.59e-04 | 2.44e-03 | 73 |
| GO:00109778 | Thyroid | PTC | negative regulation of neuron projection development | 63/5968 | 137/18723 | 3.70e-04 | 2.50e-03 | 63 |
| GO:004592614 | Thyroid | PTC | negative regulation of growth | 105/5968 | 249/18723 | 3.76e-04 | 2.54e-03 | 105 |
| GO:00512246 | Thyroid | PTC | negative regulation of protein transport | 59/5968 | 127/18723 | 4.04e-04 | 2.71e-03 | 59 |
| GO:00311096 | Thyroid | PTC | microtubule polymerization or depolymerization | 57/5968 | 122/18723 | 4.19e-04 | 2.81e-03 | 57 |
| GO:00310235 | Thyroid | PTC | microtubule organizing center organization | 65/5968 | 143/18723 | 4.48e-04 | 2.96e-03 | 65 |
| GO:00613873 | Thyroid | PTC | regulation of extent of cell growth | 52/5968 | 110/18723 | 5.20e-04 | 3.37e-03 | 52 |
| GO:19019885 | Thyroid | PTC | negative regulation of cell cycle phase transition | 104/5968 | 249/18723 | 6.01e-04 | 3.82e-03 | 104 |
| GO:00000866 | Thyroid | PTC | G2/M transition of mitotic cell cycle | 62/5968 | 137/18723 | 6.89e-04 | 4.32e-03 | 62 |
| GO:00070984 | Thyroid | PTC | centrosome cycle | 59/5968 | 130/18723 | 8.39e-04 | 5.16e-03 | 59 |
| GO:007190112 | Thyroid | PTC | negative regulation of protein serine/threonine kinase activity | 55/5968 | 120/18723 | 9.30e-04 | 5.65e-03 | 55 |
| GO:00482855 | Thyroid | PTC | organelle fission | 188/5968 | 488/18723 | 9.64e-04 | 5.77e-03 | 188 |
| GO:00070885 | Thyroid | PTC | regulation of mitotic nuclear division | 51/5968 | 110/18723 | 1.02e-03 | 6.07e-03 | 51 |
| Page: 1 2 3 4 5 6 7 8 9 10 11 12 13 14 15 16 17 18 19 20 21 22 23 24 25 26 27 28 29 30 31 32 33 34 35 36 37 38 39 40 41 42 43 44 45 46 47 48 49 50 51 52 53 54 55 56 57 58 59 60 61 62 63 64 65 66 67 68 69 70 71 72 73 74 75 76 77 78 79 80 81 82 83 84 85 86 87 88 89 90 91 92 93 94 95 96 97 98 99 100 |
| Pathway ID | Tissue | Disease Stage | Description | Gene Ratio | Bg Ratio | pvalue | p.adjust | qvalue | Count |
| hsa05022210 | Esophagus | ESCC | Pathways of neurodegeneration - multiple diseases | 318/4205 | 476/8465 | 6.10e-15 | 2.04e-13 | 1.05e-13 | 318 |
| hsa05010210 | Esophagus | ESCC | Alzheimer disease | 263/4205 | 384/8465 | 1.80e-14 | 5.47e-13 | 2.80e-13 | 263 |
| hsa0436016 | Esophagus | ESCC | Axon guidance | 108/4205 | 182/8465 | 5.13e-03 | 1.30e-02 | 6.67e-03 | 108 |
| hsa0502238 | Esophagus | ESCC | Pathways of neurodegeneration - multiple diseases | 318/4205 | 476/8465 | 6.10e-15 | 2.04e-13 | 1.05e-13 | 318 |
| hsa0501038 | Esophagus | ESCC | Alzheimer disease | 263/4205 | 384/8465 | 1.80e-14 | 5.47e-13 | 2.80e-13 | 263 |
| hsa0436017 | Esophagus | ESCC | Axon guidance | 108/4205 | 182/8465 | 5.13e-03 | 1.30e-02 | 6.67e-03 | 108 |
| hsa0501022 | Liver | HCC | Alzheimer disease | 254/4020 | 384/8465 | 3.75e-14 | 8.97e-13 | 4.99e-13 | 254 |
| hsa0502222 | Liver | HCC | Pathways of neurodegeneration - multiple diseases | 298/4020 | 476/8465 | 6.59e-12 | 1.30e-10 | 7.22e-11 | 298 |
| hsa0501032 | Liver | HCC | Alzheimer disease | 254/4020 | 384/8465 | 3.75e-14 | 8.97e-13 | 4.99e-13 | 254 |
| hsa0502232 | Liver | HCC | Pathways of neurodegeneration - multiple diseases | 298/4020 | 476/8465 | 6.59e-12 | 1.30e-10 | 7.22e-11 | 298 |
| hsa0501028 | Oral cavity | OSCC | Alzheimer disease | 244/3704 | 384/8465 | 1.18e-15 | 3.60e-14 | 1.83e-14 | 244 |
| hsa0502228 | Oral cavity | OSCC | Pathways of neurodegeneration - multiple diseases | 292/3704 | 476/8465 | 1.60e-15 | 4.47e-14 | 2.28e-14 | 292 |
| hsa0436014 | Oral cavity | OSCC | Axon guidance | 97/3704 | 182/8465 | 5.59e-03 | 1.33e-02 | 6.76e-03 | 97 |
| hsa05010112 | Oral cavity | OSCC | Alzheimer disease | 244/3704 | 384/8465 | 1.18e-15 | 3.60e-14 | 1.83e-14 | 244 |
| hsa05022112 | Oral cavity | OSCC | Pathways of neurodegeneration - multiple diseases | 292/3704 | 476/8465 | 1.60e-15 | 4.47e-14 | 2.28e-14 | 292 |
| hsa0436015 | Oral cavity | OSCC | Axon guidance | 97/3704 | 182/8465 | 5.59e-03 | 1.33e-02 | 6.76e-03 | 97 |
| hsa0501029 | Oral cavity | LP | Alzheimer disease | 197/2418 | 384/8465 | 6.66e-22 | 3.69e-20 | 2.38e-20 | 197 |
| hsa0502229 | Oral cavity | LP | Pathways of neurodegeneration - multiple diseases | 232/2418 | 476/8465 | 7.77e-22 | 3.69e-20 | 2.38e-20 | 232 |
| hsa0501037 | Oral cavity | LP | Alzheimer disease | 197/2418 | 384/8465 | 6.66e-22 | 3.69e-20 | 2.38e-20 | 197 |
| hsa0502237 | Oral cavity | LP | Pathways of neurodegeneration - multiple diseases | 232/2418 | 476/8465 | 7.77e-22 | 3.69e-20 | 2.38e-20 | 232 |
| Page: 1 |
Top |
Cell-cell communication analysis |
| Identification of potential cell-cell interactions between two cell types and their ligand-receptor pairs for different disease states |
| Ligand | Receptor | LRpair | Pathway | Tissue | Disease Stage |
| Page: 1 |
Top |
Single-cell gene regulatory network inference analysis |
| Find out the significant the regulons (TFs) and the target genes of each regulon across cell types for different disease states |
| TF | Cell Type | Tissue | Disease Stage | Target Gene | RSS | Regulon Activity |
| ∗The dot plots of a searched regulon are shown for all cell subpopulations in each disease state of each tissue based on the regulon specific score inferred using pySCENIC and by calculating the average expression. |
| Page: 1 |
Top |
Somatic mutation of malignant transformation related genes |
| Annotation of somatic variants for genes involved in malignant transformation |
| Hugo Symbol | Variant Class | Variant Classification | dbSNP RS | HGVSc | HGVSp | HGVSp Short | SWISSPROT | BIOTYPE | SIFT | PolyPhen | Tumor Sample Barcode | Tissue | Histology | Sex | Age | Stage | Therapy Types | Drugs | Outcome |
| CDK5 | SNV | Missense_Mutation | novel | c.295G>A | p.Asp99Asn | p.D99N | Q00535 | protein_coding | tolerated(0.13) | benign(0.251) | TCGA-AN-A046-01 | Breast | breast invasive carcinoma | Female | >=65 | I/II | Unknown | Unknown | SD |
| CDK5 | SNV | Missense_Mutation | c.484N>T | p.Val162Leu | p.V162L | Q00535 | protein_coding | deleterious(0) | probably_damaging(0.969) | TCGA-BH-A1EO-01 | Breast | breast invasive carcinoma | Female | >=65 | I/II | Unknown | Unknown | SD | |
| CDK5 | SNV | Missense_Mutation | c.301N>C | p.Glu101Gln | p.E101Q | Q00535 | protein_coding | tolerated(0.6) | benign(0.001) | TCGA-D8-A1JA-01 | Breast | breast invasive carcinoma | Female | <65 | III/IV | Chemotherapy | adriamycin | PD | |
| CDK5 | SNV | Missense_Mutation | novel | c.488N>G | p.Val163Gly | p.V163G | Q00535 | protein_coding | deleterious(0) | probably_damaging(1) | TCGA-AA-A00N-01 | Colorectum | colon adenocarcinoma | Male | >=65 | I/II | Unknown | Unknown | PD |
| CDK5 | SNV | Missense_Mutation | c.149N>A | p.Arg50Gln | p.R50Q | Q00535 | protein_coding | deleterious(0.02) | possibly_damaging(0.876) | TCGA-AY-6197-01 | Colorectum | colon adenocarcinoma | Male | <65 | I/II | Unknown | Unknown | SD | |
| CDK5 | SNV | Missense_Mutation | novel | c.271N>G | p.Phe91Val | p.F91V | Q00535 | protein_coding | deleterious(0) | possibly_damaging(0.806) | TCGA-AZ-4315-01 | Colorectum | colon adenocarcinoma | Male | <65 | I/II | Unknown | Unknown | SD |
| CDK5 | SNV | Missense_Mutation | novel | c.31G>T | p.Gly11Trp | p.G11W | Q00535 | protein_coding | deleterious(0) | probably_damaging(1) | TCGA-CM-5860-01 | Colorectum | colon adenocarcinoma | Male | <65 | I/II | Ancillary | leucovorin | SD |
| CDK5 | SNV | Missense_Mutation | c.599G>A | p.Arg200Gln | p.R200Q | Q00535 | protein_coding | tolerated(0.14) | benign(0.011) | TCGA-DC-5869-01 | Colorectum | rectum adenocarcinoma | Female | <65 | III/IV | Unknown | Unknown | SD | |
| CDK5 | SNV | Missense_Mutation | rs548208867 | c.821N>A | p.Arg274His | p.R274H | Q00535 | protein_coding | deleterious(0.03) | probably_damaging(0.989) | TCGA-A5-A2K3-01 | Endometrium | uterine corpus endometrioid carcinoma | Female | >=65 | I/II | Chemotherapy | carboplatin | SD |
| CDK5 | SNV | Missense_Mutation | novel | c.846N>T | p.Gln282His | p.Q282H | Q00535 | protein_coding | tolerated(0.13) | benign(0.369) | TCGA-AJ-A3EK-01 | Endometrium | uterine corpus endometrioid carcinoma | Female | <65 | I/II | Chemotherapy | carboplatin | CR |
| Page: 1 2 3 4 |
Top |
Related drugs of malignant transformation related genes |
| Identification of chemicals and drugs interact with genes involved in malignant transfromation |
| (DGIdb 4.0) |
| Entrez ID | Symbol | Category | Interaction Types | Drug Claim Name | Drug Name | PMIDs |
| 1020 | CDK5 | SERINE THREONINE KINASE, KINASE, TUMOR SUPPRESSOR, DRUGGABLE GENOME, ENZYME | TAE-684 | TAE-684 | ||
| 1020 | CDK5 | SERINE THREONINE KINASE, KINASE, TUMOR SUPPRESSOR, DRUGGABLE GENOME, ENZYME | (RS)-ROSCOVITINE | (RS)-ROSCOVITINE | ||
| 1020 | CDK5 | SERINE THREONINE KINASE, KINASE, TUMOR SUPPRESSOR, DRUGGABLE GENOME, ENZYME | GW441756X | GW441756X | ||
| 1020 | CDK5 | SERINE THREONINE KINASE, KINASE, TUMOR SUPPRESSOR, DRUGGABLE GENOME, ENZYME | LY-2090314 | LY-2090314 | ||
| 1020 | CDK5 | SERINE THREONINE KINASE, KINASE, TUMOR SUPPRESSOR, DRUGGABLE GENOME, ENZYME | PALBOCICLIB | PALBOCICLIB | ||
| 1020 | CDK5 | SERINE THREONINE KINASE, KINASE, TUMOR SUPPRESSOR, DRUGGABLE GENOME, ENZYME | inhibitor | 178102290 | AT-7519 | |
| 1020 | CDK5 | SERINE THREONINE KINASE, KINASE, TUMOR SUPPRESSOR, DRUGGABLE GENOME, ENZYME | PMID26161698-Compound-18 | |||
| 1020 | CDK5 | SERINE THREONINE KINASE, KINASE, TUMOR SUPPRESSOR, DRUGGABLE GENOME, ENZYME | inhibitor | 178102572 | ||
| 1020 | CDK5 | SERINE THREONINE KINASE, KINASE, TUMOR SUPPRESSOR, DRUGGABLE GENOME, ENZYME | inhibitor | CHEMBL445813 | AT-7519 | |
| 1020 | CDK5 | SERINE THREONINE KINASE, KINASE, TUMOR SUPPRESSOR, DRUGGABLE GENOME, ENZYME | JNJ-7706621 | JNJ-7706621 |
| Page: 1 2 3 4 5 6 7 8 |

Copyright 2023-Present -The University of Texas Health Science Center at Houston |