
|
|||||
|
 | |
| |
| |
| |
| |
| |
|
Gene: KLF4 |
Gene summary for KLF4 |
| Gene information | Species | Human | Gene symbol | KLF4 | Gene ID | 9314 |
| Gene name | Kruppel like factor 4 | |
| Gene Alias | EZF | |
| Cytomap | 9q31.2 | |
| Gene Type | protein-coding | GO ID | GO:0000082 | UniProtAcc | O43474 |
Top |
Malignant transformation analysis |
| Identification of the aberrant gene expression in precancerous and cancerous lesions by comparing the gene expression of stem-like cells in diseased tissues with normal stem cells |
| Entrez ID | Symbol | Replicates | Species | Organ | Tissue | Adj P-value | Log2FC | Malignancy |
| 9314 | KLF4 | CA_HPV_3 | Human | Cervix | CC | 2.78e-09 | 2.73e-01 | 0.0414 |
| 9314 | KLF4 | HSIL_HPV_2 | Human | Cervix | HSIL_HPV | 1.73e-02 | -2.92e-01 | 0.0208 |
| 9314 | KLF4 | N_HPV_2 | Human | Cervix | N_HPV | 5.57e-11 | 2.85e-01 | -0.0131 |
| 9314 | KLF4 | CCII_1 | Human | Cervix | CC | 4.09e-02 | -3.41e-01 | 0.3249 |
| 9314 | KLF4 | sample3 | Human | Cervix | CC | 2.43e-05 | 4.69e-02 | 0.1387 |
| 9314 | KLF4 | T2 | Human | Cervix | CC | 4.17e-09 | 8.02e-01 | 0.0709 |
| 9314 | KLF4 | HTA11_2487_2000001011 | Human | Colorectum | SER | 2.28e-04 | 5.08e-01 | -0.1808 |
| 9314 | KLF4 | HTA11_78_2000001011 | Human | Colorectum | AD | 6.34e-17 | 7.28e-01 | -0.1088 |
| 9314 | KLF4 | HTA11_347_2000001011 | Human | Colorectum | AD | 3.01e-18 | 6.88e-01 | -0.1954 |
| 9314 | KLF4 | HTA11_411_2000001011 | Human | Colorectum | SER | 5.63e-06 | 1.15e+00 | -0.2602 |
| 9314 | KLF4 | HTA11_696_2000001011 | Human | Colorectum | AD | 1.49e-07 | 3.69e-01 | -0.1464 |
| 9314 | KLF4 | HTA11_2992_2000001011 | Human | Colorectum | SER | 1.51e-04 | 6.77e-01 | -0.1706 |
| 9314 | KLF4 | HTA11_5212_2000001011 | Human | Colorectum | AD | 2.05e-10 | 8.73e-01 | -0.2061 |
| 9314 | KLF4 | F034 | Human | Colorectum | FAP | 4.69e-02 | -1.81e-01 | -0.0665 |
| 9314 | KLF4 | EEC-subject1 | Human | Endometrium | EEC | 4.02e-03 | -2.94e-01 | -0.2682 |
| 9314 | KLF4 | EEC-subject3 | Human | Endometrium | EEC | 1.56e-05 | -1.36e-01 | -0.2525 |
| 9314 | KLF4 | GSM5276935 | Human | Endometrium | EEC | 5.71e-06 | -3.79e-01 | -0.123 |
| 9314 | KLF4 | GSM5276937 | Human | Endometrium | EEC | 1.08e-03 | -3.58e-01 | -0.0897 |
| 9314 | KLF4 | GSM6177620_NYU_UCEC1_lib1_lib1 | Human | Endometrium | EEC | 2.46e-08 | -3.74e-01 | -0.1869 |
| 9314 | KLF4 | GSM6177620_NYU_UCEC1_lib2_lib2 | Human | Endometrium | EEC | 1.27e-10 | -4.68e-01 | -0.1875 |
| Page: 1 2 3 4 5 6 7 8 9 |
| Tissue | Expression Dynamics | Abbreviation |
| Cervix | 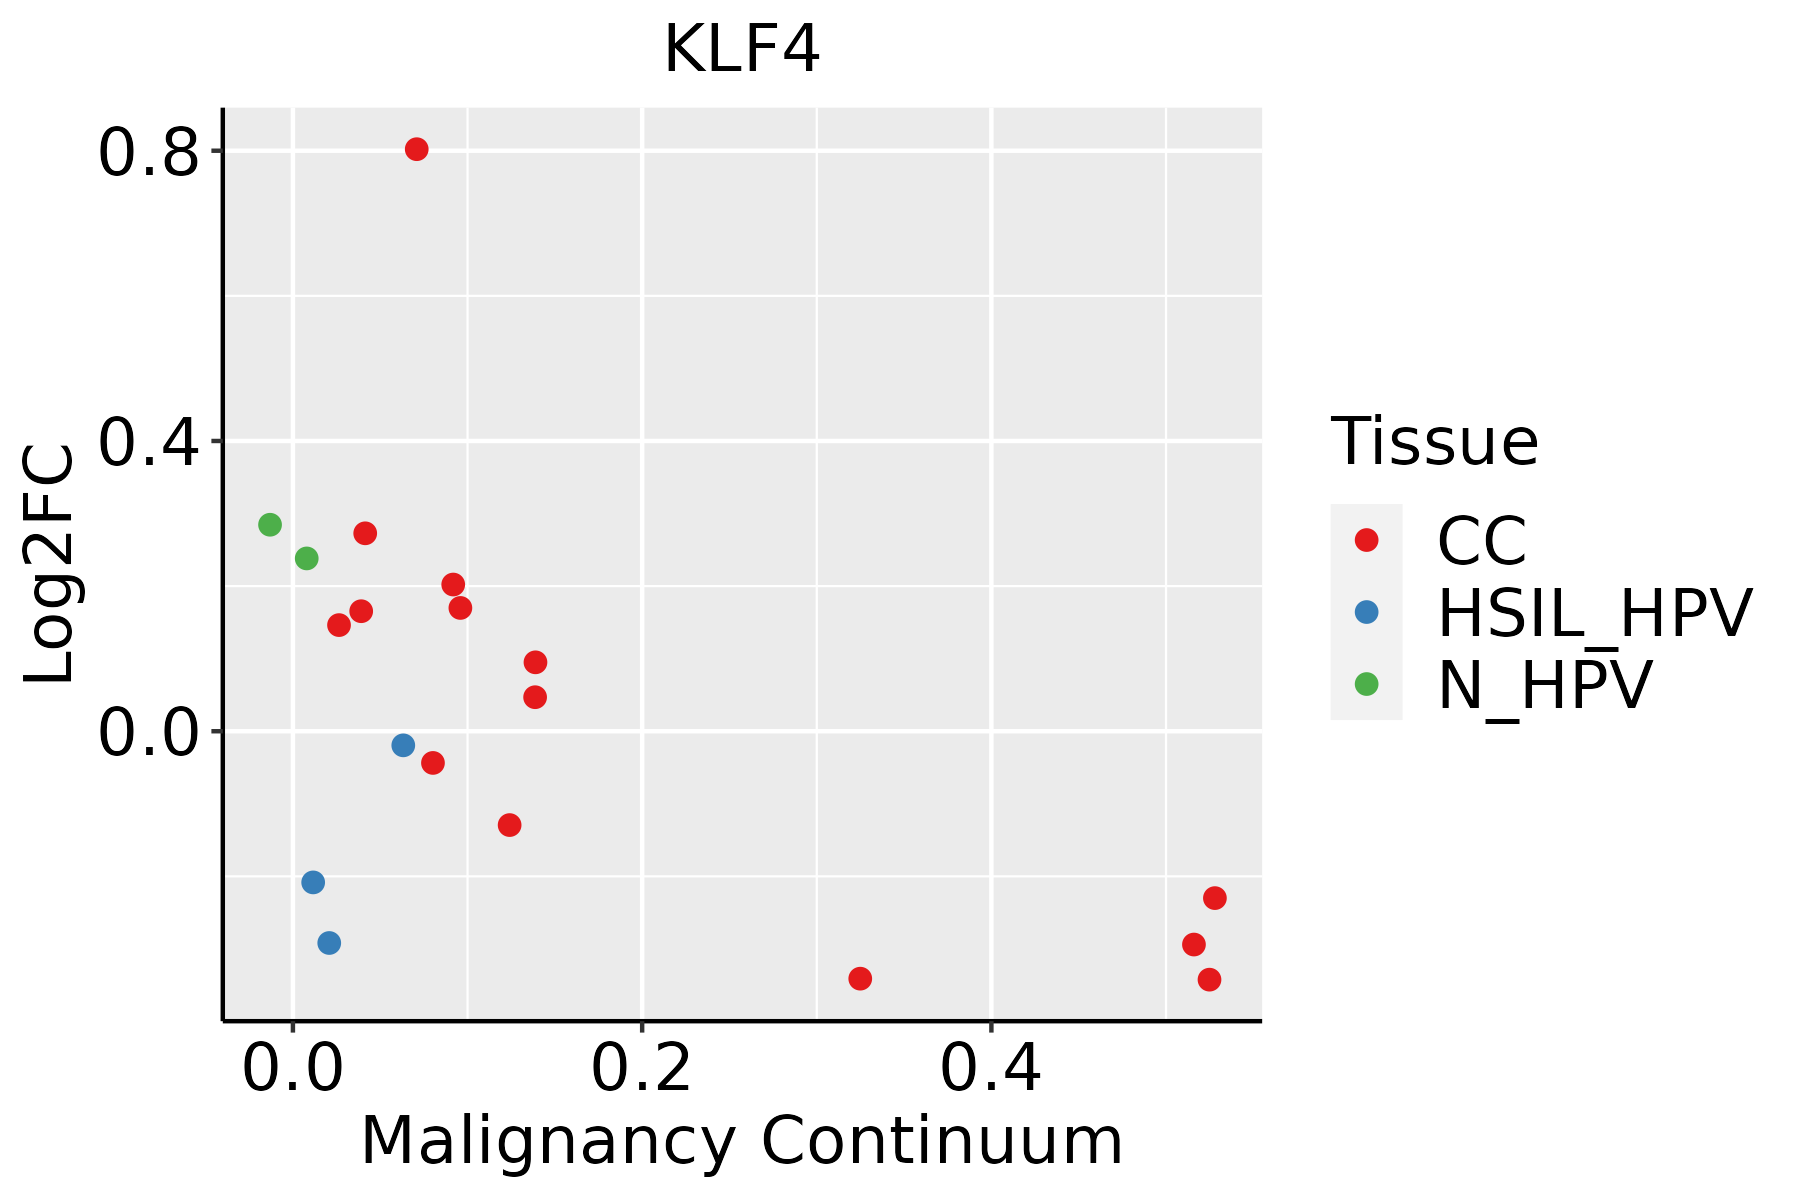 | CC: Cervix cancer |
| HSIL_HPV: HPV-infected high-grade squamous intraepithelial lesions | ||
| N_HPV: HPV-infected normal cervix | ||
| Colorectum (GSE201348) |  | FAP: Familial adenomatous polyposis |
| CRC: Colorectal cancer | ||
| Colorectum (HTA11) |  | AD: Adenomas |
| SER: Sessile serrated lesions | ||
| MSI-H: Microsatellite-high colorectal cancer | ||
| MSS: Microsatellite stable colorectal cancer | ||
| Endometrium | 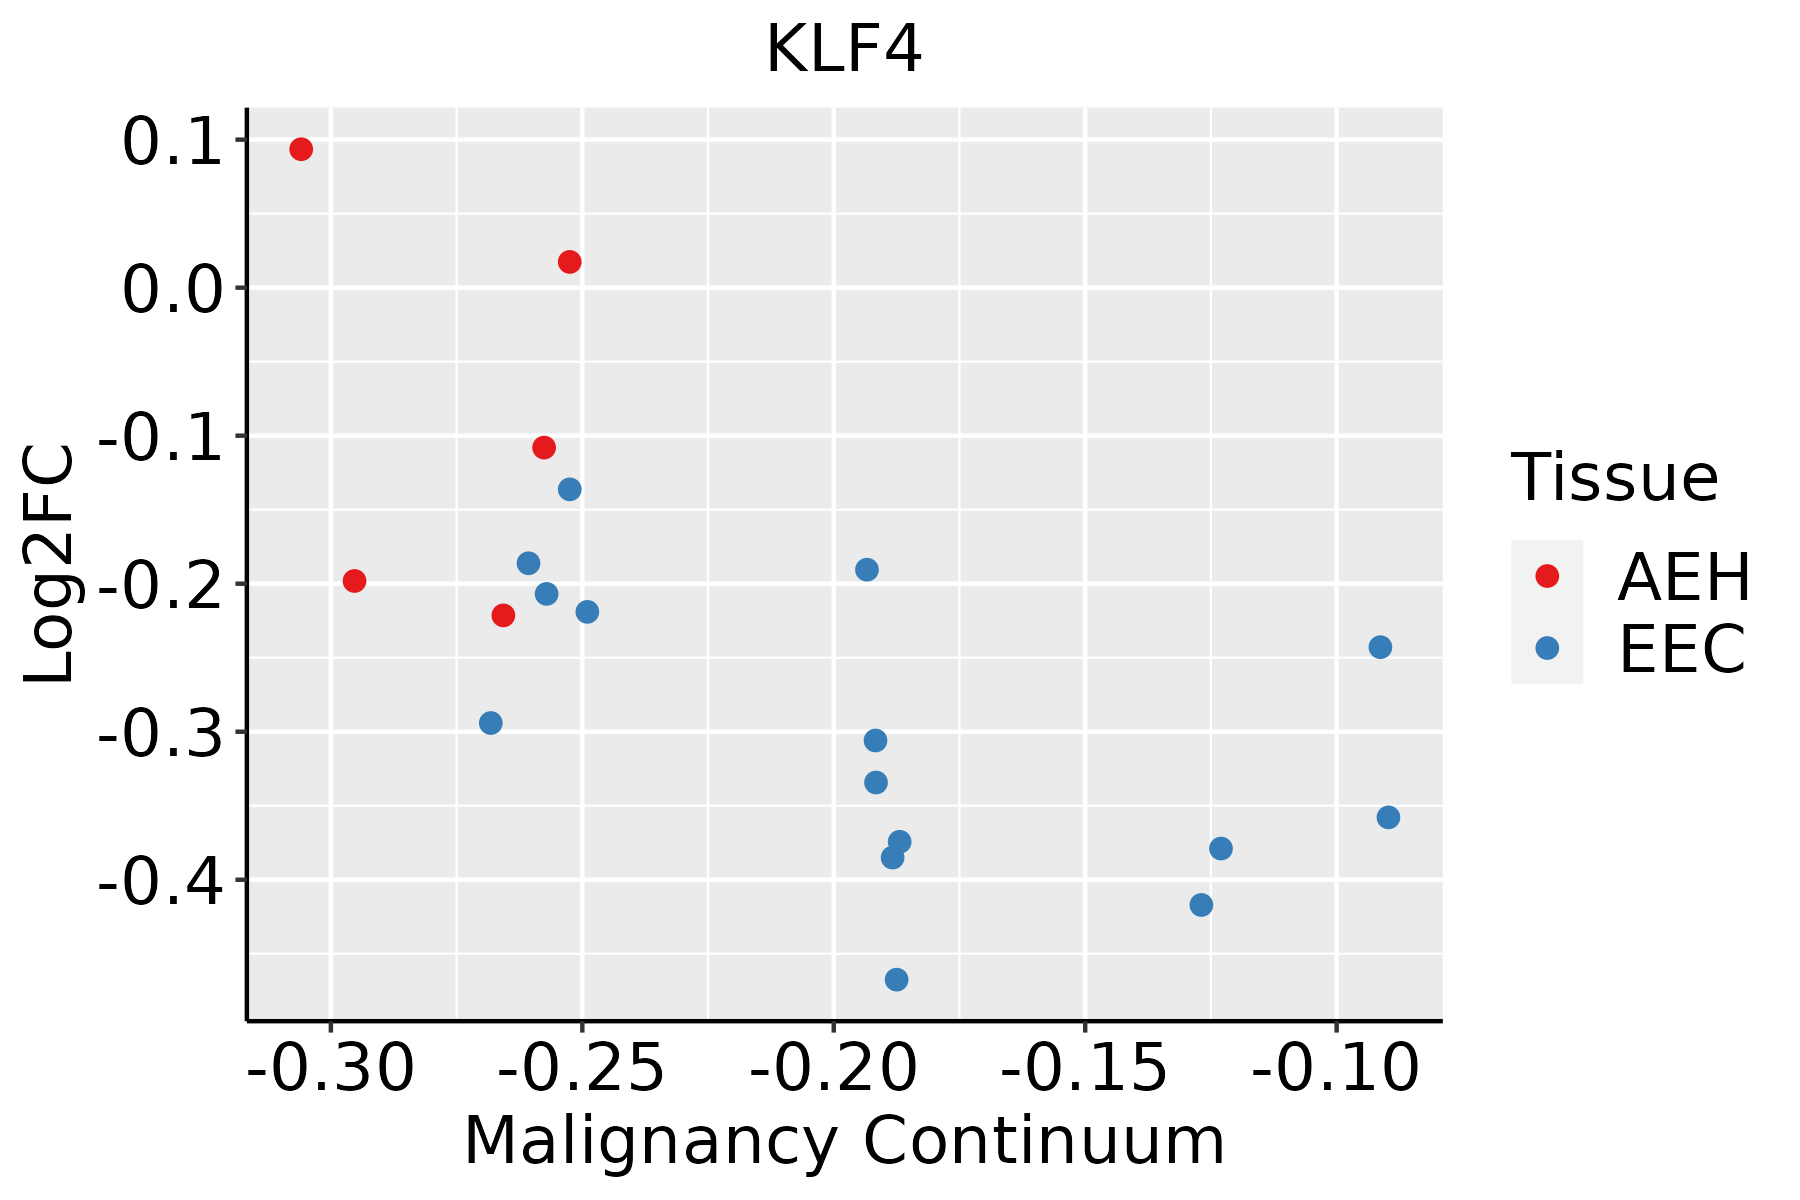 | AEH: Atypical endometrial hyperplasia |
| EEC: Endometrioid Cancer | ||
| Esophagus | 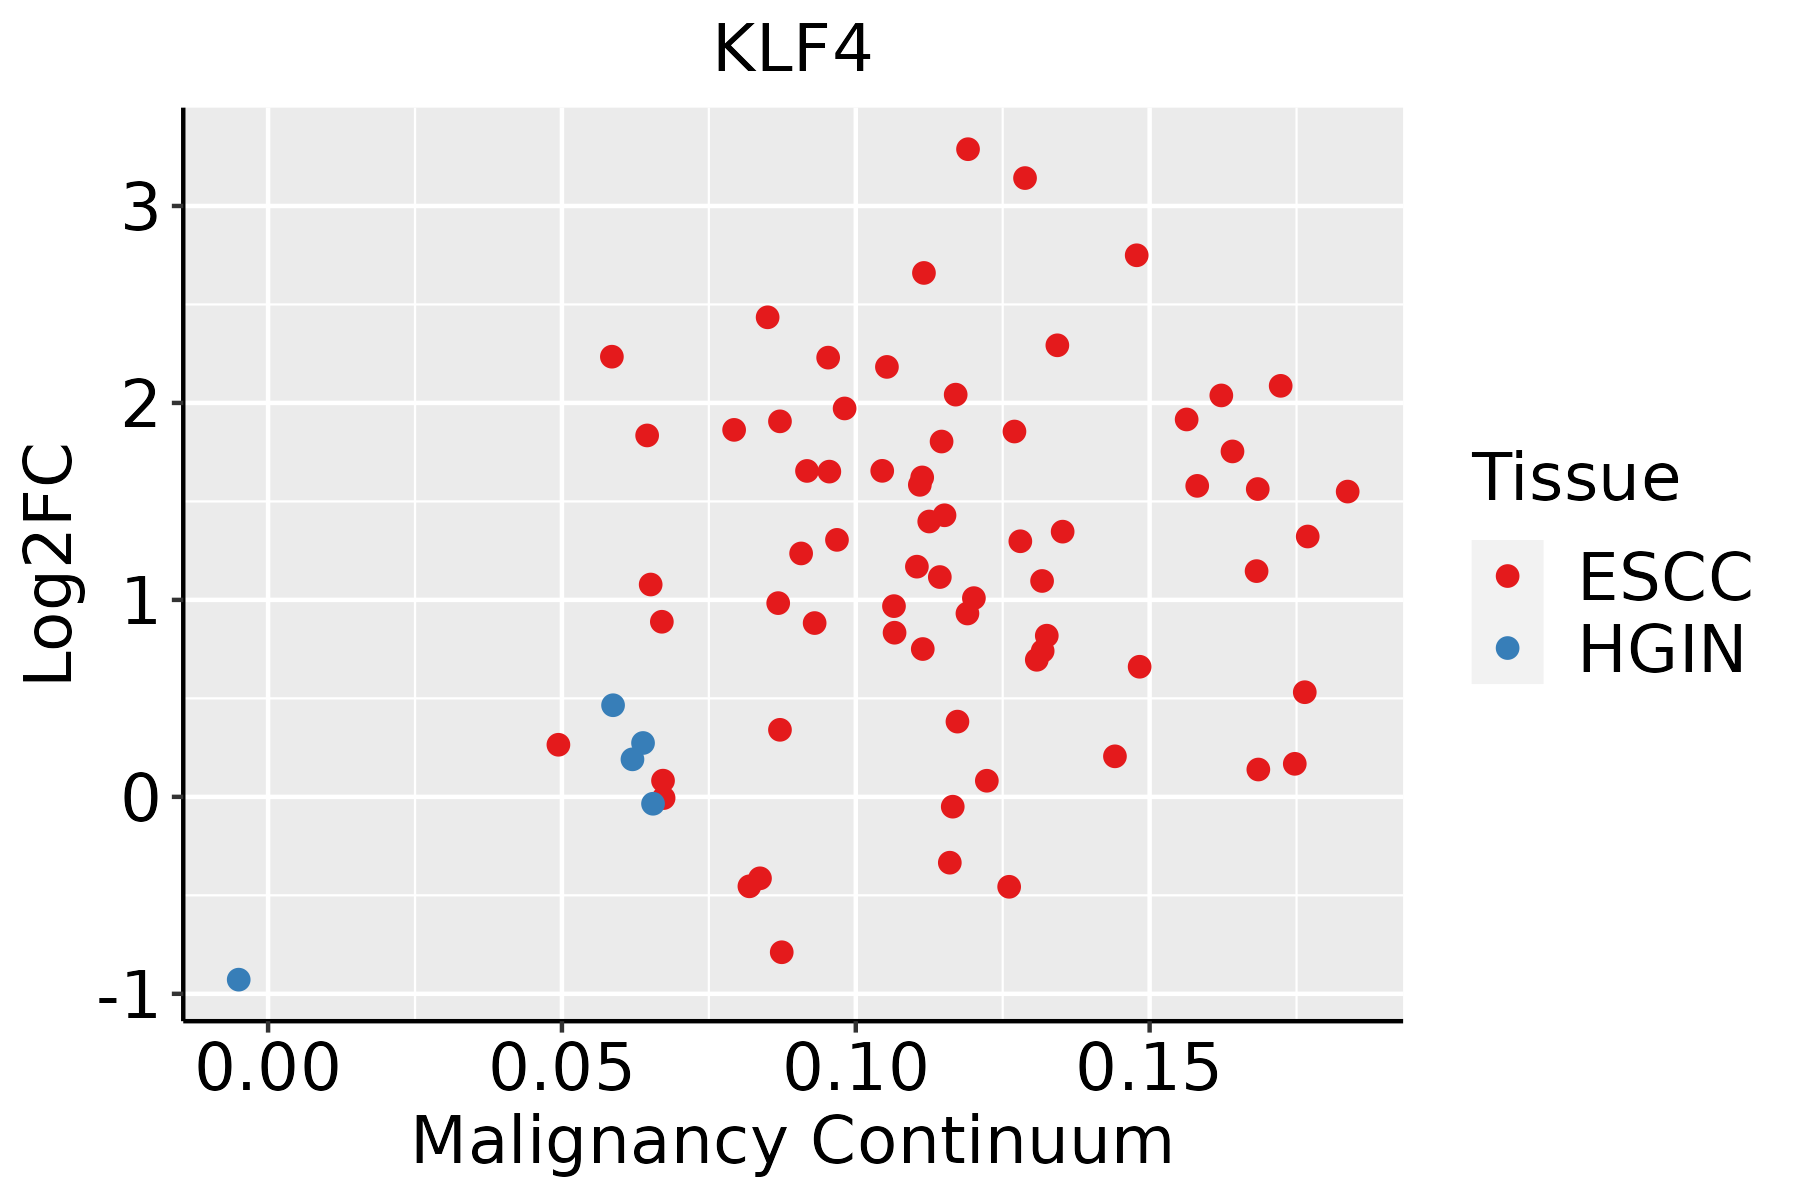 | ESCC: Esophageal squamous cell carcinoma |
| HGIN: High-grade intraepithelial neoplasias | ||
| LGIN: Low-grade intraepithelial neoplasias | ||
| Liver |  | HCC: Hepatocellular carcinoma |
| NAFLD: Non-alcoholic fatty liver disease | ||
| Oral Cavity | 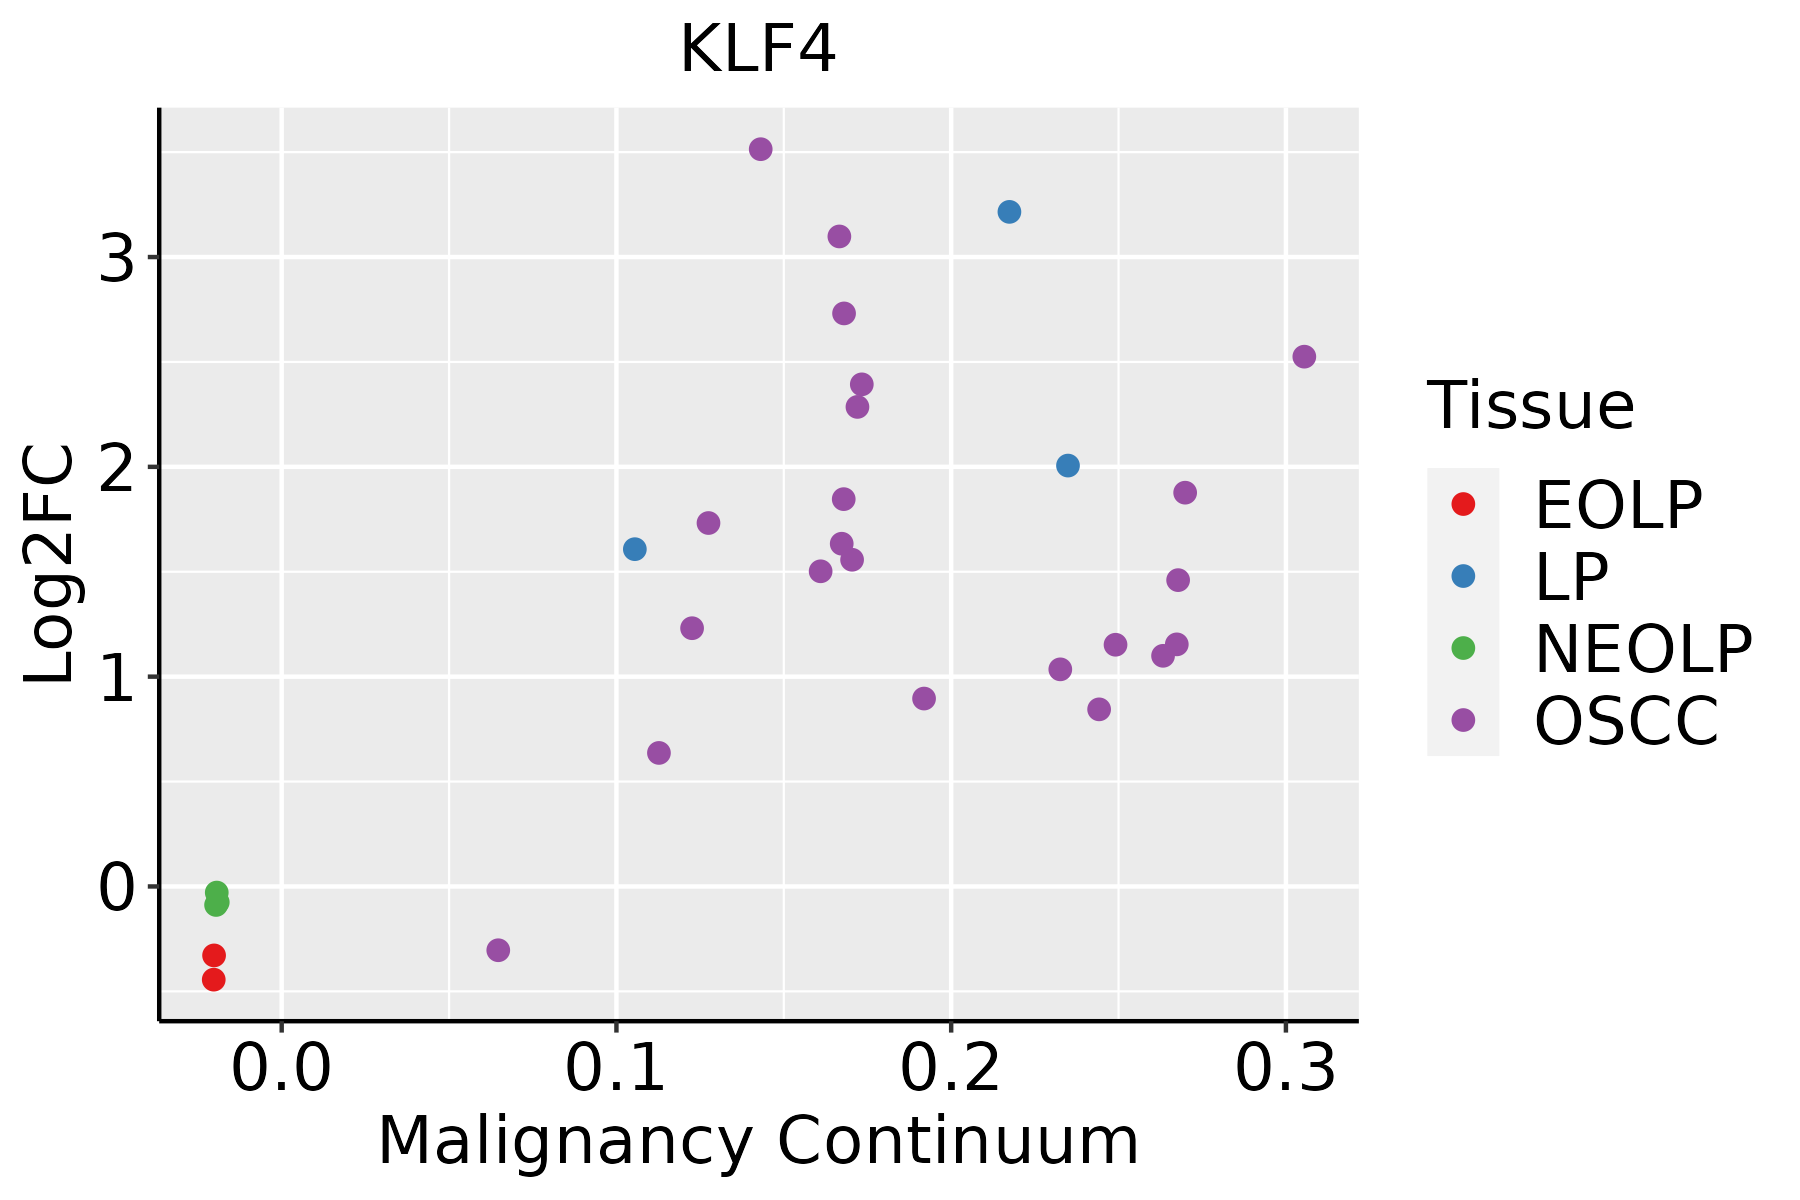 | EOLP: Erosive Oral lichen planus |
| LP: leukoplakia | ||
| NEOLP: Non-erosive oral lichen planus | ||
| OSCC: Oral squamous cell carcinoma | ||
| Prostate | 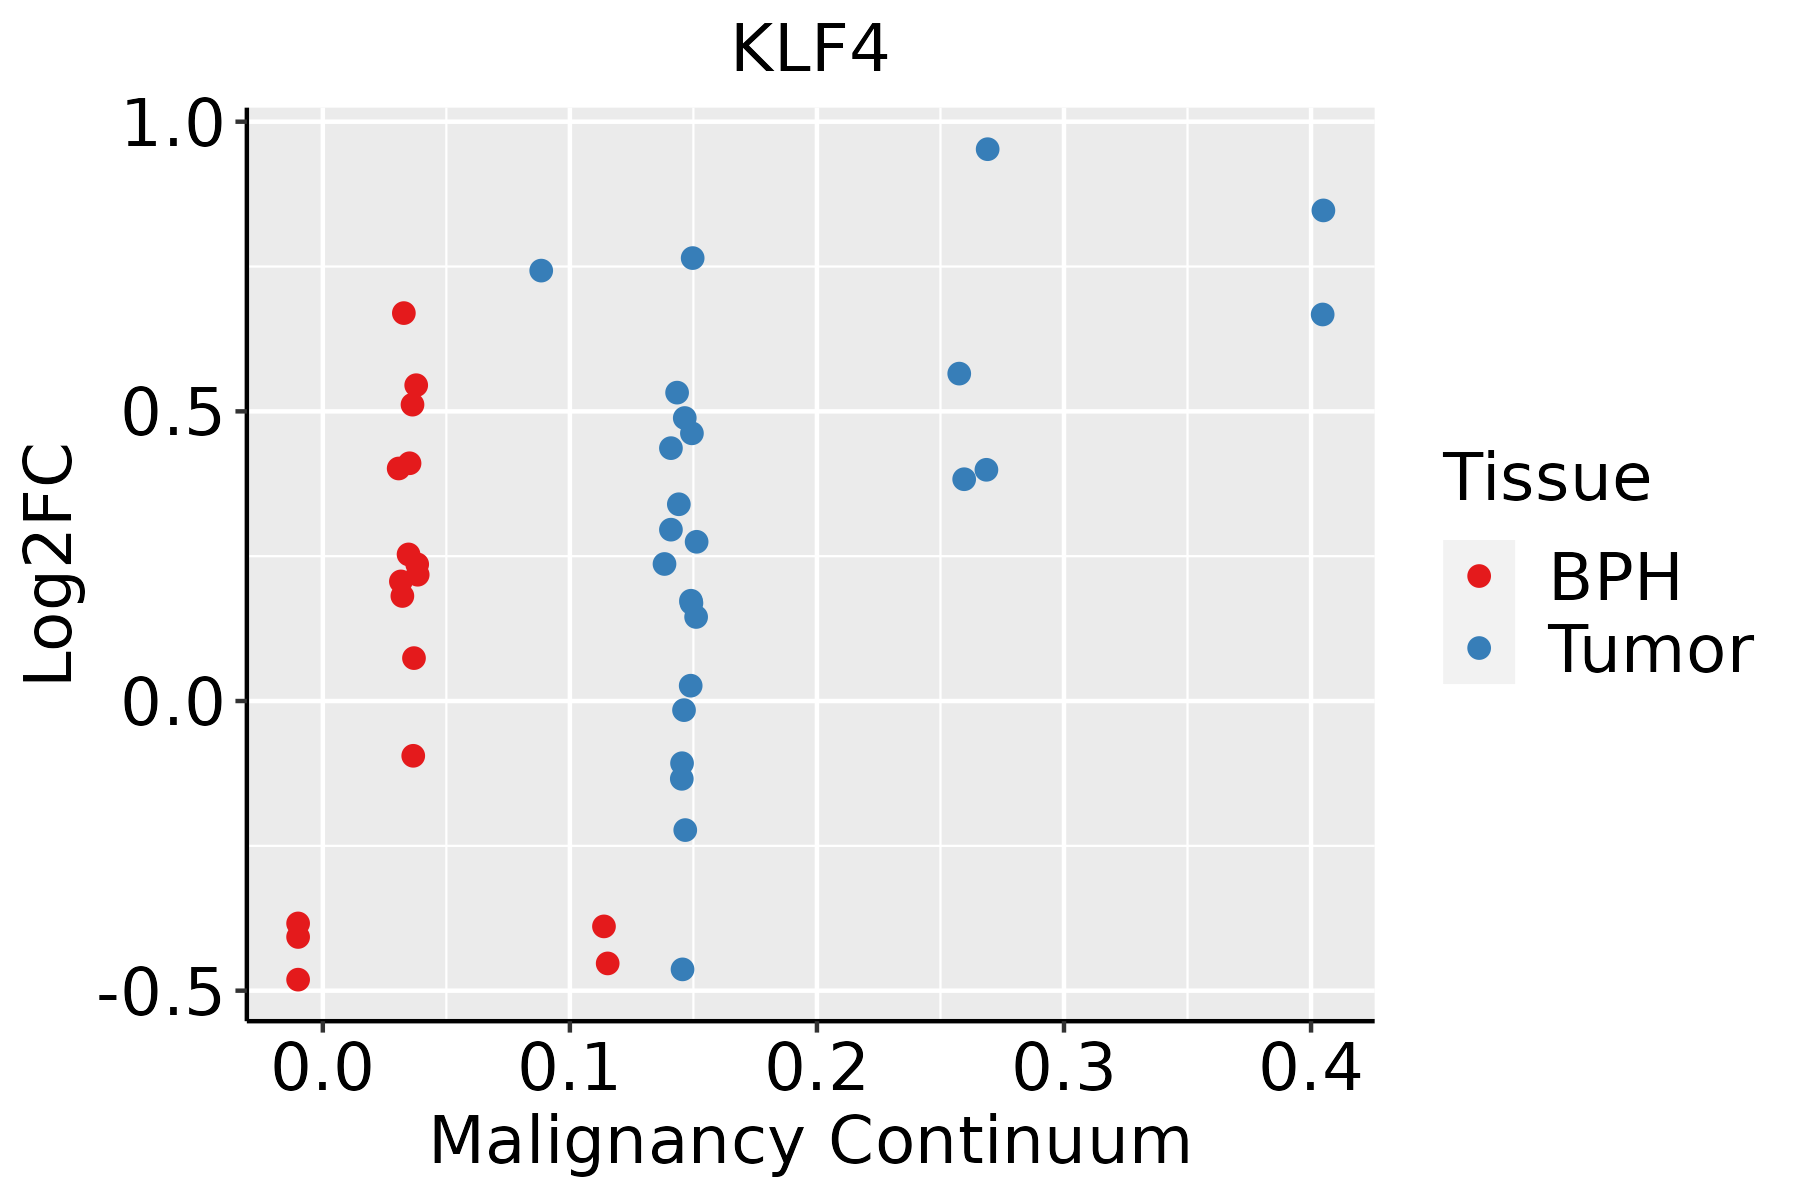 | BPH: Benign Prostatic Hyperplasia |
| Skin | 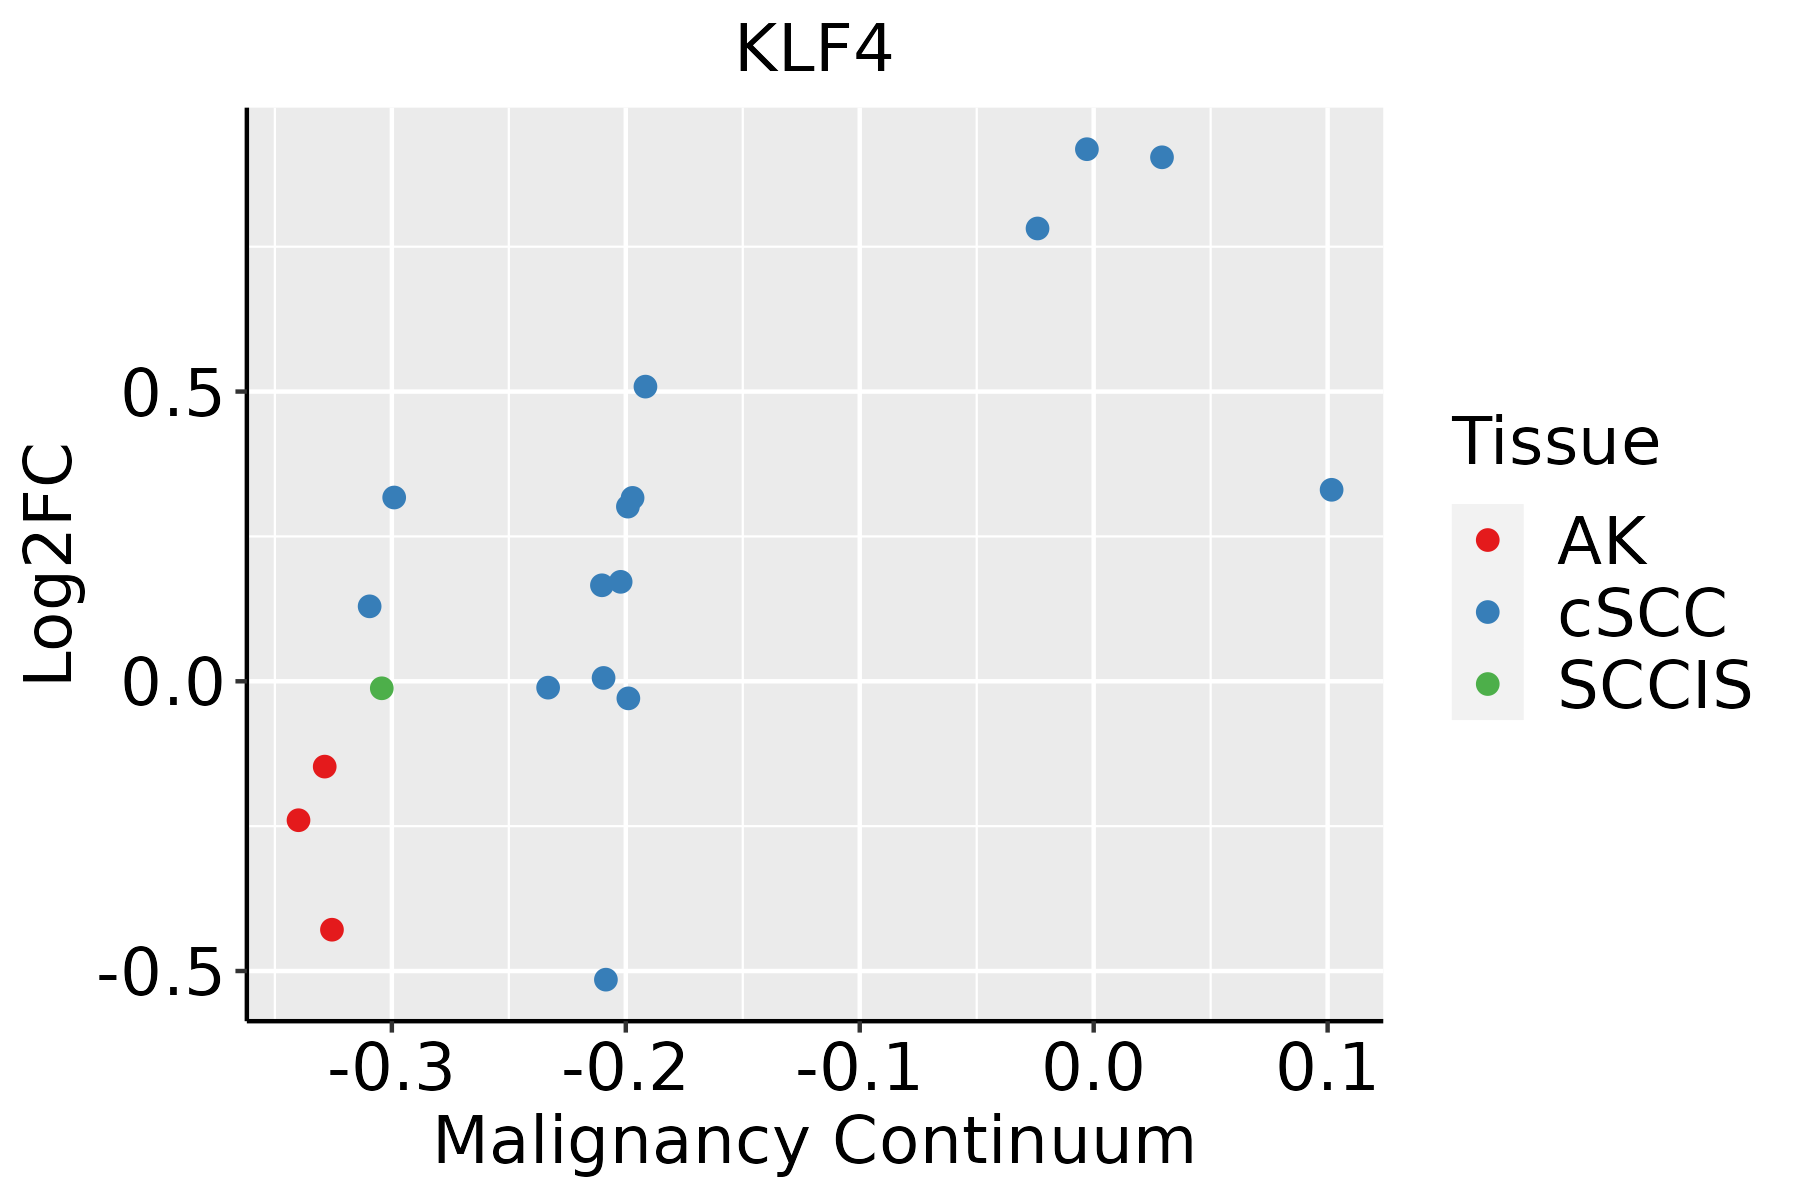 | AK: Actinic keratosis |
| cSCC: Cutaneous squamous cell carcinoma | ||
| SCCIS:squamous cell carcinoma in situ | ||
| Thyroid | 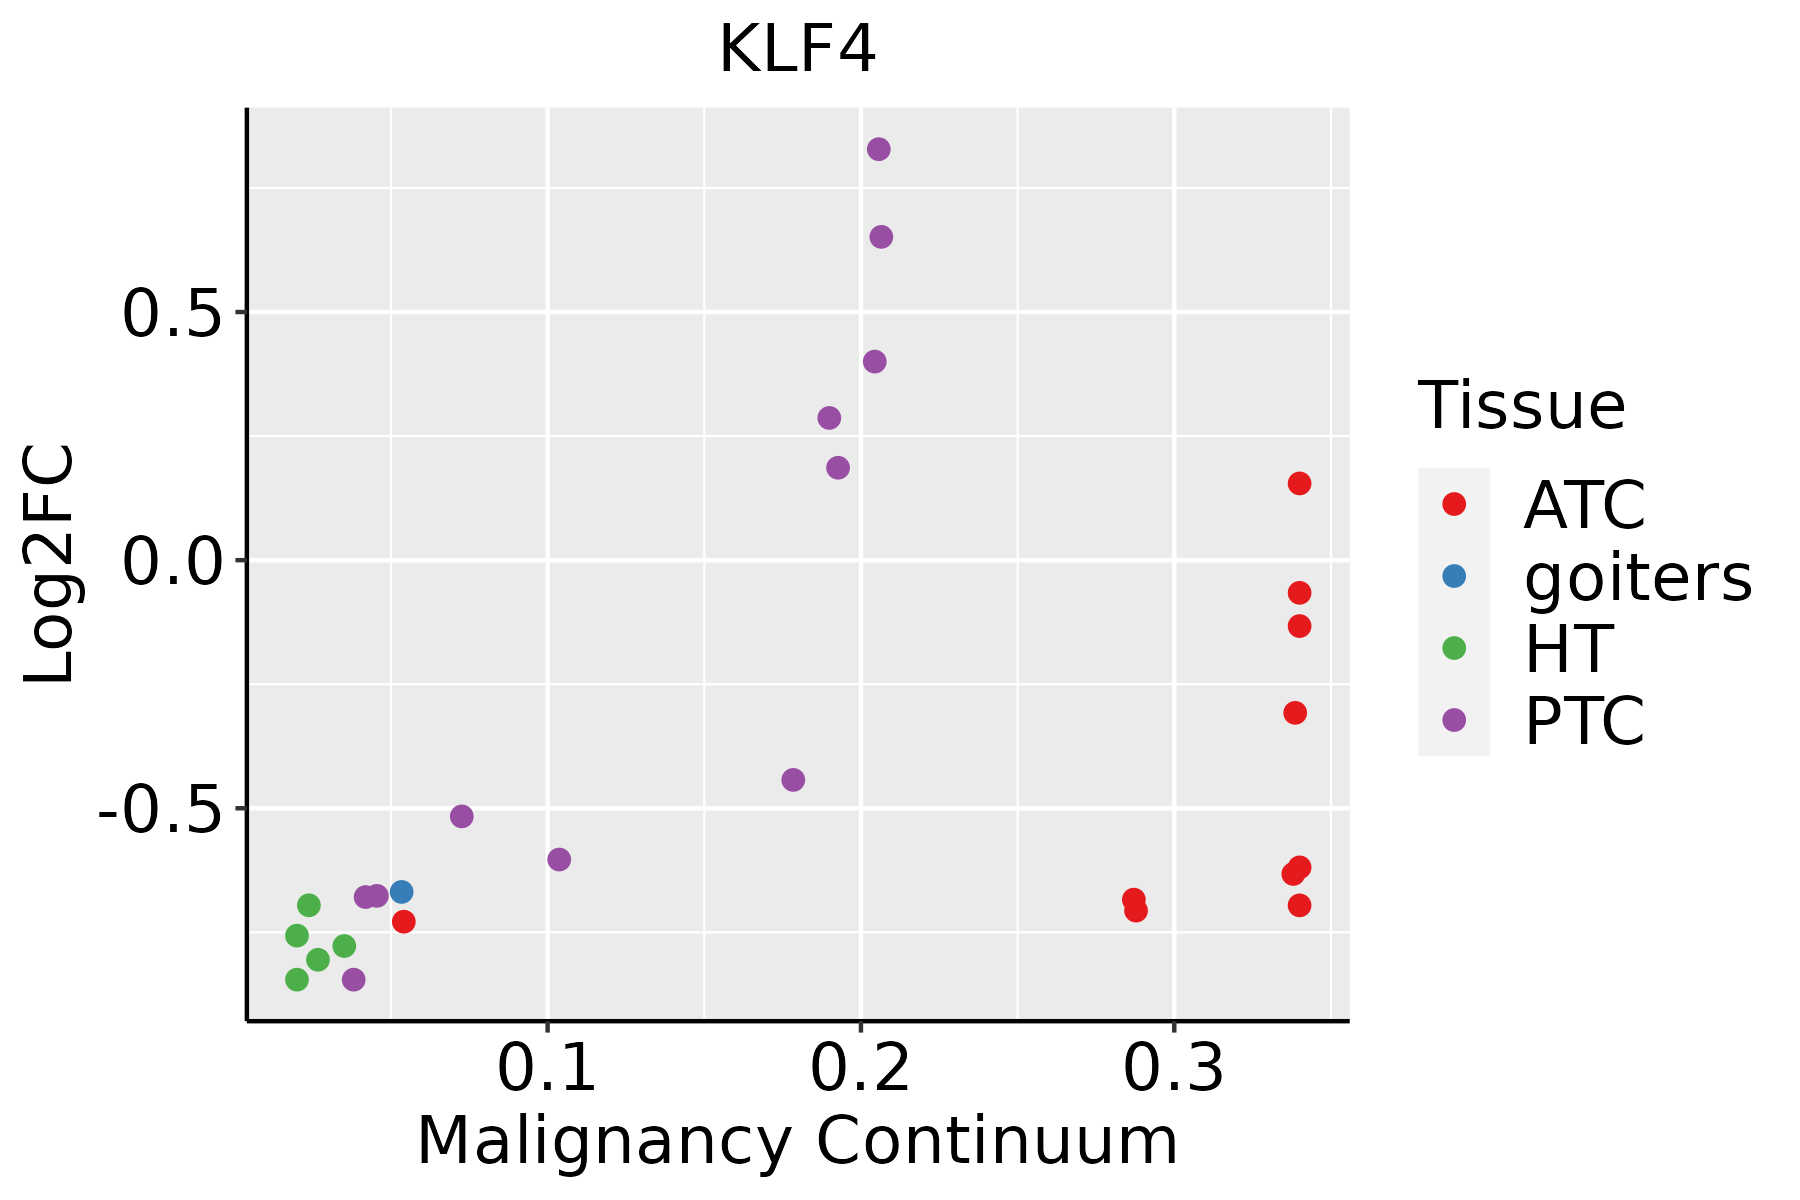 | ATC: Anaplastic thyroid cancer |
| HT: Hashimoto's thyroiditis | ||
| PTC: Papillary thyroid cancer |
| ∗log2FC in expression of this searched gene in stem-like cells from each diseased tissue sample relative to stem-like cells in normal samples in each tissue plotted against the malignancy continuum. Samples are colored based on if they are from different disease stage. |
Top |
Malignant transformation related pathway analysis |
| Find out the enriched GO biological processes and KEGG pathways involved in transition from healthy to precancer to cancer |
| Tissue | Disease Stage | Enriched GO biological Processes |
| Colorectum | AD |  |
| Colorectum | SER |  |
| Colorectum | MSS |  |
| Colorectum | MSI-H |  |
| Colorectum | FAP |  |
| ∗Top 15 enriched GO BP terms are showed in the bar plot of each disease state in each tissue. Each row represents a significant GO biological process which is colored according to the -log10(p.adjust). |
| Page: 1 2 3 4 5 6 7 8 9 |
| GO ID | Tissue | Disease Stage | Description | Gene Ratio | Bg Ratio | pvalue | p.adjust | Count |
| GO:006007025 | Thyroid | ATC | canonical Wnt signaling pathway | 154/6293 | 303/18723 | 3.68e-10 | 1.02e-08 | 154 |
| GO:001097523 | Thyroid | ATC | regulation of neuron projection development | 212/6293 | 445/18723 | 4.16e-10 | 1.14e-08 | 212 |
| GO:006156423 | Thyroid | ATC | axon development | 220/6293 | 467/18723 | 6.85e-10 | 1.80e-08 | 220 |
| GO:190198715 | Thyroid | ATC | regulation of cell cycle phase transition | 187/6293 | 390/18723 | 2.36e-09 | 5.61e-08 | 187 |
| GO:190165427 | Thyroid | ATC | response to ketone | 105/6293 | 194/18723 | 2.96e-09 | 6.96e-08 | 105 |
| GO:190165325 | Thyroid | ATC | cellular response to peptide | 173/6293 | 359/18723 | 5.87e-09 | 1.28e-07 | 173 |
| GO:003461433 | Thyroid | ATC | cellular response to reactive oxygen species | 87/6293 | 155/18723 | 6.54e-09 | 1.43e-07 | 87 |
| GO:0051054110 | Thyroid | ATC | positive regulation of DNA metabolic process | 107/6293 | 201/18723 | 7.10e-09 | 1.54e-07 | 107 |
| GO:004578614 | Thyroid | ATC | negative regulation of cell cycle | 181/6293 | 385/18723 | 2.64e-08 | 5.07e-07 | 181 |
| GO:001063131 | Thyroid | ATC | epithelial cell migration | 169/6293 | 357/18723 | 4.21e-08 | 7.69e-07 | 169 |
| GO:009013031 | Thyroid | ATC | tissue migration | 171/6293 | 365/18723 | 8.55e-08 | 1.47e-06 | 171 |
| GO:009013231 | Thyroid | ATC | epithelium migration | 169/6293 | 360/18723 | 8.57e-08 | 1.47e-06 | 169 |
| GO:000979115 | Thyroid | ATC | post-embryonic development | 50/6293 | 80/18723 | 1.14e-07 | 1.92e-06 | 50 |
| GO:200027825 | Thyroid | ATC | regulation of DNA biosynthetic process | 62/6293 | 106/18723 | 1.26e-07 | 2.09e-06 | 62 |
| GO:190199115 | Thyroid | ATC | negative regulation of mitotic cell cycle phase transition | 94/6293 | 179/18723 | 1.33e-07 | 2.19e-06 | 94 |
| GO:007030122 | Thyroid | ATC | cellular response to hydrogen peroxide | 58/6293 | 98/18723 | 1.81e-07 | 2.86e-06 | 58 |
| GO:004593015 | Thyroid | ATC | negative regulation of mitotic cell cycle | 117/6293 | 235/18723 | 1.93e-07 | 3.05e-06 | 117 |
| GO:004484316 | Thyroid | ATC | cell cycle G1/S phase transition | 119/6293 | 241/18723 | 2.68e-07 | 4.10e-06 | 119 |
| GO:000008216 | Thyroid | ATC | G1/S transition of mitotic cell cycle | 107/6293 | 214/18723 | 4.83e-07 | 6.99e-06 | 107 |
| GO:001063231 | Thyroid | ATC | regulation of epithelial cell migration | 137/6293 | 292/18723 | 1.44e-06 | 1.77e-05 | 137 |
| Page: 1 2 3 4 5 6 7 8 9 10 11 12 13 14 15 16 17 18 19 20 21 22 23 24 25 26 27 28 29 30 31 32 33 34 35 36 37 38 39 40 41 42 43 44 45 46 47 48 49 50 51 52 53 54 55 56 57 58 59 60 61 62 63 64 65 66 67 68 69 70 71 72 73 74 75 76 77 78 79 80 81 82 83 84 85 86 |
| Pathway ID | Tissue | Disease Stage | Description | Gene Ratio | Bg Ratio | pvalue | p.adjust | qvalue | Count |
| Page: 1 |
Top |
Cell-cell communication analysis |
| Identification of potential cell-cell interactions between two cell types and their ligand-receptor pairs for different disease states |
| Ligand | Receptor | LRpair | Pathway | Tissue | Disease Stage |
| Page: 1 |
Top |
Single-cell gene regulatory network inference analysis |
| Find out the significant the regulons (TFs) and the target genes of each regulon across cell types for different disease states |
| TF | Cell Type | Tissue | Disease Stage | Target Gene | RSS | Regulon Activity |
| KLF4 | CD8TEXP | Colorectum | SER | ATF3,CHP2,MRPL55, etc. | 1.58e-01 |  |
| KLF4 | INMON | Endometrium | Healthy | KLF2,LYZ,ATF3, etc. | 7.99e-02 |  |
| KLF4 | ECM | Esophagus | Healthy | KLF2,ANXA1,CFD, etc. | 6.50e-01 |  |
| KLF4 | LC | Lung | AAH | TYROBP,HSP90AA1,DUSP1, etc. | 1.94e-01 |  |
| KLF4 | MDSC | Lung | Healthy | RND3,JUN,CCNL1, etc. | 8.74e-01 |  |
| KLF4 | LC | Lung | MIAC | HLA-DPB1,HLA-DRB1,CD74, etc. | 1.59e-01 |  |
| KLF4 | M1MAC | Pancreas | ADJ | SIK1,PLAUR,CXCL2, etc. | 1.73e-01 |  |
| KLF4 | PMC | Stomach | CAG | KLF2,S100P,CA2, etc. | 7.24e-01 |  |
| ∗The dot plots of a searched regulon are shown for all cell subpopulations in each disease state of each tissue based on the regulon specific score inferred using pySCENIC and by calculating the average expression. |
| Page: 1 |
Top |
Somatic mutation of malignant transformation related genes |
| Annotation of somatic variants for genes involved in malignant transformation |
| Hugo Symbol | Variant Class | Variant Classification | dbSNP RS | HGVSc | HGVSp | HGVSp Short | SWISSPROT | BIOTYPE | SIFT | PolyPhen | Tumor Sample Barcode | Tissue | Histology | Sex | Age | Stage | Therapy Types | Drugs | Outcome |
| KLF4 | SNV | Missense_Mutation | c.1225A>C | p.Lys409Gln | p.K409Q | O43474 | protein_coding | deleterious(0) | possibly_damaging(0.749) | TCGA-A7-A0CG-01 | Breast | breast invasive carcinoma | Female | >=65 | I/II | Unknown | Unknown | SD | |
| KLF4 | SNV | Missense_Mutation | c.1225N>C | p.Lys409Gln | p.K409Q | O43474 | protein_coding | deleterious(0) | possibly_damaging(0.749) | TCGA-B6-A1KI-01 | Breast | breast invasive carcinoma | Female | <65 | I/II | Unknown | Unknown | SD | |
| KLF4 | insertion | Frame_Shift_Ins | novel | c.1350_1351insCCGTGTGTTT | p.Thr451ProfsTer40 | p.T451Pfs*40 | O43474 | protein_coding | TCGA-AN-A0FX-01 | Breast | breast invasive carcinoma | Female | <65 | I/II | Unknown | Unknown | SD | ||
| KLF4 | SNV | Missense_Mutation | novel | c.71N>T | p.Ala24Val | p.A24V | O43474 | protein_coding | tolerated(0.07) | benign(0.374) | TCGA-2W-A8YY-01 | Cervix | cervical & endocervical cancer | Female | <65 | I/II | Chemotherapy | cisplatin | CR |
| KLF4 | SNV | Missense_Mutation | novel | c.964N>C | p.Glu322Gln | p.E322Q | O43474 | protein_coding | tolerated(0.11) | benign(0.155) | TCGA-VS-A958-01 | Cervix | cervical & endocervical cancer | Female | <65 | I/II | Chemotherapy | cisplatin | CR |
| KLF4 | SNV | Missense_Mutation | rs751611404 | c.370N>A | p.Val124Met | p.V124M | O43474 | protein_coding | tolerated(0.17) | possibly_damaging(0.871) | TCGA-5M-AAT6-01 | Colorectum | colon adenocarcinoma | Female | <65 | III/IV | Unknown | Unknown | PD |
| KLF4 | SNV | Missense_Mutation | novel | c.385T>C | p.Ser129Pro | p.S129P | O43474 | protein_coding | tolerated(0.14) | benign(0.007) | TCGA-CA-6717-01 | Colorectum | colon adenocarcinoma | Male | <65 | I/II | Chemotherapy | oxaliplatin | CR |
| KLF4 | SNV | Missense_Mutation | c.1246N>T | p.His416Tyr | p.H416Y | O43474 | protein_coding | deleterious(0) | probably_damaging(0.972) | TCGA-CM-6171-01 | Colorectum | colon adenocarcinoma | Female | >=65 | I/II | Unknown | Unknown | SD | |
| KLF4 | SNV | Missense_Mutation | c.1286N>T | p.Asp429Val | p.D429V | O43474 | protein_coding | deleterious(0) | probably_damaging(0.941) | TCGA-F4-6856-01 | Colorectum | colon adenocarcinoma | Male | <65 | I/II | Ancillary | leucovorin | CR | |
| KLF4 | SNV | Missense_Mutation | c.38N>A | p.Ser13Asn | p.S13N | O43474 | protein_coding | tolerated(0.11) | possibly_damaging(0.723) | TCGA-F4-6856-01 | Colorectum | colon adenocarcinoma | Male | <65 | I/II | Ancillary | leucovorin | CR |
| Page: 1 2 3 4 5 |
Top |
Related drugs of malignant transformation related genes |
| Identification of chemicals and drugs interact with genes involved in malignant transfromation |
| (DGIdb 4.0) |
| Entrez ID | Symbol | Category | Interaction Types | Drug Claim Name | Drug Name | PMIDs |
| 9314 | KLF4 | TRANSCRIPTION FACTOR COMPLEX, TRANSCRIPTION FACTOR, CLINICALLY ACTIONABLE | APTO-253 | APTO-253 |
| Page: 1 |

Copyright 2023-Present -The University of Texas Health Science Center at Houston |