Schematic overview of the cellular and molecular mechanisms involved in the cancer progression, including the proposed cellular and molecular mechanisms in cancer cells trajectory. AT1: alveolar type 1 cells; AT2: alveolar type 2 cells; AAH: atypical adenomatous hyperplasia; AIS: adenocarcinoma in situ; MIA: minimally invasive adenocarcinoma; IA: invasive adenocarcinoma; EMT: epithelial-mesenchymal transition

Home

Download

Statistics

Help

Contact

Center for Computational Systems Medicine
leaf

Gene summary

leaf

Malignant transformation analysis

leaf

Malignant transformation related pathway analysis

leaf

Cell-cell communication analysis

leaf

Single-cell gene regulatory network inference analysis

leaf

Somatic mutation of malignant transformation related genes

leaf

Related drugs of malignant transformation related genes

Gene: DHX9

Gene summary for DHX9

check button Gene summary.

Gene informationSpeciesHuman
Gene symbol

DHX9

Gene ID

1660

Gene nameDExH-box helicase 9
Gene AliasDDX9
Cytomap1q25.3
Gene Typeprotein-coding
GO ID

GO:0000375

UniProtAcc

B3KU66


Top

Malignant transformation analysis

check button Identification of the aberrant gene expression in precancerous and cancerous lesions by comparing the gene expression of stem-like cells in diseased tissues with normal stem cells
check button Malignant transformation involving gene list.
Entrez IDSymbolReplicatesSpeciesOrganTissueAdj P-valueLog2FCMalignancy
1660DHX9HTA11_3410_2000001011HumanColorectumAD1.64e-02-3.07e-010.0155
1660DHX9HTA11_866_2000001011HumanColorectumAD1.16e-02-1.61e-01-0.1001
1660DHX9HTA11_99999970781_79442HumanColorectumMSS3.66e-095.75e-010.294
1660DHX9A015-C-203HumanColorectumFAP1.15e-17-2.52e-01-0.1294
1660DHX9A002-C-201HumanColorectumFAP7.88e-06-1.83e-010.0324
1660DHX9A002-C-203HumanColorectumFAP1.97e-02-1.28e-010.2786
1660DHX9A001-C-119HumanColorectumFAP6.00e-04-2.34e-01-0.1557
1660DHX9A001-C-108HumanColorectumFAP1.31e-11-2.87e-01-0.0272
1660DHX9A002-C-205HumanColorectumFAP5.84e-13-3.09e-01-0.1236
1660DHX9A015-C-006HumanColorectumFAP3.13e-08-2.44e-01-0.0994
1660DHX9A015-C-106HumanColorectumFAP1.14e-09-2.12e-01-0.0511
1660DHX9A002-C-114HumanColorectumFAP5.45e-11-3.06e-01-0.1561
1660DHX9A015-C-104HumanColorectumFAP5.70e-20-2.89e-01-0.1899
1660DHX9A001-C-014HumanColorectumFAP7.68e-09-2.11e-010.0135
1660DHX9A002-C-016HumanColorectumFAP1.61e-11-2.49e-010.0521
1660DHX9A015-C-002HumanColorectumFAP1.70e-06-2.55e-01-0.0763
1660DHX9A001-C-203HumanColorectumFAP3.43e-05-1.48e-01-0.0481
1660DHX9A002-C-116HumanColorectumFAP2.34e-22-3.38e-01-0.0452
1660DHX9A014-C-008HumanColorectumFAP2.02e-07-2.25e-01-0.191
1660DHX9A018-E-020HumanColorectumFAP1.19e-10-3.19e-01-0.2034
Page: 1 2 3 4 5 6 7 8 9 10 

check button Transcriptomic changes along malignancy continuum.
TissueExpression DynamicsAbbreviation
Colorectum (GSE201348)The image shows the transcriptomic changes along malignancy continuum.log2FC in expression of this searched gene in stem-like cells from each diseased tissue sample relative to stem-like cells in normal samples in each tissue plotted against the malignancy continuum. Samples are colored based on if they are from different disease stage.FAP: Familial adenomatous polyposis
CRC: Colorectal cancer
Colorectum (HTA11)The image shows the transcriptomic changes along malignancy continuum.log2FC in expression of this searched gene in stem-like cells from each diseased tissue sample relative to stem-like cells in normal samples in each tissue plotted against the malignancy continuum. Samples are colored based on if they are from different disease stage.AD: Adenomas
SER: Sessile serrated lesions
MSI-H: Microsatellite-high colorectal cancer
MSS: Microsatellite stable colorectal cancer
EsophagusThe image shows the transcriptomic changes along malignancy continuum.log2FC in expression of this searched gene in stem-like cells from each diseased tissue sample relative to stem-like cells in normal samples in each tissue plotted against the malignancy continuum. Samples are colored based on if they are from different disease stage.
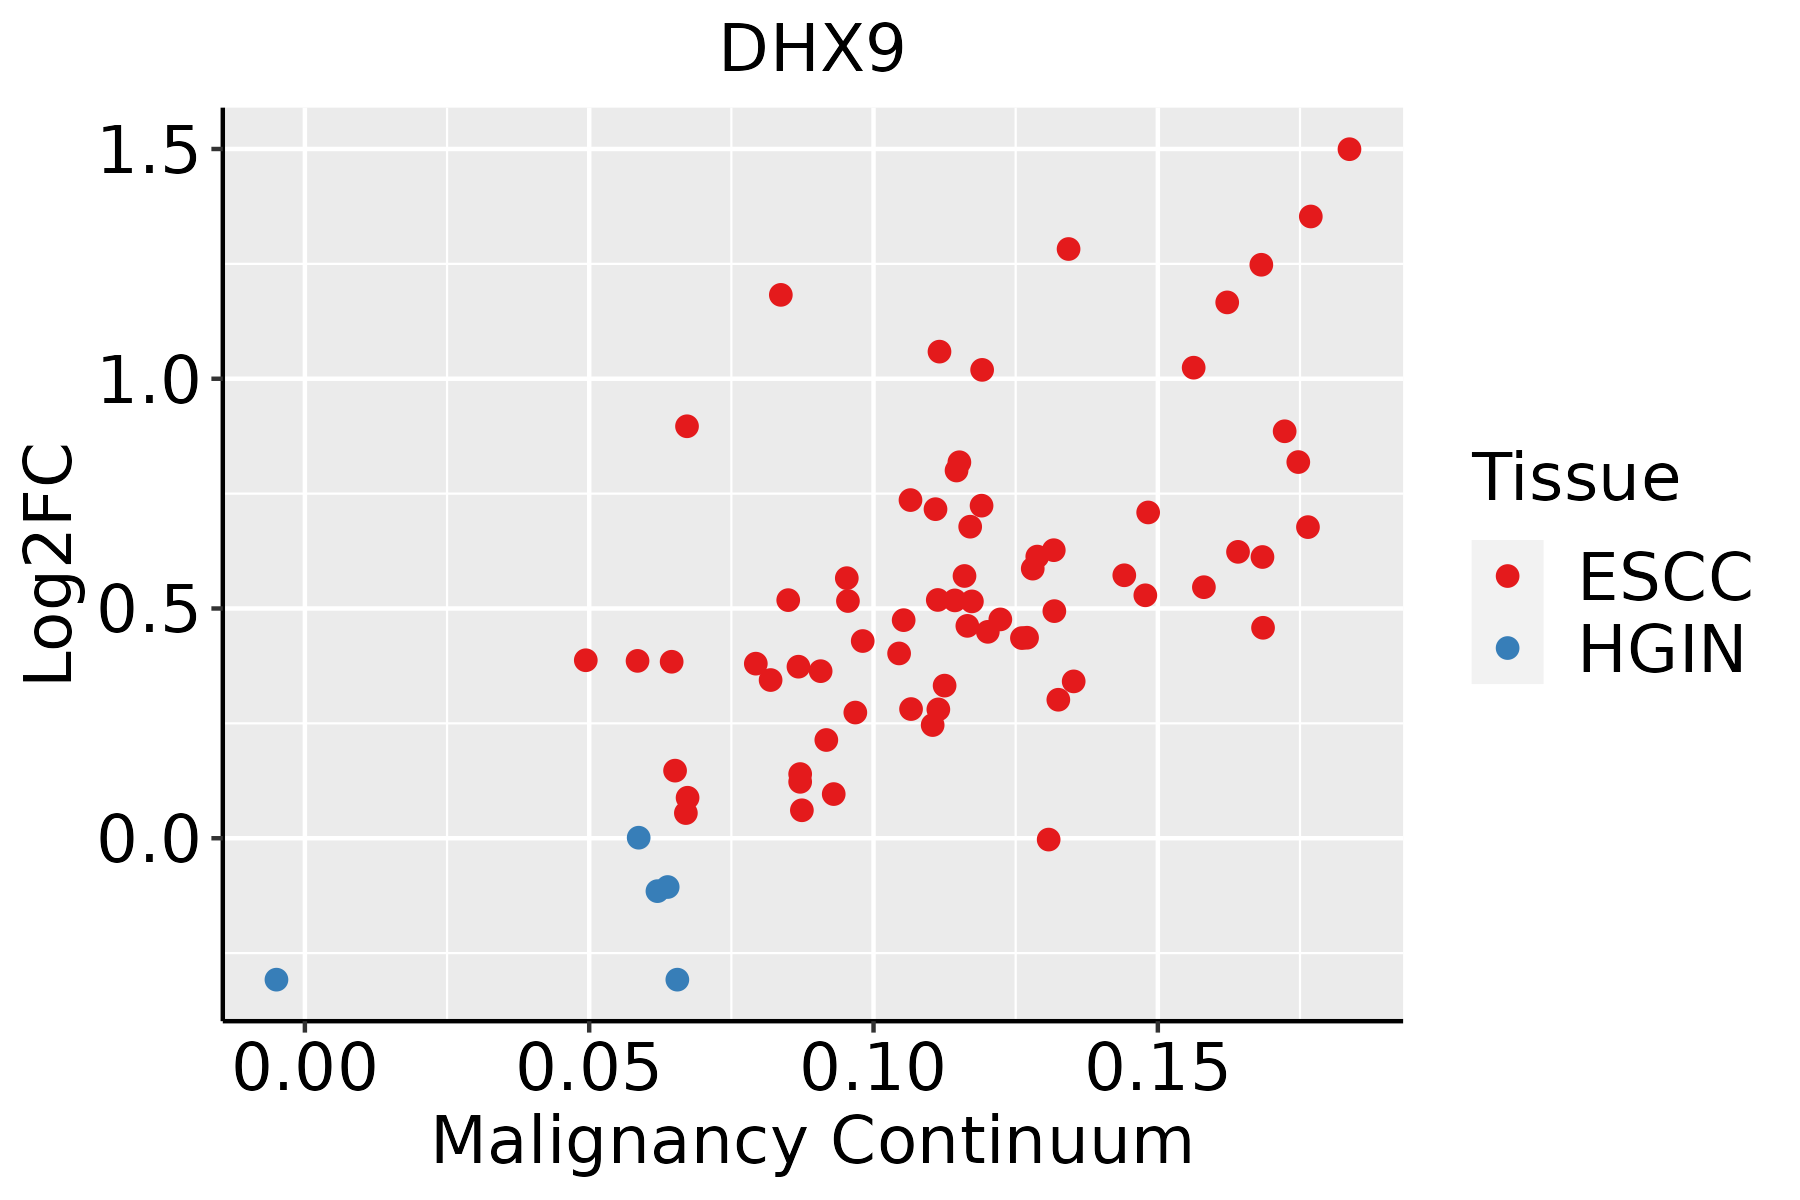
ESCC: Esophageal squamous cell carcinoma
HGIN: High-grade intraepithelial neoplasias
LGIN: Low-grade intraepithelial neoplasias
LiverThe image shows the transcriptomic changes along malignancy continuum.log2FC in expression of this searched gene in stem-like cells from each diseased tissue sample relative to stem-like cells in normal samples in each tissue plotted against the malignancy continuum. Samples are colored based on if they are from different disease stage.
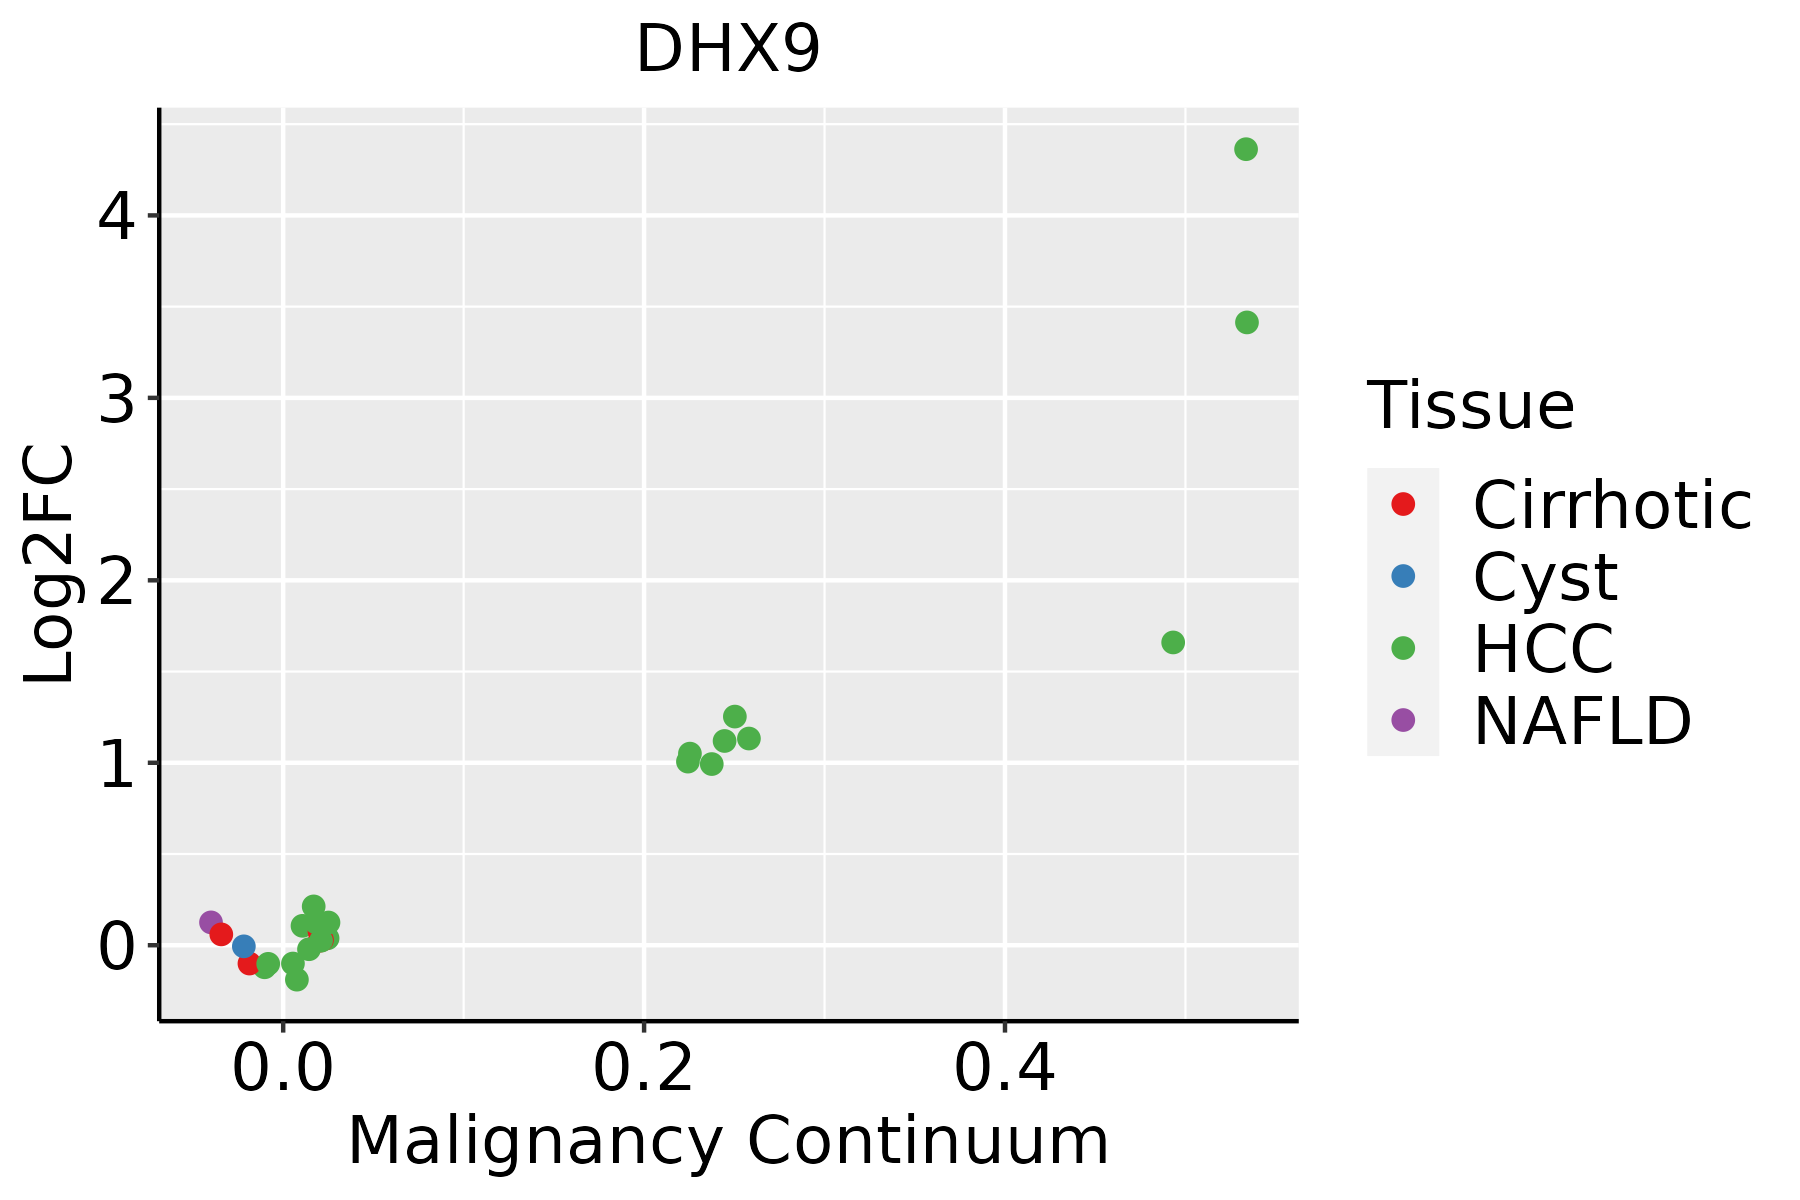
HCC: Hepatocellular carcinoma
NAFLD: Non-alcoholic fatty liver disease
LungThe image shows the transcriptomic changes along malignancy continuum.log2FC in expression of this searched gene in stem-like cells from each diseased tissue sample relative to stem-like cells in normal samples in each tissue plotted against the malignancy continuum. Samples are colored based on if they are from different disease stage.
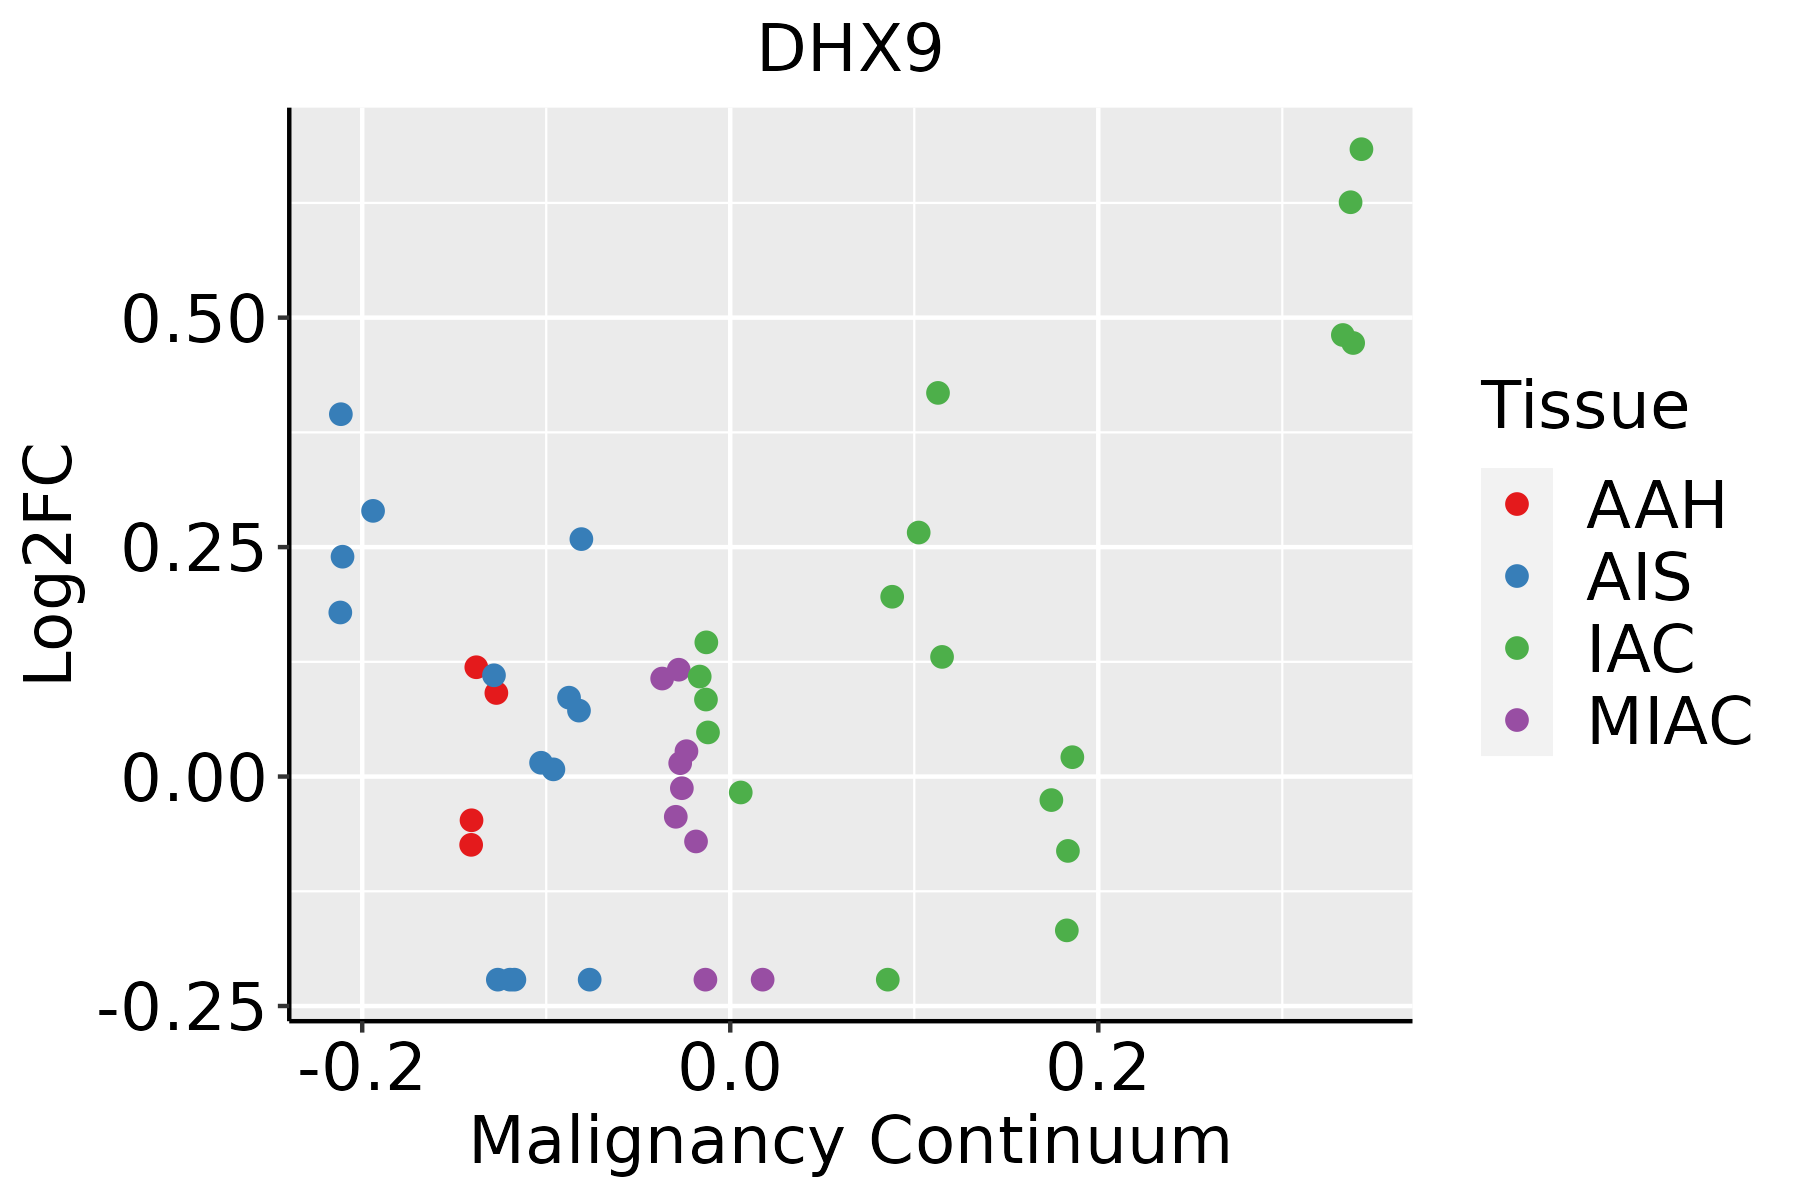
AAH: Atypical adenomatous hyperplasia
AIS: Adenocarcinoma in situ
IAC: Invasive lung adenocarcinoma
MIA: Minimally invasive adenocarcinoma
Oral CavityThe image shows the transcriptomic changes along malignancy continuum.log2FC in expression of this searched gene in stem-like cells from each diseased tissue sample relative to stem-like cells in normal samples in each tissue plotted against the malignancy continuum. Samples are colored based on if they are from different disease stage.EOLP: Erosive Oral lichen planus
LP: leukoplakia
NEOLP: Non-erosive oral lichen planus
OSCC: Oral squamous cell carcinoma
ProstateThe image shows the transcriptomic changes along malignancy continuum.log2FC in expression of this searched gene in stem-like cells from each diseased tissue sample relative to stem-like cells in normal samples in each tissue plotted against the malignancy continuum. Samples are colored based on if they are from different disease stage.
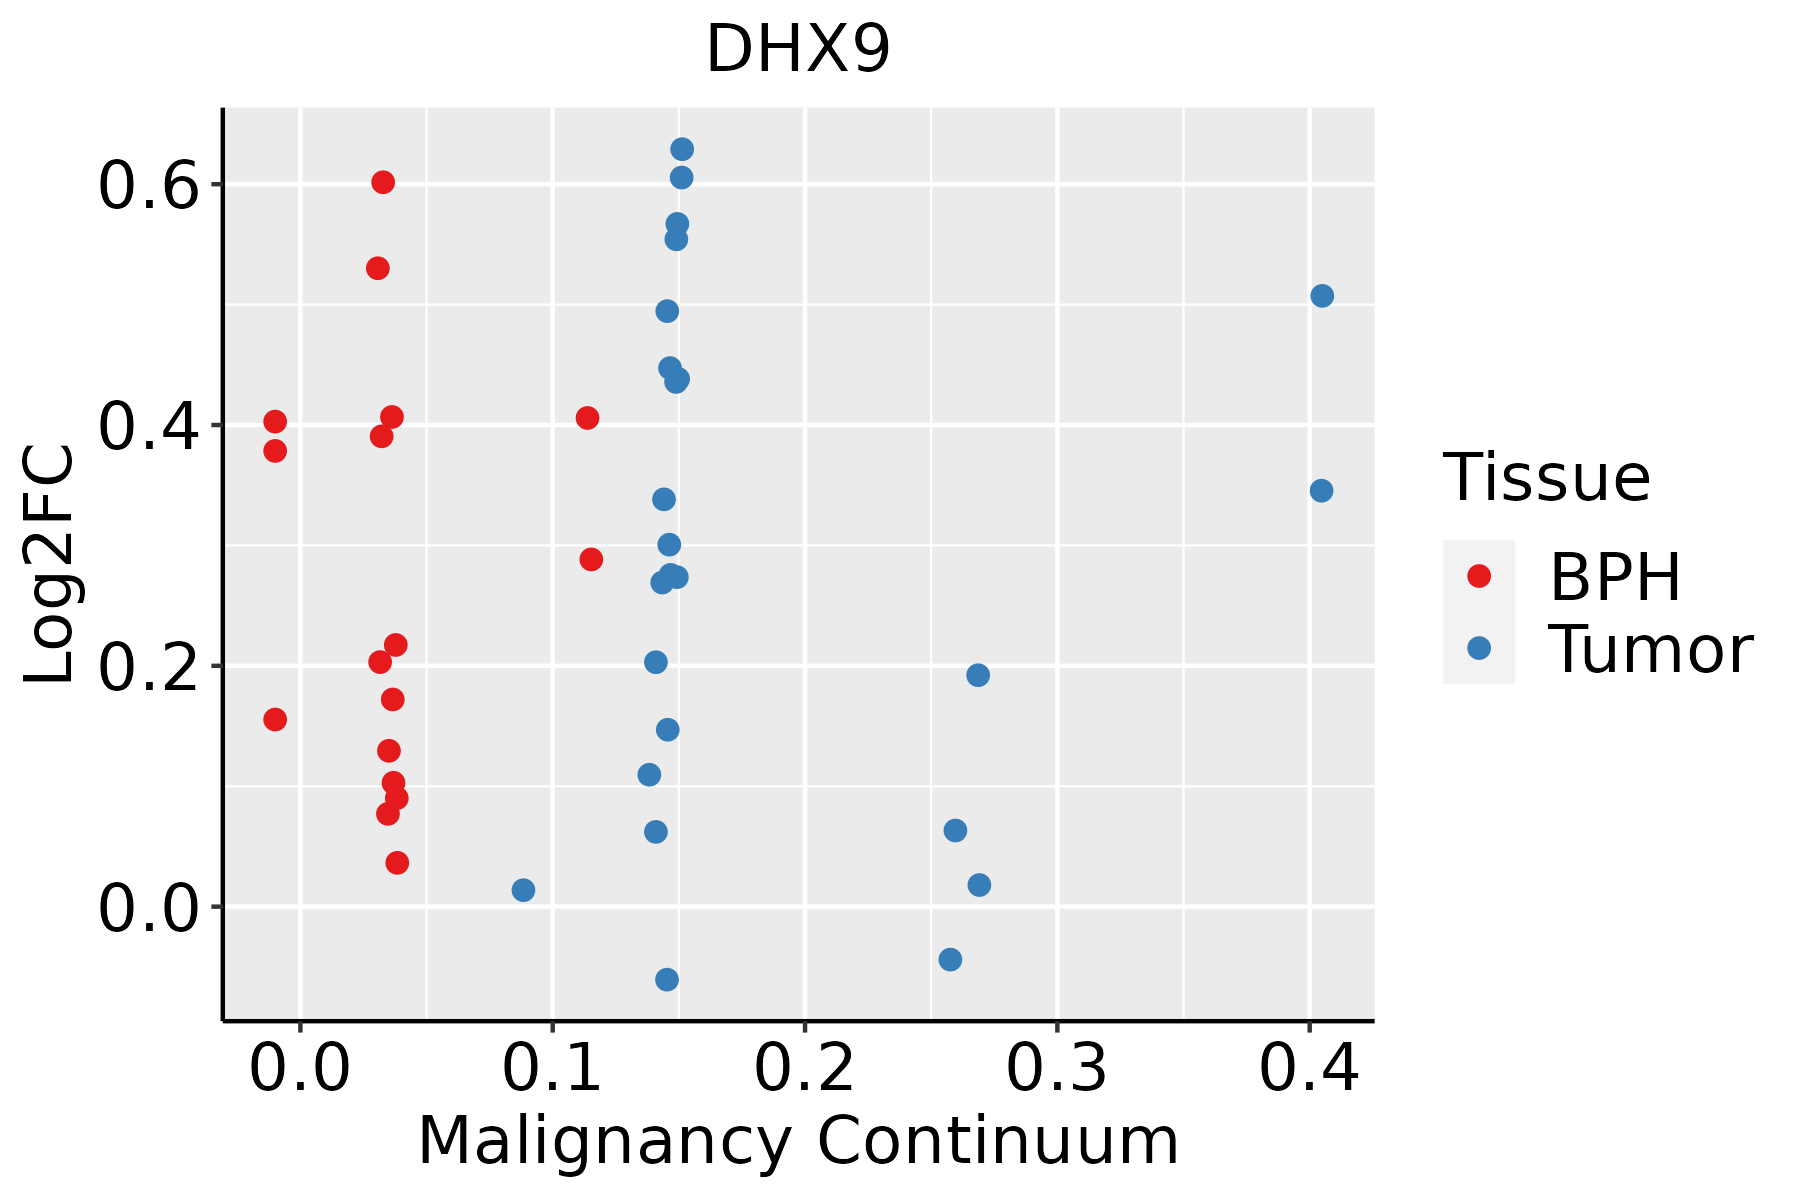
BPH: Benign Prostatic Hyperplasia
SkinThe image shows the transcriptomic changes along malignancy continuum.log2FC in expression of this searched gene in stem-like cells from each diseased tissue sample relative to stem-like cells in normal samples in each tissue plotted against the malignancy continuum. Samples are colored based on if they are from different disease stage.
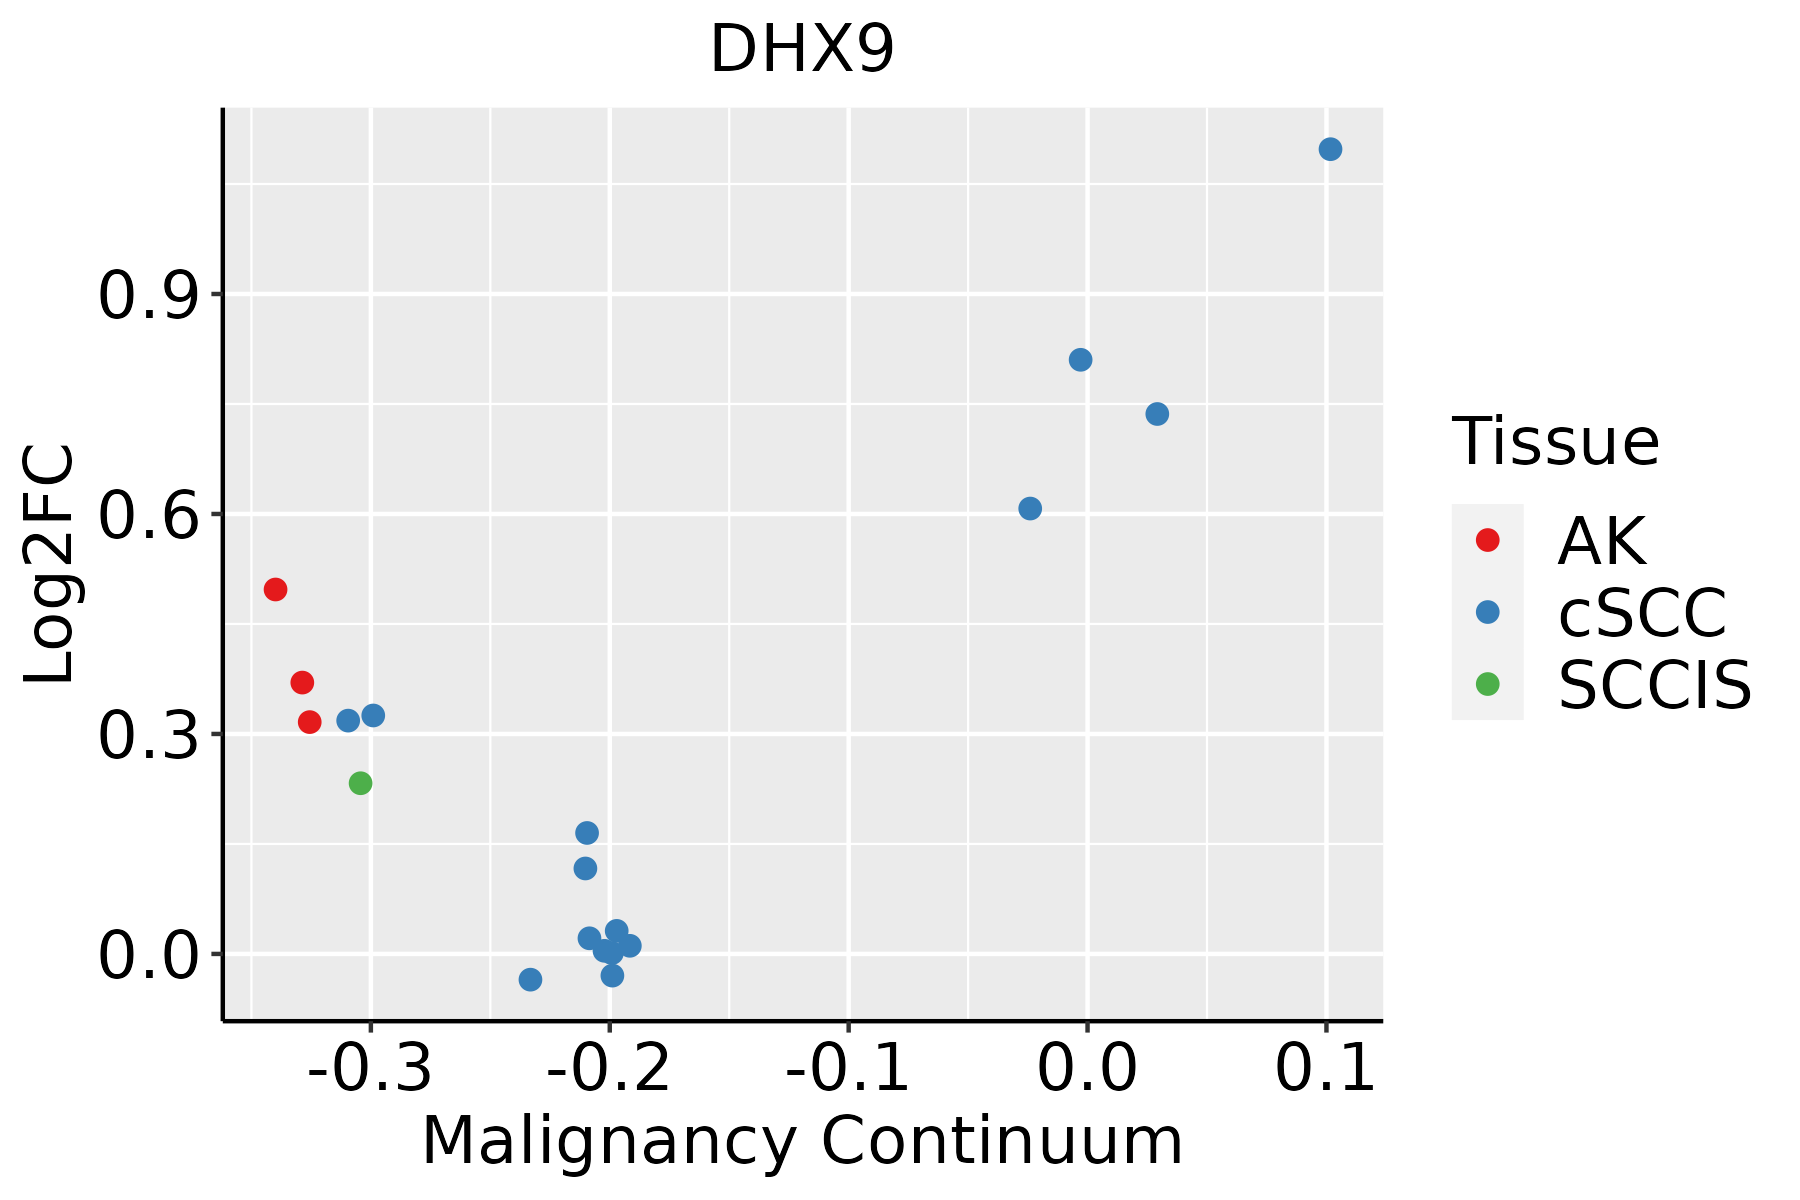
AK: Actinic keratosis
cSCC: Cutaneous squamous cell carcinoma
SCCIS:squamous cell carcinoma in situ
ThyroidThe image shows the transcriptomic changes along malignancy continuum.log2FC in expression of this searched gene in stem-like cells from each diseased tissue sample relative to stem-like cells in normal samples in each tissue plotted against the malignancy continuum. Samples are colored based on if they are from different disease stage.
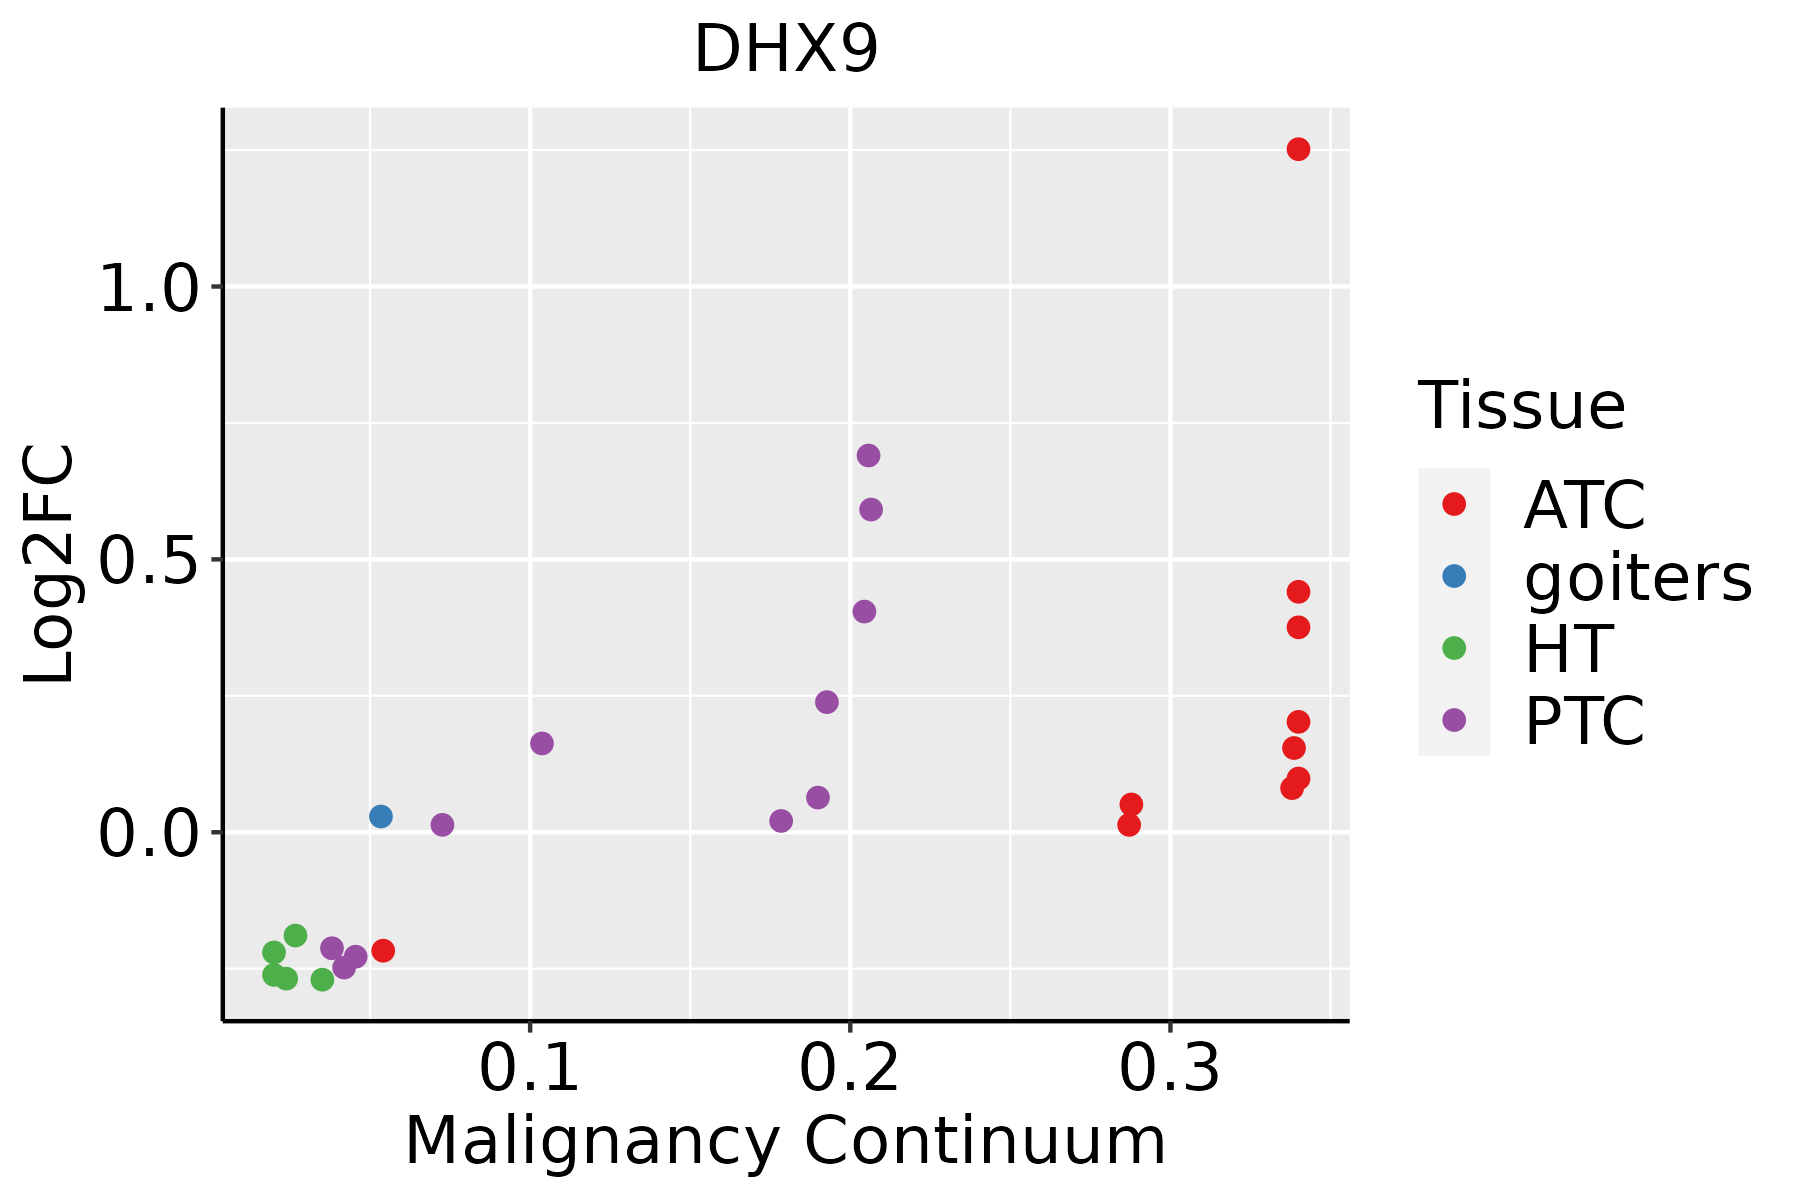
ATC: Anaplastic thyroid cancer
HT: Hashimoto's thyroiditis
PTC: Papillary thyroid cancer
∗log2FC in expression of this searched gene in stem-like cells from each diseased tissue sample relative to stem-like cells in normal samples in each tissue plotted against the malignancy continuum. Samples are colored based on if they are from different disease stage.

Top

Malignant transformation related pathway analysis

check buttonFind out the enriched GO biological processes and KEGG pathways involved in transition from healthy to precancer to cancer
check button Figure of enriched GO biological processes.
TissueDisease StageEnriched GO biological Processes
ColorectumADGO analysis - Figure of enriched GO biological processes: Top 15 enriched GO BP terms are showed in the bar plot of each disease state in each tissue. Each row represents a significant GO biological process which is colored according to the -log10(p.adjust).
ColorectumSERGO analysis - Figure of enriched GO biological processes: Top 15 enriched GO BP terms are showed in the bar plot of each disease state in each tissue. Each row represents a significant GO biological process which is colored according to the -log10(p.adjust).
ColorectumMSSGO analysis - Figure of enriched GO biological processes: Top 15 enriched GO BP terms are showed in the bar plot of each disease state in each tissue. Each row represents a significant GO biological process which is colored according to the -log10(p.adjust).
ColorectumMSI-HGO analysis - Figure of enriched GO biological processes: Top 15 enriched GO BP terms are showed in the bar plot of each disease state in each tissue. Each row represents a significant GO biological process which is colored according to the -log10(p.adjust).
ColorectumFAPGO analysis - Figure of enriched GO biological processes: Top 15 enriched GO BP terms are showed in the bar plot of each disease state in each tissue. Each row represents a significant GO biological process which is colored according to the -log10(p.adjust).
∗Top 15 enriched GO BP terms are showed in the bar plot of each disease state in each tissue. Each row represents a significant GO biological process which is colored according to the -log10(p.adjust).
Page: 1 2 3 4 5 6 7 8 9 

check button Enriched GO biological processes.
GO IDTissueDisease StageDescriptionGene RatioBg Ratiopvaluep.adjustCount
GO:005109022ThyroidATCregulation of DNA-binding transcription factor activity190/6293440/187231.49e-051.39e-04190
GO:006014823ThyroidATCpositive regulation of posttranscriptional gene silencing22/629331/187232.35e-052.06e-0422
GO:003248113ThyroidATCpositive regulation of type I interferon production35/629358/187232.70e-052.30e-0435
GO:003461228ThyroidATCresponse to tumor necrosis factor116/6293253/187233.22e-052.68e-04116
GO:000283123ThyroidATCregulation of response to biotic stimulus144/6293327/187234.94e-053.91e-04144
GO:200063724ThyroidATCpositive regulation of gene silencing by miRNA21/629330/187235.03e-053.96e-0421
GO:004683115ThyroidATCregulation of RNA export from nucleus11/629312/187235.11e-053.99e-0411
GO:006014717ThyroidATCregulation of posttranscriptional gene silencing31/629352/187231.06e-047.61e-0431
GO:006076012ThyroidATCpositive regulation of response to cytokine stimulus33/629357/187231.43e-049.91e-0433
GO:006096616ThyroidATCregulation of gene silencing by RNA31/629353/187231.74e-041.19e-0331
GO:006096418ThyroidATCregulation of gene silencing by miRNA29/629349/187232.11e-041.39e-0329
GO:003210324ThyroidATCpositive regulation of response to external stimulus178/6293427/187232.61e-041.67e-03178
GO:006075912ThyroidATCregulation of response to cytokine stimulus76/6293162/187232.92e-041.85e-0376
GO:003223911ThyroidATCregulation of nucleobase-containing compound transport12/629315/187233.10e-041.94e-0312
GO:007135627ThyroidATCcellular response to tumor necrosis factor102/6293229/187233.52e-042.18e-03102
GO:005160712ThyroidATCdefense response to virus115/6293265/187235.31e-043.09e-03115
GO:014054612ThyroidATCdefense response to symbiont115/6293265/187235.31e-043.09e-03115
GO:190236923ThyroidATCnegative regulation of RNA catabolic process39/629375/187237.65e-044.23e-0339
GO:007135912ThyroidATCcellular response to dsRNA15/629322/187239.63e-045.13e-0315
GO:003247913ThyroidATCregulation of type I interferon production47/629395/187239.81e-045.21e-0347
Page: 1 2 3 4 5 6 7 8 9 10 11 12 13 14 15 16 17 18 19 20 21 22 23 24 25 26 27 28 29 30 31 32 33 34 35 36 37 38 39 40 41 42 43 44 45 46 47 48 49 50 51 52 53 54 55 56 57 58 59 60 61 62 63 64 65 66 67 68 69 70 71 72 73 74 75 76 77 78 79 80 81 82 83 

check button Enriched KEGG pathways.
Pathway IDTissueDisease StageDescriptionGene RatioBg Ratiopvaluep.adjustqvalueCount
Page: 1 

Top

Cell-cell communication analysis

check buttonIdentification of potential cell-cell interactions between two cell types and their ligand-receptor pairs for different disease states
LigandReceptorLRpairPathwayTissueDisease Stage
Page: 1 

Top

Single-cell gene regulatory network inference analysis

check buttonFind out the significant the regulons (TFs) and the target genes of each regulon across cell types for different disease states
TFCell TypeTissueDisease StageTarget GeneRSSRegulon Activity
∗The dot plots of a searched regulon are shown for all cell subpopulations in each disease state of each tissue based on the regulon specific score inferred using pySCENIC and by calculating the average expression.
Page: 1 

Top

Somatic mutation of malignant transformation related genes

check buttonAnnotation of somatic variants for genes involved in malignant transformation
Hugo SymbolVariant ClassVariant ClassificationdbSNP RSHGVScHGVSpHGVSp ShortSWISSPROTBIOTYPESIFTPolyPhenTumor Sample BarcodeTissueHistologySexAgeStageTherapy TypesDrugsOutcome
DHX9SNVMissense_Mutationnovelc.1531N>Tp.Asp511Tyrp.D511YQ08211protein_codingdeleterious(0)probably_damaging(1)TCGA-A7-A5ZW-01Breastbreast invasive carcinomaFemale<65I/IIChemotherapycyclophosphamideCR
DHX9SNVMissense_Mutationc.2173N>Tp.Val725Phep.V725FQ08211protein_codingdeleterious(0.04)probably_damaging(0.998)TCGA-A8-A09Z-01Breastbreast invasive carcinomaFemale>=65I/IIUnknownUnknownSD
DHX9SNVMissense_Mutationc.3280C>Tp.His1094Tyrp.H1094YQ08211protein_codingtolerated(1)benign(0.157)TCGA-AC-A23H-01Breastbreast invasive carcinomaFemale>=65I/IIUnknownUnknownPD
DHX9SNVMissense_Mutationc.2714G>Ap.Arg905Glnp.R905QQ08211protein_codingdeleterious(0.02)probably_damaging(0.984)TCGA-AN-A046-01Breastbreast invasive carcinomaFemale>=65I/IIUnknownUnknownSD
DHX9SNVMissense_Mutationnovelc.2202N>Cp.Gln734Hisp.Q734HQ08211protein_codingdeleterious(0)probably_damaging(0.95)TCGA-BH-A0B6-01Breastbreast invasive carcinomaFemale<65I/IIUnknownUnknownSD
DHX9SNVMissense_Mutationrs754675901c.1582C>Tp.Arg528Cysp.R528CQ08211protein_codingdeleterious(0)probably_damaging(1)TCGA-BH-A18G-01Breastbreast invasive carcinomaFemale>=65I/IIUnknownUnknownSD
DHX9SNVMissense_Mutationc.176G>Ap.Ser59Asnp.S59NQ08211protein_codingtolerated(0.22)benign(0.281)TCGA-BH-A1F0-01Breastbreast invasive carcinomaFemale>=65I/IIUnknownUnknownPD
DHX9SNVMissense_Mutationnovelc.929N>Gp.Leu310Argp.L310RQ08211protein_codingdeleterious(0.01)probably_damaging(0.97)TCGA-C8-A8HQ-01Breastbreast invasive carcinomaFemale<65I/IIUnknownUnknownSD
DHX9SNVMissense_Mutationc.2588G>Ap.Arg863Hisp.R863HQ08211protein_codingdeleterious(0.05)probably_damaging(0.993)TCGA-D8-A1JE-01Breastbreast invasive carcinomaFemale<65I/IIChemotherapyadriamicinSD
DHX9SNVMissense_Mutationc.67N>Gp.Ile23Valp.I23VQ08211protein_codingtolerated(0.92)benign(0.028)TCGA-E9-A1NI-01Breastbreast invasive carcinomaFemale<65I/IIChemotherapydoxorubicinCR
Page: 1 2 3 4 5 6 7 8 9 10 11 12 13 14 15 16 

Top

Related drugs of malignant transformation related genes

check buttonIdentification of chemicals and drugs interact with genes involved in malignant transfromation
(DGIdb 4.0)
Entrez IDSymbolCategoryInteraction TypesDrug Claim NameDrug NamePMIDs
Page: 1