
|
|||||
|
 | |
| |
| |
| |
| |
| |
|
Gene: ZDHHC1 |
Gene summary for ZDHHC1 |
| Gene information | Species | Human | Gene symbol | ZDHHC1 | Gene ID | 29800 |
| Gene name | zinc finger DHHC-type containing 1 | |
| Gene Alias | C16orf1 | |
| Cytomap | 16q22.1 | |
| Gene Type | protein-coding | GO ID | GO:0002230 | UniProtAcc | Q8WTX9 |
Top |
Malignant transformation analysis |
| Identification of the aberrant gene expression in precancerous and cancerous lesions by comparing the gene expression of stem-like cells in diseased tissues with normal stem cells |
| Entrez ID | Symbol | Replicates | Species | Organ | Tissue | Adj P-value | Log2FC | Malignancy |
| 29800 | ZDHHC1 | LZE4T | Human | Esophagus | ESCC | 1.70e-03 | 1.19e-01 | 0.0811 |
| 29800 | ZDHHC1 | LZE22T | Human | Esophagus | ESCC | 1.57e-03 | 2.10e-01 | 0.068 |
| 29800 | ZDHHC1 | LZE24T | Human | Esophagus | ESCC | 2.32e-20 | 5.27e-01 | 0.0596 |
| 29800 | ZDHHC1 | P1T-E | Human | Esophagus | ESCC | 1.98e-11 | 4.67e-01 | 0.0875 |
| 29800 | ZDHHC1 | P2T-E | Human | Esophagus | ESCC | 3.91e-19 | 3.77e-01 | 0.1177 |
| 29800 | ZDHHC1 | P4T-E | Human | Esophagus | ESCC | 4.51e-19 | 4.03e-01 | 0.1323 |
| 29800 | ZDHHC1 | P5T-E | Human | Esophagus | ESCC | 1.52e-13 | 2.55e-01 | 0.1327 |
| 29800 | ZDHHC1 | P8T-E | Human | Esophagus | ESCC | 3.11e-13 | 3.03e-01 | 0.0889 |
| 29800 | ZDHHC1 | P9T-E | Human | Esophagus | ESCC | 1.34e-08 | 2.22e-01 | 0.1131 |
| 29800 | ZDHHC1 | P11T-E | Human | Esophagus | ESCC | 1.44e-21 | 6.72e-01 | 0.1426 |
| 29800 | ZDHHC1 | P12T-E | Human | Esophagus | ESCC | 6.97e-20 | 3.89e-01 | 0.1122 |
| 29800 | ZDHHC1 | P15T-E | Human | Esophagus | ESCC | 2.73e-10 | 1.96e-01 | 0.1149 |
| 29800 | ZDHHC1 | P16T-E | Human | Esophagus | ESCC | 9.01e-16 | 1.71e-01 | 0.1153 |
| 29800 | ZDHHC1 | P17T-E | Human | Esophagus | ESCC | 4.48e-07 | 2.57e-01 | 0.1278 |
| 29800 | ZDHHC1 | P19T-E | Human | Esophagus | ESCC | 1.17e-11 | 6.36e-01 | 0.1662 |
| 29800 | ZDHHC1 | P20T-E | Human | Esophagus | ESCC | 4.38e-08 | 1.84e-01 | 0.1124 |
| 29800 | ZDHHC1 | P21T-E | Human | Esophagus | ESCC | 2.73e-39 | 8.17e-01 | 0.1617 |
| 29800 | ZDHHC1 | P22T-E | Human | Esophagus | ESCC | 1.58e-39 | 6.49e-01 | 0.1236 |
| 29800 | ZDHHC1 | P23T-E | Human | Esophagus | ESCC | 1.03e-27 | 5.97e-01 | 0.108 |
| 29800 | ZDHHC1 | P24T-E | Human | Esophagus | ESCC | 6.70e-08 | 2.17e-01 | 0.1287 |
| Page: 1 2 3 4 |
| Tissue | Expression Dynamics | Abbreviation |
| Esophagus | 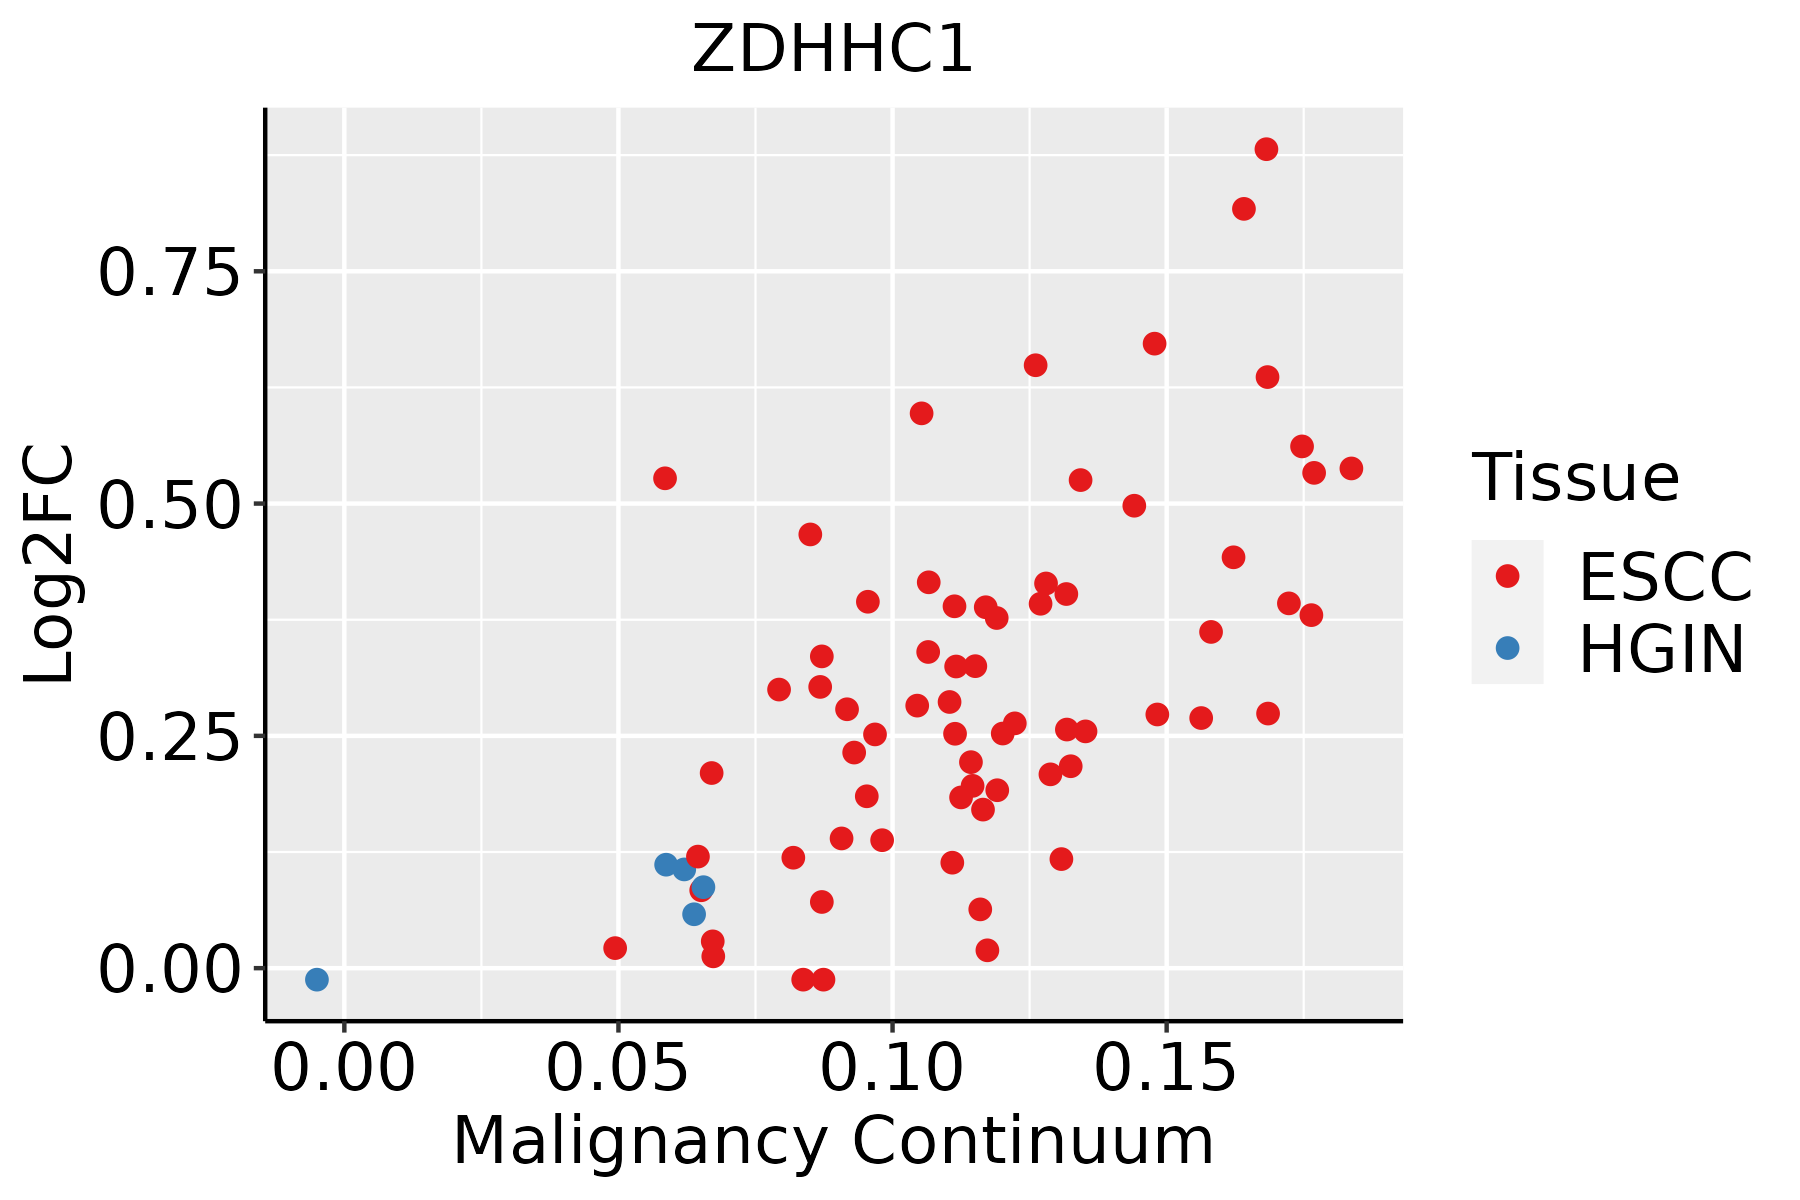 | ESCC: Esophageal squamous cell carcinoma |
| HGIN: High-grade intraepithelial neoplasias | ||
| LGIN: Low-grade intraepithelial neoplasias | ||
| Oral Cavity |  | EOLP: Erosive Oral lichen planus |
| LP: leukoplakia | ||
| NEOLP: Non-erosive oral lichen planus | ||
| OSCC: Oral squamous cell carcinoma |
| ∗log2FC in expression of this searched gene in stem-like cells from each diseased tissue sample relative to stem-like cells in normal samples in each tissue plotted against the malignancy continuum. Samples are colored based on if they are from different disease stage. |
Top |
Malignant transformation related pathway analysis |
| Find out the enriched GO biological processes and KEGG pathways involved in transition from healthy to precancer to cancer |
| Tissue | Disease Stage | Enriched GO biological Processes |
| Colorectum | AD |  |
| Colorectum | SER |  |
| Colorectum | MSS |  |
| Colorectum | MSI-H |  |
| Colorectum | FAP |  |
| ∗Top 15 enriched GO BP terms are showed in the bar plot of each disease state in each tissue. Each row represents a significant GO biological process which is colored according to the -log10(p.adjust). |
| Page: 1 2 3 4 5 6 7 8 9 |
| GO ID | Tissue | Disease Stage | Description | Gene Ratio | Bg Ratio | pvalue | p.adjust | Count |
| GO:009917314 | Thyroid | ATC | postsynapse organization | 78/6293 | 168/18723 | 3.66e-04 | 2.26e-03 | 78 |
| GO:190241414 | Thyroid | ATC | protein localization to cell junction | 43/6293 | 94/18723 | 9.54e-03 | 3.50e-02 | 43 |
| GO:00381793 | Thyroid | ATC | neurotrophin signaling pathway | 19/6293 | 36/18723 | 1.37e-02 | 4.77e-02 | 19 |
| Page: 1 2 3 4 5 6 7 8 |
| Pathway ID | Tissue | Disease Stage | Description | Gene Ratio | Bg Ratio | pvalue | p.adjust | qvalue | Count |
| Page: 1 |
Top |
Cell-cell communication analysis |
| Identification of potential cell-cell interactions between two cell types and their ligand-receptor pairs for different disease states |
| Ligand | Receptor | LRpair | Pathway | Tissue | Disease Stage |
| Page: 1 |
Top |
Single-cell gene regulatory network inference analysis |
| Find out the significant the regulons (TFs) and the target genes of each regulon across cell types for different disease states |
| TF | Cell Type | Tissue | Disease Stage | Target Gene | RSS | Regulon Activity |
| ∗The dot plots of a searched regulon are shown for all cell subpopulations in each disease state of each tissue based on the regulon specific score inferred using pySCENIC and by calculating the average expression. |
| Page: 1 |
Top |
Somatic mutation of malignant transformation related genes |
| Annotation of somatic variants for genes involved in malignant transformation |
| Hugo Symbol | Variant Class | Variant Classification | dbSNP RS | HGVSc | HGVSp | HGVSp Short | SWISSPROT | BIOTYPE | SIFT | PolyPhen | Tumor Sample Barcode | Tissue | Histology | Sex | Age | Stage | Therapy Types | Drugs | Outcome |
| ZDHHC1 | SNV | Missense_Mutation | c.749T>G | p.Leu250Arg | p.L250R | Q8WTX9 | protein_coding | deleterious(0.02) | probably_damaging(0.972) | TCGA-A2-A04V-01 | Breast | breast invasive carcinoma | Female | <65 | I/II | Chemotherapy | cytoxan | PD | |
| ZDHHC1 | SNV | Missense_Mutation | novel | c.433N>A | p.Ala145Thr | p.A145T | Q8WTX9 | protein_coding | deleterious(0.02) | benign(0.278) | TCGA-AR-A2LE-01 | Breast | breast invasive carcinoma | Female | >=65 | I/II | Hormone Therapy | tamoxiphen | PD |
| ZDHHC1 | SNV | Missense_Mutation | c.1205N>C | p.Arg402Pro | p.R402P | Q8WTX9 | protein_coding | tolerated_low_confidence(0.37) | benign(0) | TCGA-BH-A0BZ-01 | Breast | breast invasive carcinoma | Female | <65 | III/IV | Chemotherapy | doxorubicin | CR | |
| ZDHHC1 | SNV | Missense_Mutation | novel | c.197N>C | p.Gly66Ala | p.G66A | Q8WTX9 | protein_coding | tolerated(0.11) | probably_damaging(0.912) | TCGA-BH-A8FZ-01 | Breast | breast invasive carcinoma | Female | <65 | I/II | Unknown | Unknown | SD |
| ZDHHC1 | deletion | Frame_Shift_Del | novel | c.896delA | p.Glu299GlyfsTer36 | p.E299Gfs*36 | Q8WTX9 | protein_coding | TCGA-D8-A27V-01 | Breast | breast invasive carcinoma | Female | <65 | I/II | Hormone Therapy | tamoxiphen | SD | ||
| ZDHHC1 | SNV | Missense_Mutation | novel | c.203G>A | p.Gly68Glu | p.G68E | Q8WTX9 | protein_coding | deleterious(0) | probably_damaging(1) | TCGA-2W-A8YY-01 | Cervix | cervical & endocervical cancer | Female | <65 | I/II | Chemotherapy | cisplatin | CR |
| ZDHHC1 | SNV | Missense_Mutation | c.878N>A | p.Gly293Glu | p.G293E | Q8WTX9 | protein_coding | tolerated(0.59) | benign(0.003) | TCGA-AA-3495-01 | Colorectum | colon adenocarcinoma | Male | >=65 | I/II | Unknown | Unknown | SD | |
| ZDHHC1 | SNV | Missense_Mutation | rs769302084 | c.916N>T | p.Arg306Trp | p.R306W | Q8WTX9 | protein_coding | deleterious(0) | possibly_damaging(0.548) | TCGA-AA-3877-01 | Colorectum | colon adenocarcinoma | Female | >=65 | I/II | Unknown | Unknown | SD |
| ZDHHC1 | SNV | Missense_Mutation | c.1187N>T | p.Ala396Val | p.A396V | Q8WTX9 | protein_coding | tolerated_low_confidence(0.24) | benign(0) | TCGA-AZ-4313-01 | Colorectum | colon adenocarcinoma | Female | <65 | I/II | Unknown | Unknown | SD | |
| ZDHHC1 | SNV | Missense_Mutation | rs769302084 | c.916N>T | p.Arg306Trp | p.R306W | Q8WTX9 | protein_coding | deleterious(0) | possibly_damaging(0.548) | TCGA-AZ-4313-01 | Colorectum | colon adenocarcinoma | Female | <65 | I/II | Unknown | Unknown | SD |
| Page: 1 2 3 4 |
Top |
Related drugs of malignant transformation related genes |
| Identification of chemicals and drugs interact with genes involved in malignant transfromation |
| (DGIdb 4.0) |
| Entrez ID | Symbol | Category | Interaction Types | Drug Claim Name | Drug Name | PMIDs |
| Page: 1 |

Copyright 2023-Present -The University of Texas Health Science Center at Houston |