Schematic overview of the cellular and molecular mechanisms involved in the cancer progression, including the proposed cellular and molecular mechanisms in cancer cells trajectory. AT1: alveolar type 1 cells; AT2: alveolar type 2 cells; AAH: atypical adenomatous hyperplasia; AIS: adenocarcinoma in situ; MIA: minimally invasive adenocarcinoma; IA: invasive adenocarcinoma; EMT: epithelial-mesenchymal transition

Home

Download

Statistics

Help

Contact

Center for Computational Systems Medicine
leaf

Gene summary

leaf

Malignant transformation analysis

leaf

Malignant transformation related pathway analysis

leaf

Cell-cell communication analysis

leaf

Single-cell gene regulatory network inference analysis

leaf

Somatic mutation of malignant transformation related genes

leaf

Related drugs of malignant transformation related genes

Gene: ZC3H12A

Gene summary for ZC3H12A

check button Gene summary.

Gene informationSpeciesHuman
Gene symbol

ZC3H12A

Gene ID

80149

Gene namezinc finger CCCH-type containing 12A
Gene AliasMCPIP
Cytomap1p34.3
Gene Typeprotein-coding
GO ID

GO:0000165

UniProtAcc

Q5D1E8


Top

Malignant transformation analysis

check button Identification of the aberrant gene expression in precancerous and cancerous lesions by comparing the gene expression of stem-like cells in diseased tissues with normal stem cells
check button Malignant transformation involving gene list.
Entrez IDSymbolReplicatesSpeciesOrganTissueAdj P-valueLog2FCMalignancy
80149ZC3H12ALZE8THumanEsophagusESCC3.92e-231.39e+000.067
80149ZC3H12ALZE20THumanEsophagusESCC1.23e-037.61e-010.0662
80149ZC3H12ALZE24THumanEsophagusESCC5.58e-141.14e+000.0596
80149ZC3H12ALZE21THumanEsophagusESCC4.72e-039.34e-010.0655
80149ZC3H12AP1T-EHumanEsophagusESCC5.46e-161.51e+000.0875
80149ZC3H12AP2T-EHumanEsophagusESCC8.06e-381.27e+000.1177
80149ZC3H12AP4T-EHumanEsophagusESCC2.12e-177.93e-010.1323
80149ZC3H12AP5T-EHumanEsophagusESCC6.03e-309.50e-010.1327
80149ZC3H12AP8T-EHumanEsophagusESCC6.27e-127.93e-010.0889
80149ZC3H12AP9T-EHumanEsophagusESCC4.68e-083.87e-010.1131
80149ZC3H12AP10T-EHumanEsophagusESCC2.66e-06-1.50e-010.116
80149ZC3H12AP11T-EHumanEsophagusESCC1.64e-171.68e+000.1426
80149ZC3H12AP15T-EHumanEsophagusESCC5.62e-147.66e-010.1149
80149ZC3H12AP20T-EHumanEsophagusESCC8.48e-351.98e+000.1124
80149ZC3H12AP21T-EHumanEsophagusESCC7.09e-461.78e+000.1617
80149ZC3H12AP22T-EHumanEsophagusESCC1.77e-03-8.40e-020.1236
80149ZC3H12AP23T-EHumanEsophagusESCC4.16e-492.25e+000.108
80149ZC3H12AP24T-EHumanEsophagusESCC8.32e-065.47e-010.1287
80149ZC3H12AP26T-EHumanEsophagusESCC2.57e-107.52e-010.1276
80149ZC3H12AP27T-EHumanEsophagusESCC7.78e-291.42e+000.1055
Page: 1 2 3 4 5 6 

check button Transcriptomic changes along malignancy continuum.
TissueExpression DynamicsAbbreviation
EsophagusThe image shows the transcriptomic changes along malignancy continuum.log2FC in expression of this searched gene in stem-like cells from each diseased tissue sample relative to stem-like cells in normal samples in each tissue plotted against the malignancy continuum. Samples are colored based on if they are from different disease stage.
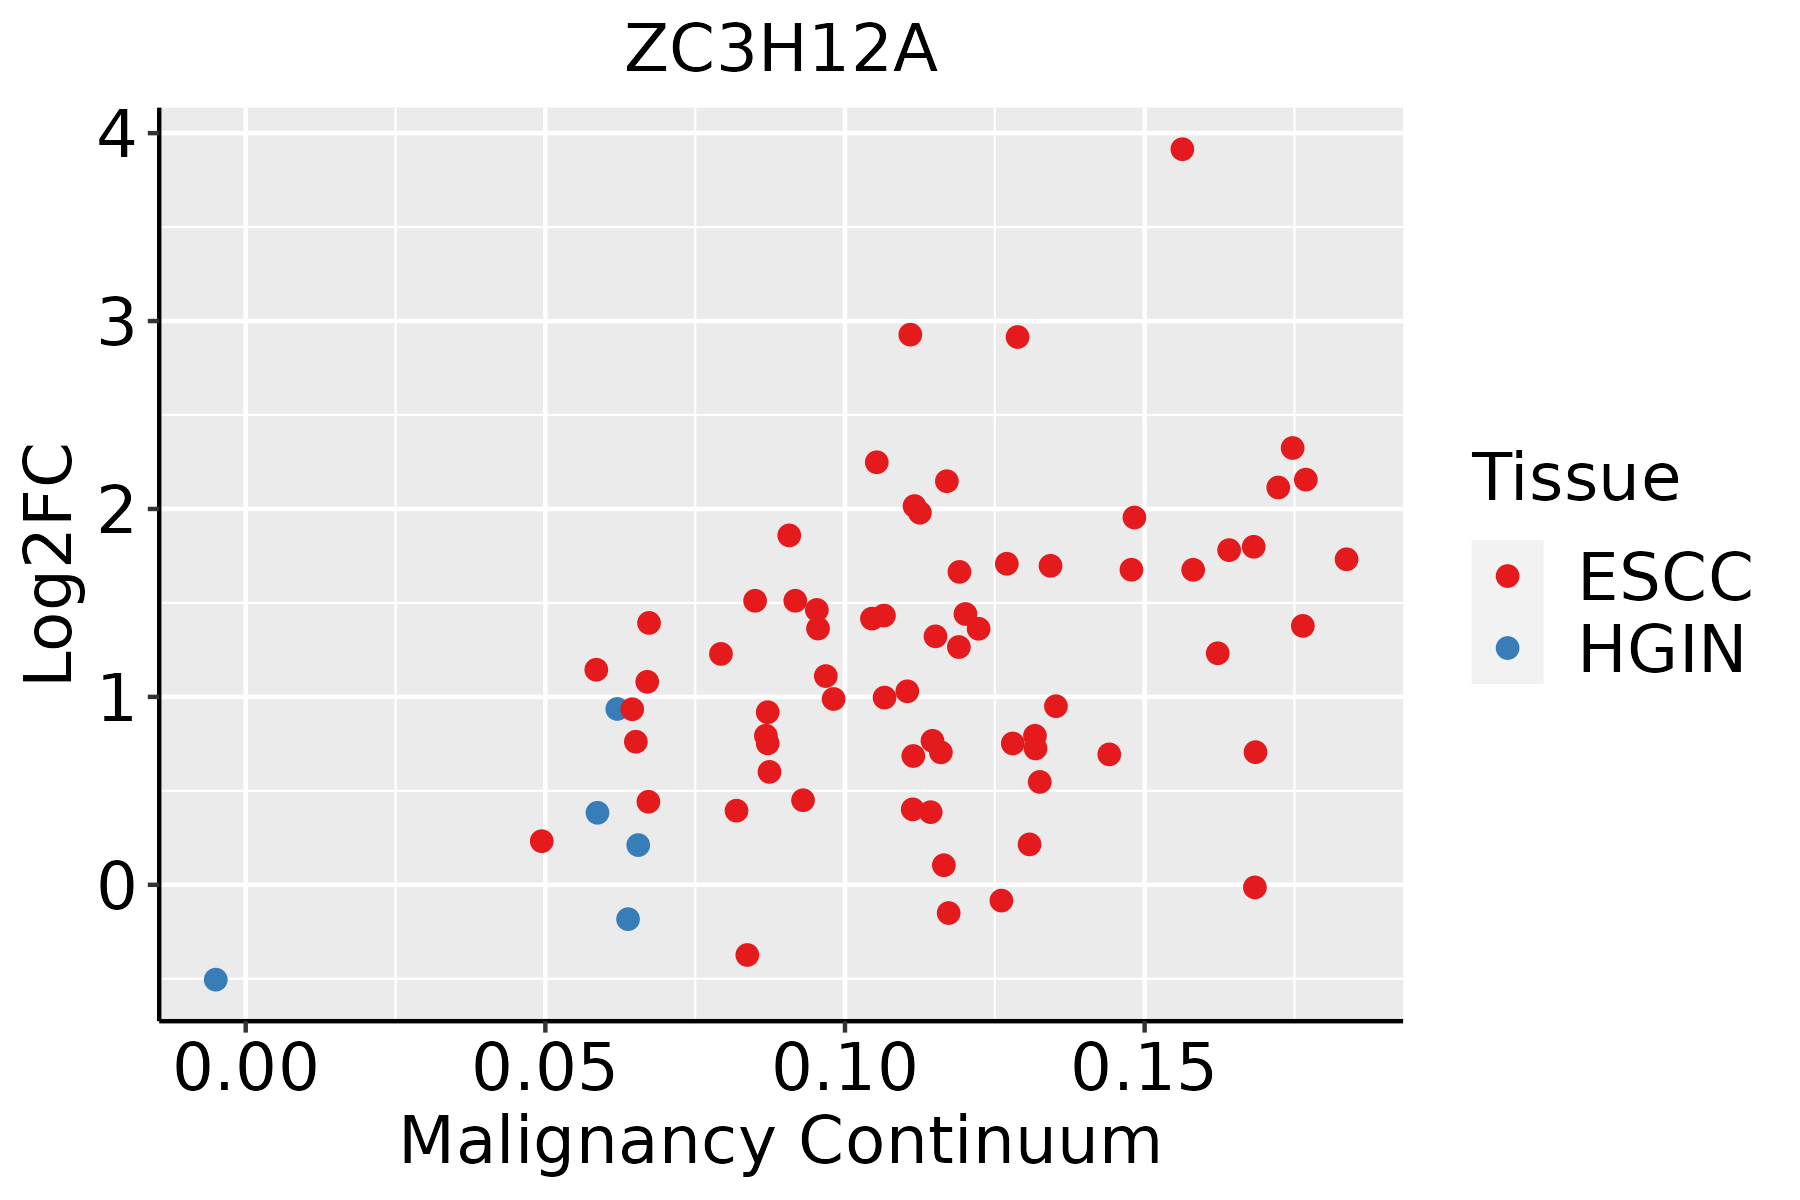
ESCC: Esophageal squamous cell carcinoma
HGIN: High-grade intraepithelial neoplasias
LGIN: Low-grade intraepithelial neoplasias
LiverThe image shows the transcriptomic changes along malignancy continuum.log2FC in expression of this searched gene in stem-like cells from each diseased tissue sample relative to stem-like cells in normal samples in each tissue plotted against the malignancy continuum. Samples are colored based on if they are from different disease stage.
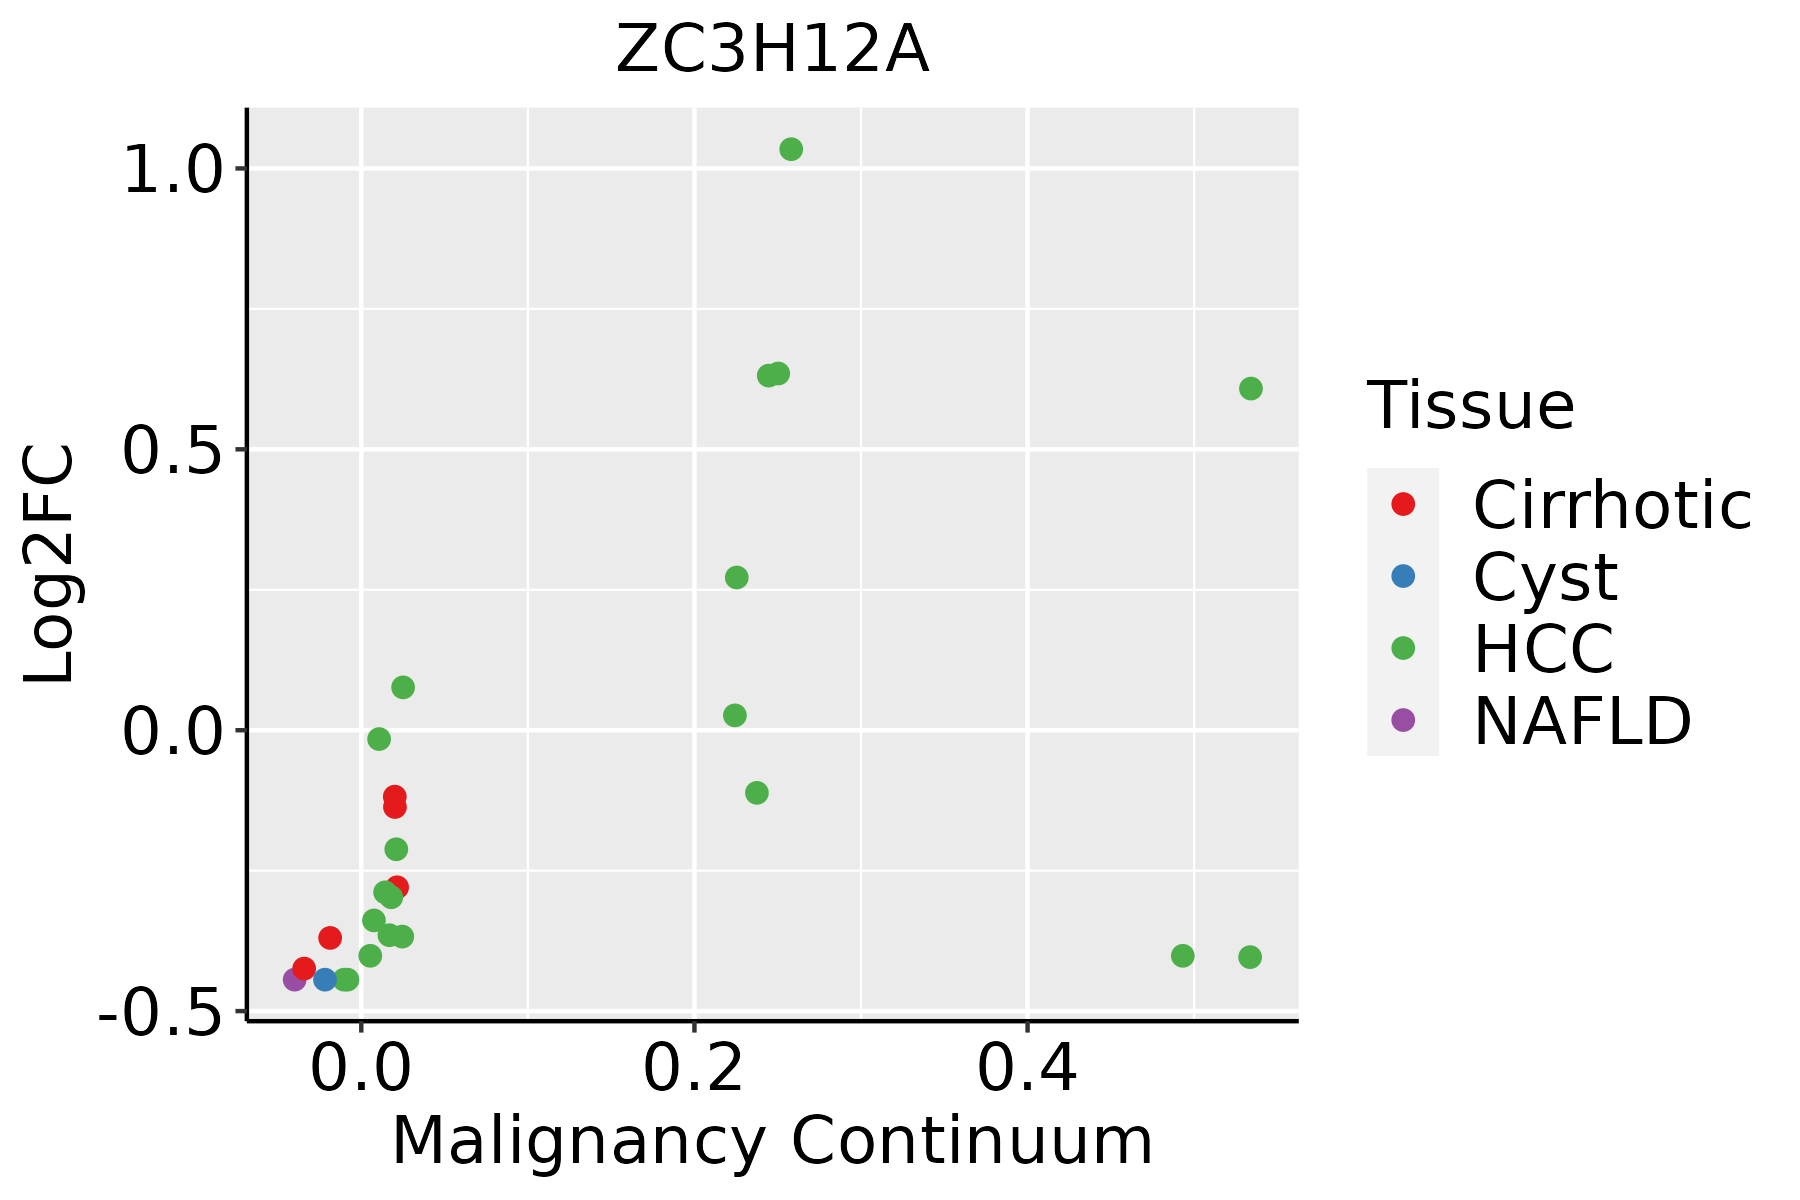
HCC: Hepatocellular carcinoma
NAFLD: Non-alcoholic fatty liver disease
LungThe image shows the transcriptomic changes along malignancy continuum.log2FC in expression of this searched gene in stem-like cells from each diseased tissue sample relative to stem-like cells in normal samples in each tissue plotted against the malignancy continuum. Samples are colored based on if they are from different disease stage.
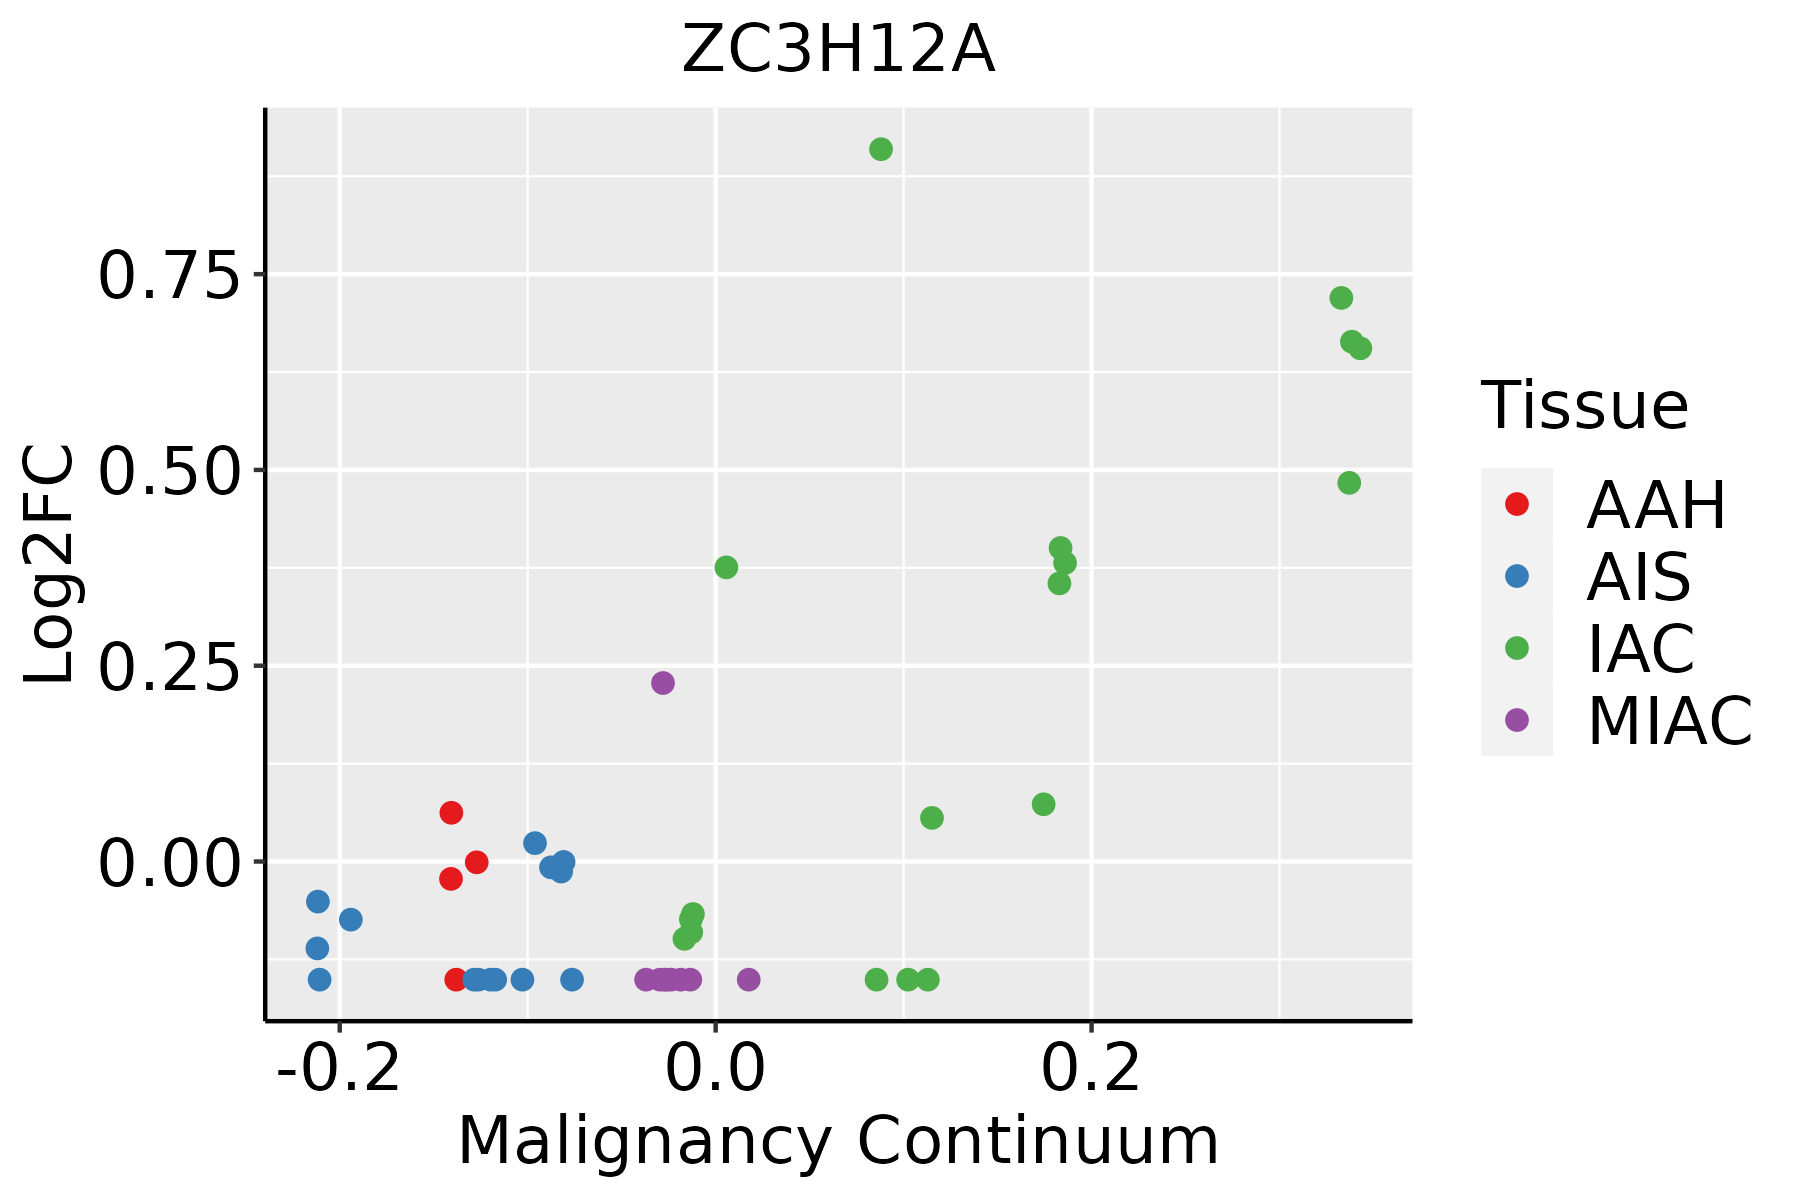
AAH: Atypical adenomatous hyperplasia
AIS: Adenocarcinoma in situ
IAC: Invasive lung adenocarcinoma
MIA: Minimally invasive adenocarcinoma
Oral CavityThe image shows the transcriptomic changes along malignancy continuum.log2FC in expression of this searched gene in stem-like cells from each diseased tissue sample relative to stem-like cells in normal samples in each tissue plotted against the malignancy continuum. Samples are colored based on if they are from different disease stage.
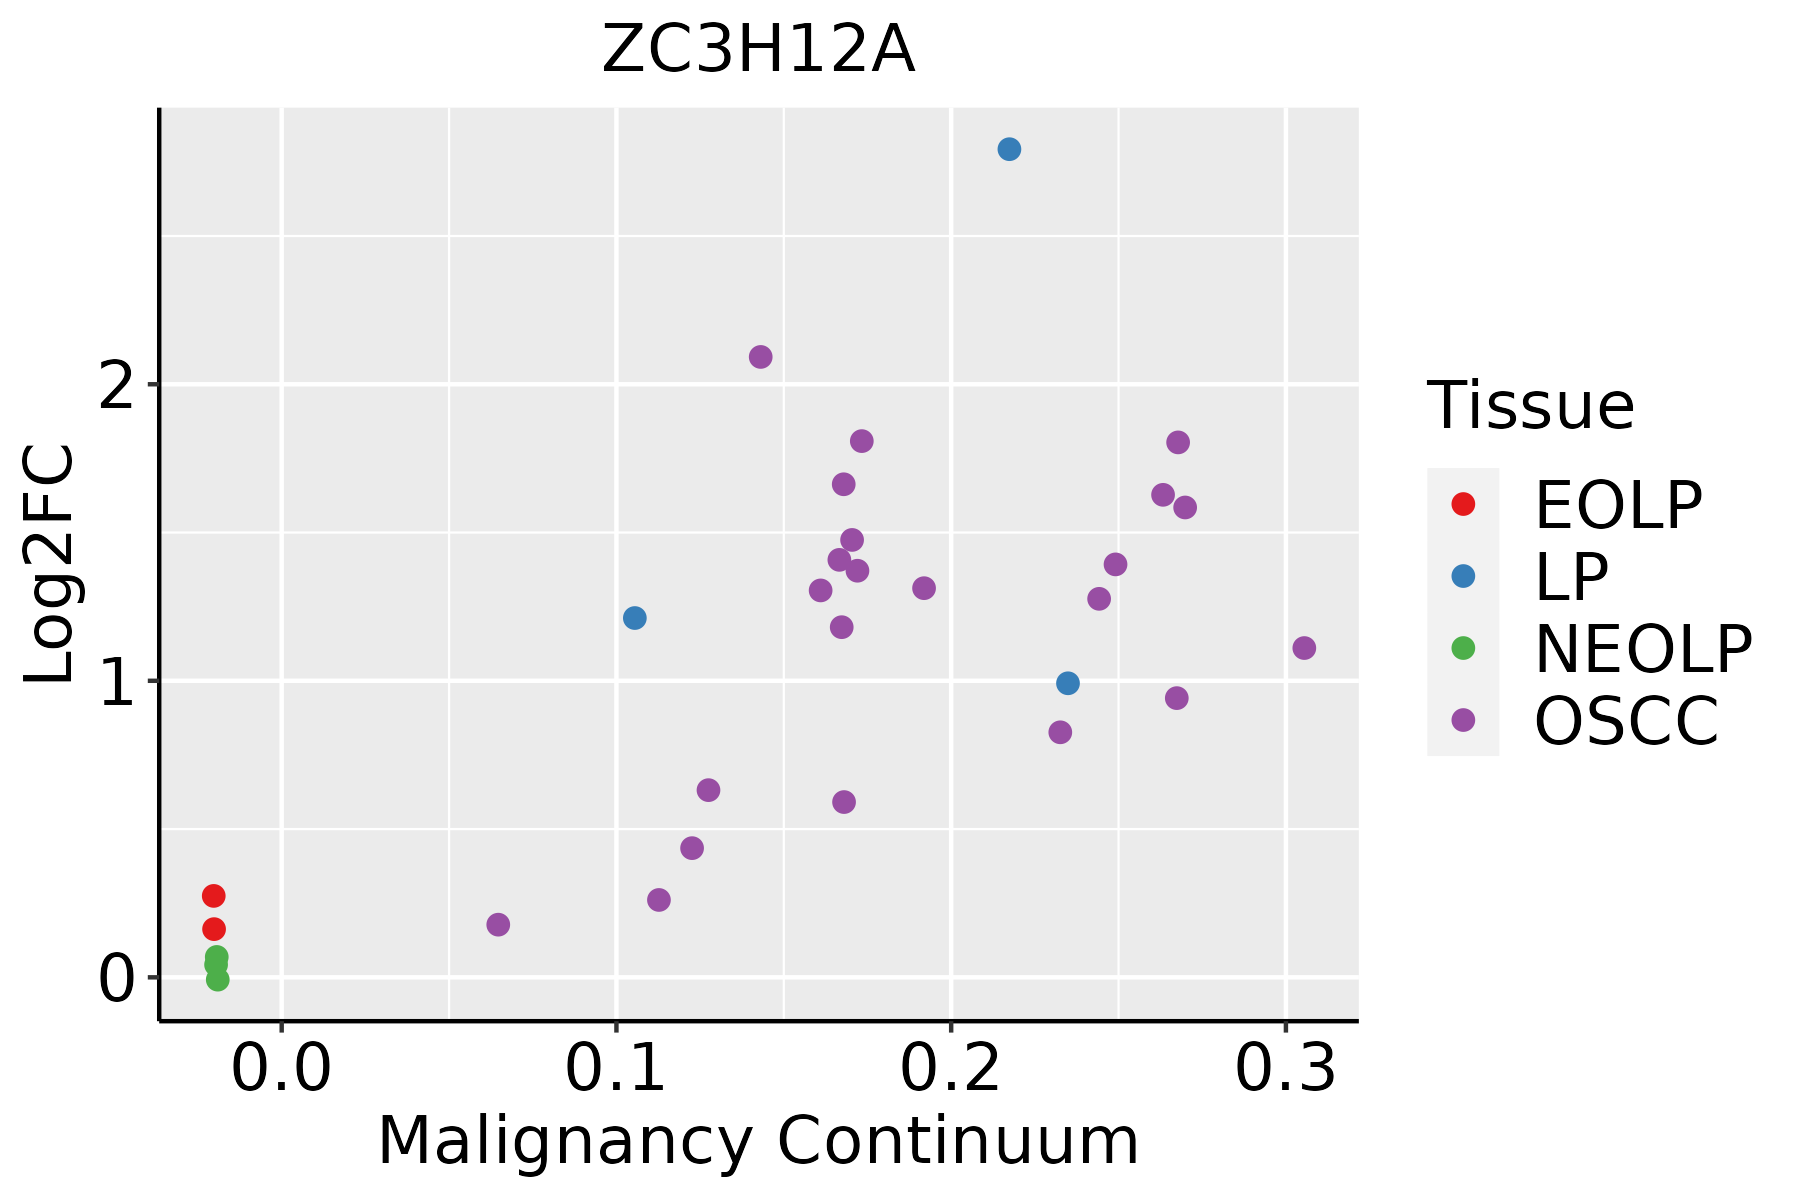
EOLP: Erosive Oral lichen planus
LP: leukoplakia
NEOLP: Non-erosive oral lichen planus
OSCC: Oral squamous cell carcinoma
ProstateThe image shows the transcriptomic changes along malignancy continuum.log2FC in expression of this searched gene in stem-like cells from each diseased tissue sample relative to stem-like cells in normal samples in each tissue plotted against the malignancy continuum. Samples are colored based on if they are from different disease stage.BPH: Benign Prostatic Hyperplasia
SkinThe image shows the transcriptomic changes along malignancy continuum.log2FC in expression of this searched gene in stem-like cells from each diseased tissue sample relative to stem-like cells in normal samples in each tissue plotted against the malignancy continuum. Samples are colored based on if they are from different disease stage.
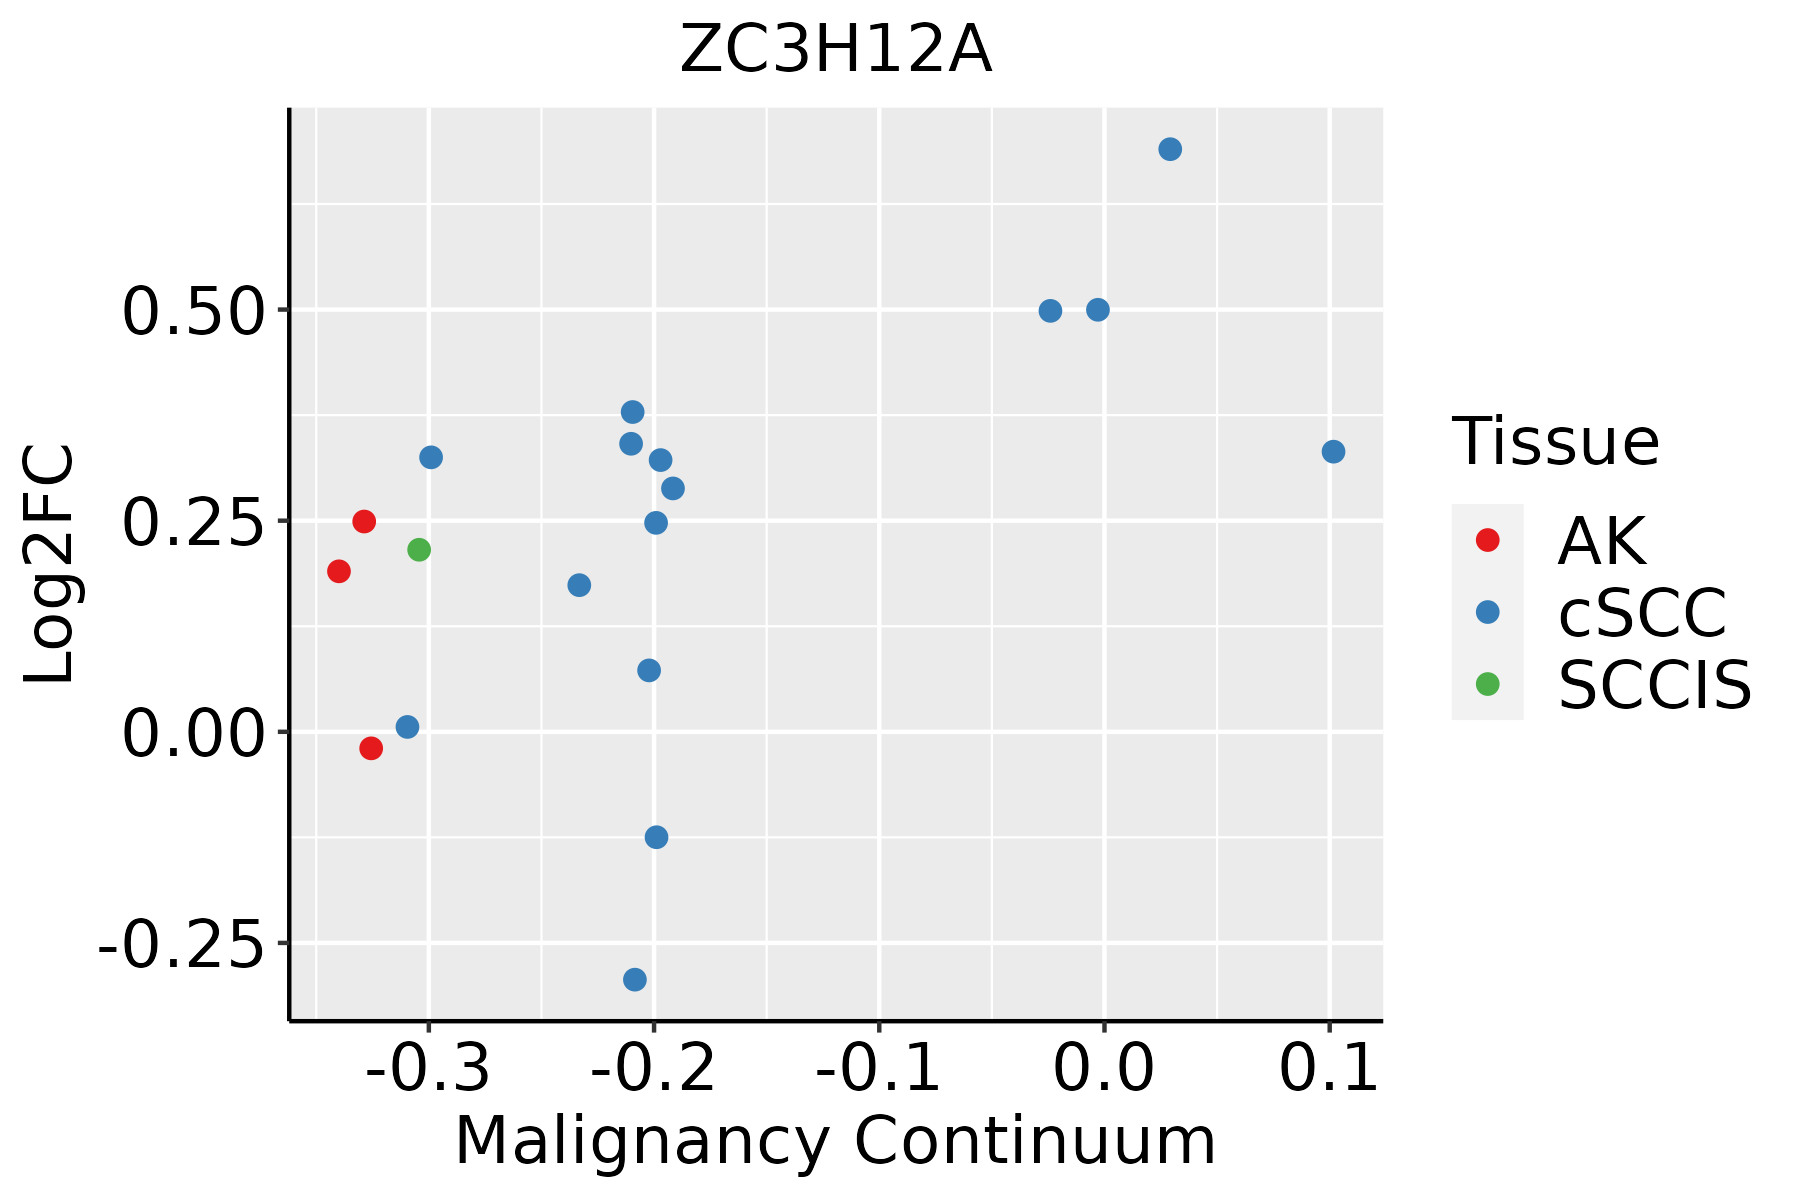
AK: Actinic keratosis
cSCC: Cutaneous squamous cell carcinoma
SCCIS:squamous cell carcinoma in situ
∗log2FC in expression of this searched gene in stem-like cells from each diseased tissue sample relative to stem-like cells in normal samples in each tissue plotted against the malignancy continuum. Samples are colored based on if they are from different disease stage.

Top

Malignant transformation related pathway analysis

check buttonFind out the enriched GO biological processes and KEGG pathways involved in transition from healthy to precancer to cancer
check button Figure of enriched GO biological processes.
TissueDisease StageEnriched GO biological Processes
ColorectumADGO analysis - Figure of enriched GO biological processes: Top 15 enriched GO BP terms are showed in the bar plot of each disease state in each tissue. Each row represents a significant GO biological process which is colored according to the -log10(p.adjust).
ColorectumSERGO analysis - Figure of enriched GO biological processes: Top 15 enriched GO BP terms are showed in the bar plot of each disease state in each tissue. Each row represents a significant GO biological process which is colored according to the -log10(p.adjust).
ColorectumMSSGO analysis - Figure of enriched GO biological processes: Top 15 enriched GO BP terms are showed in the bar plot of each disease state in each tissue. Each row represents a significant GO biological process which is colored according to the -log10(p.adjust).
ColorectumMSI-HGO analysis - Figure of enriched GO biological processes: Top 15 enriched GO BP terms are showed in the bar plot of each disease state in each tissue. Each row represents a significant GO biological process which is colored according to the -log10(p.adjust).
ColorectumFAPGO analysis - Figure of enriched GO biological processes: Top 15 enriched GO BP terms are showed in the bar plot of each disease state in each tissue. Each row represents a significant GO biological process which is colored according to the -log10(p.adjust).
∗Top 15 enriched GO BP terms are showed in the bar plot of each disease state in each tissue. Each row represents a significant GO biological process which is colored according to the -log10(p.adjust).
Page: 1 2 3 4 5 6 7 8 9 

check button Enriched GO biological processes.
GO IDTissueDisease StageDescriptionGene RatioBg Ratiopvaluep.adjustCount
GO:190303717EsophagusESCCregulation of leukocyte cell-cell adhesion174/8552336/187231.36e-024.43e-02174
GO:00300984EsophagusESCClymphocyte differentiation192/8552374/187231.52e-024.93e-02192
GO:001603212LiverCirrhoticviral process203/4634415/187235.40e-273.76e-24203
GO:000989612LiverCirrhoticpositive regulation of catabolic process215/4634492/187231.13e-203.56e-18215
GO:007259412LiverCirrhoticestablishment of protein localization to organelle189/4634422/187231.01e-192.45e-17189
GO:190136111LiverCirrhoticorganic cyclic compound catabolic process213/4634495/187231.58e-193.67e-17213
GO:003133112LiverCirrhoticpositive regulation of cellular catabolic process190/4634427/187231.94e-194.18e-17190
GO:000697912LiverCirrhoticresponse to oxidative stress196/4634446/187232.80e-195.86e-17196
GO:001943911LiverCirrhoticaromatic compound catabolic process202/4634467/187236.93e-191.28e-16202
GO:190331111LiverCirrhoticregulation of mRNA metabolic process140/4634288/187231.07e-181.91e-16140
GO:004427011LiverCirrhoticcellular nitrogen compound catabolic process195/4634451/187232.99e-184.94e-16195
GO:004670011LiverCirrhoticheterocycle catabolic process192/4634445/187237.17e-181.12e-15192
GO:001905812LiverCirrhoticviral life cycle148/4634317/187231.12e-171.64e-15148
GO:004586212LiverCirrhoticpositive regulation of proteolysis163/4634372/187234.18e-165.14e-14163
GO:000641712LiverCirrhoticregulation of translation194/4634468/187237.28e-168.79e-14194
GO:003465511LiverCirrhoticnucleobase-containing compound catabolic process171/4634407/187239.07e-159.33e-13171
GO:003238611LiverCirrhoticregulation of intracellular transport147/4634337/187231.84e-141.72e-12147
GO:006219712LiverCirrhoticcellular response to chemical stress147/4634337/187231.84e-141.72e-12147
GO:004440312LiverCirrhoticbiological process involved in symbiotic interaction131/4634290/187232.00e-141.84e-12131
GO:000640111LiverCirrhoticRNA catabolic process126/4634278/187234.64e-144.10e-12126
Page: 1 2 3 4 5 6 7 8 9 10 11 12 13 14 15 16 17 18 19 20 21 22 23 24 25 26 27 28 29 30 31 32 33 34 35 36 37 38 39 40 41 42 43 44 45 46 47 48 49 50 51 52 53 54 55 56 57 58 59 60 61 62 63 64 65 66 67 68 69 70 71 72 

check button Enriched KEGG pathways.
Pathway IDTissueDisease StageDescriptionGene RatioBg Ratiopvaluep.adjustqvalueCount
Page: 1 

Top

Cell-cell communication analysis

check buttonIdentification of potential cell-cell interactions between two cell types and their ligand-receptor pairs for different disease states
LigandReceptorLRpairPathwayTissueDisease Stage
Page: 1 

Top

Single-cell gene regulatory network inference analysis

check buttonFind out the significant the regulons (TFs) and the target genes of each regulon across cell types for different disease states
TFCell TypeTissueDisease StageTarget GeneRSSRegulon Activity
∗The dot plots of a searched regulon are shown for all cell subpopulations in each disease state of each tissue based on the regulon specific score inferred using pySCENIC and by calculating the average expression.
Page: 1 

Top

Somatic mutation of malignant transformation related genes

check buttonAnnotation of somatic variants for genes involved in malignant transformation
Hugo SymbolVariant ClassVariant ClassificationdbSNP RSHGVScHGVSpHGVSp ShortSWISSPROTBIOTYPESIFTPolyPhenTumor Sample BarcodeTissueHistologySexAgeStageTherapy TypesDrugsOutcome
ZC3H12ASNVMissense_Mutationnovelc.925N>Cp.Gly309Argp.G309RQ5D1E8protein_codingdeleterious(0)probably_damaging(0.991)TCGA-A7-A6VY-01Breastbreast invasive carcinomaFemale<65I/IIChemotherapycyclophosphamideCR
ZC3H12ASNVMissense_Mutationnovelc.698N>Tp.Ala233Valp.A233VQ5D1E8protein_codingdeleterious(0)probably_damaging(0.999)TCGA-AC-A2FE-01Breastbreast invasive carcinomaFemale<65III/IVChemotherapyadriamycinPD
ZC3H12ASNVMissense_Mutationnovelc.754N>Ap.Glu252Lysp.E252KQ5D1E8protein_codingdeleterious(0.02)probably_damaging(0.954)TCGA-AC-A2QI-01Breastbreast invasive carcinomaFemale>=65III/IVChemotherapycytoxanCR
ZC3H12ASNVMissense_Mutationc.1711N>Ap.Ala571Thrp.A571TQ5D1E8protein_codingtolerated(0.33)benign(0.044)TCGA-AN-A0AK-01Breastbreast invasive carcinomaFemale>=65I/IIUnknownUnknownSD
ZC3H12ASNVMissense_Mutationc.1792N>Gp.Ser598Glyp.S598GQ5D1E8protein_codingdeleterious_low_confidence(0.02)benign(0)TCGA-AO-A128-01Breastbreast invasive carcinomaFemale<65I/IIChemotherapydoxorubicinSD
ZC3H12ASNVMissense_Mutationc.1684N>Ap.Gly562Serp.G562SQ5D1E8protein_codingdeleterious(0.04)benign(0.219)TCGA-BH-A0E0-01Breastbreast invasive carcinomaFemale<65III/IVChemotherapydocetaxelSD
ZC3H12ASNVMissense_Mutationc.1457N>Gp.Ala486Glyp.A486GQ5D1E8protein_codingtolerated(0.57)benign(0.001)TCGA-E9-A245-01Breastbreast invasive carcinomaFemale<65I/IIHormone TherapytamoxiphenSD
ZC3H12ASNVMissense_Mutationnovelc.574N>Gp.Pro192Alap.P192AQ5D1E8protein_codingtolerated(0.25)probably_damaging(0.99)TCGA-S3-AA10-01Breastbreast invasive carcinomaFemale>=65I/IIChemotherapycytoxanCR
ZC3H12ASNVMissense_Mutationnovelc.725C>Tp.Ser242Phep.S242FQ5D1E8protein_codingdeleterious(0)probably_damaging(1)TCGA-XX-A89A-01Breastbreast invasive carcinomaFemale>=65I/IIUnknownUnknownSD
ZC3H12AinsertionNonsense_Mutationnovelc.971_972insTTGCTAAGAGTCCCCTAGCATCTTCCTGATGGTCTTTCTGCCTTp.Glu324AspfsTer3p.E324Dfs*3Q5D1E8protein_codingTCGA-AR-A0TY-01Breastbreast invasive carcinomaFemale<65I/IIUnspecificPaclitaxelPD
Page: 1 2 3 4 5 6 7 8 

Top

Related drugs of malignant transformation related genes

check buttonIdentification of chemicals and drugs interact with genes involved in malignant transfromation
(DGIdb 4.0)
Entrez IDSymbolCategoryInteraction TypesDrug Claim NameDrug NamePMIDs
Page: 1