| Tissue | Expression Dynamics | Abbreviation |
| Cervix | 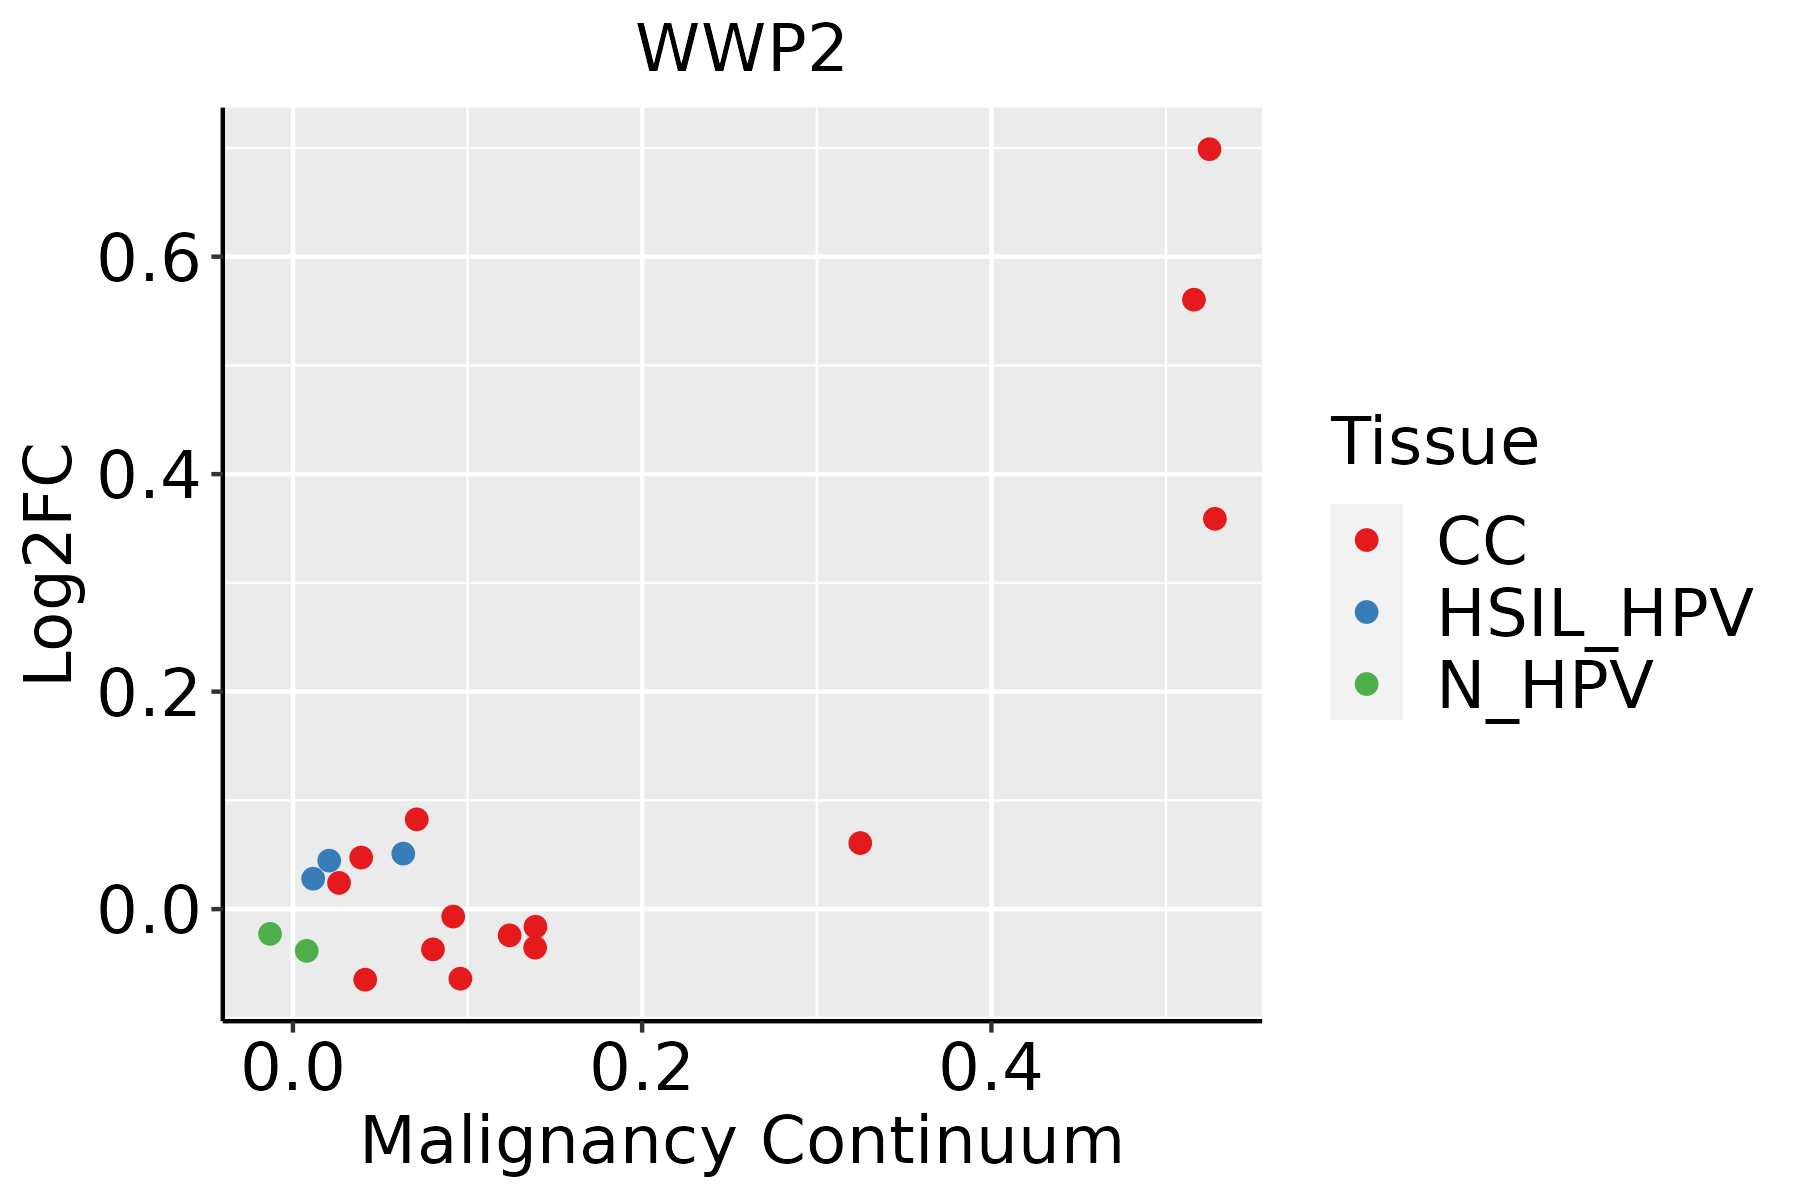 | CC: Cervix cancer |
| HSIL_HPV: HPV-infected high-grade squamous intraepithelial lesions |
| N_HPV: HPV-infected normal cervix |
| Colorectum (GSE201348) |  | FAP: Familial adenomatous polyposis |
| CRC: Colorectal cancer |
| Colorectum (HTA11) |  | AD: Adenomas |
| SER: Sessile serrated lesions |
| MSI-H: Microsatellite-high colorectal cancer |
| MSS: Microsatellite stable colorectal cancer |
| Esophagus | 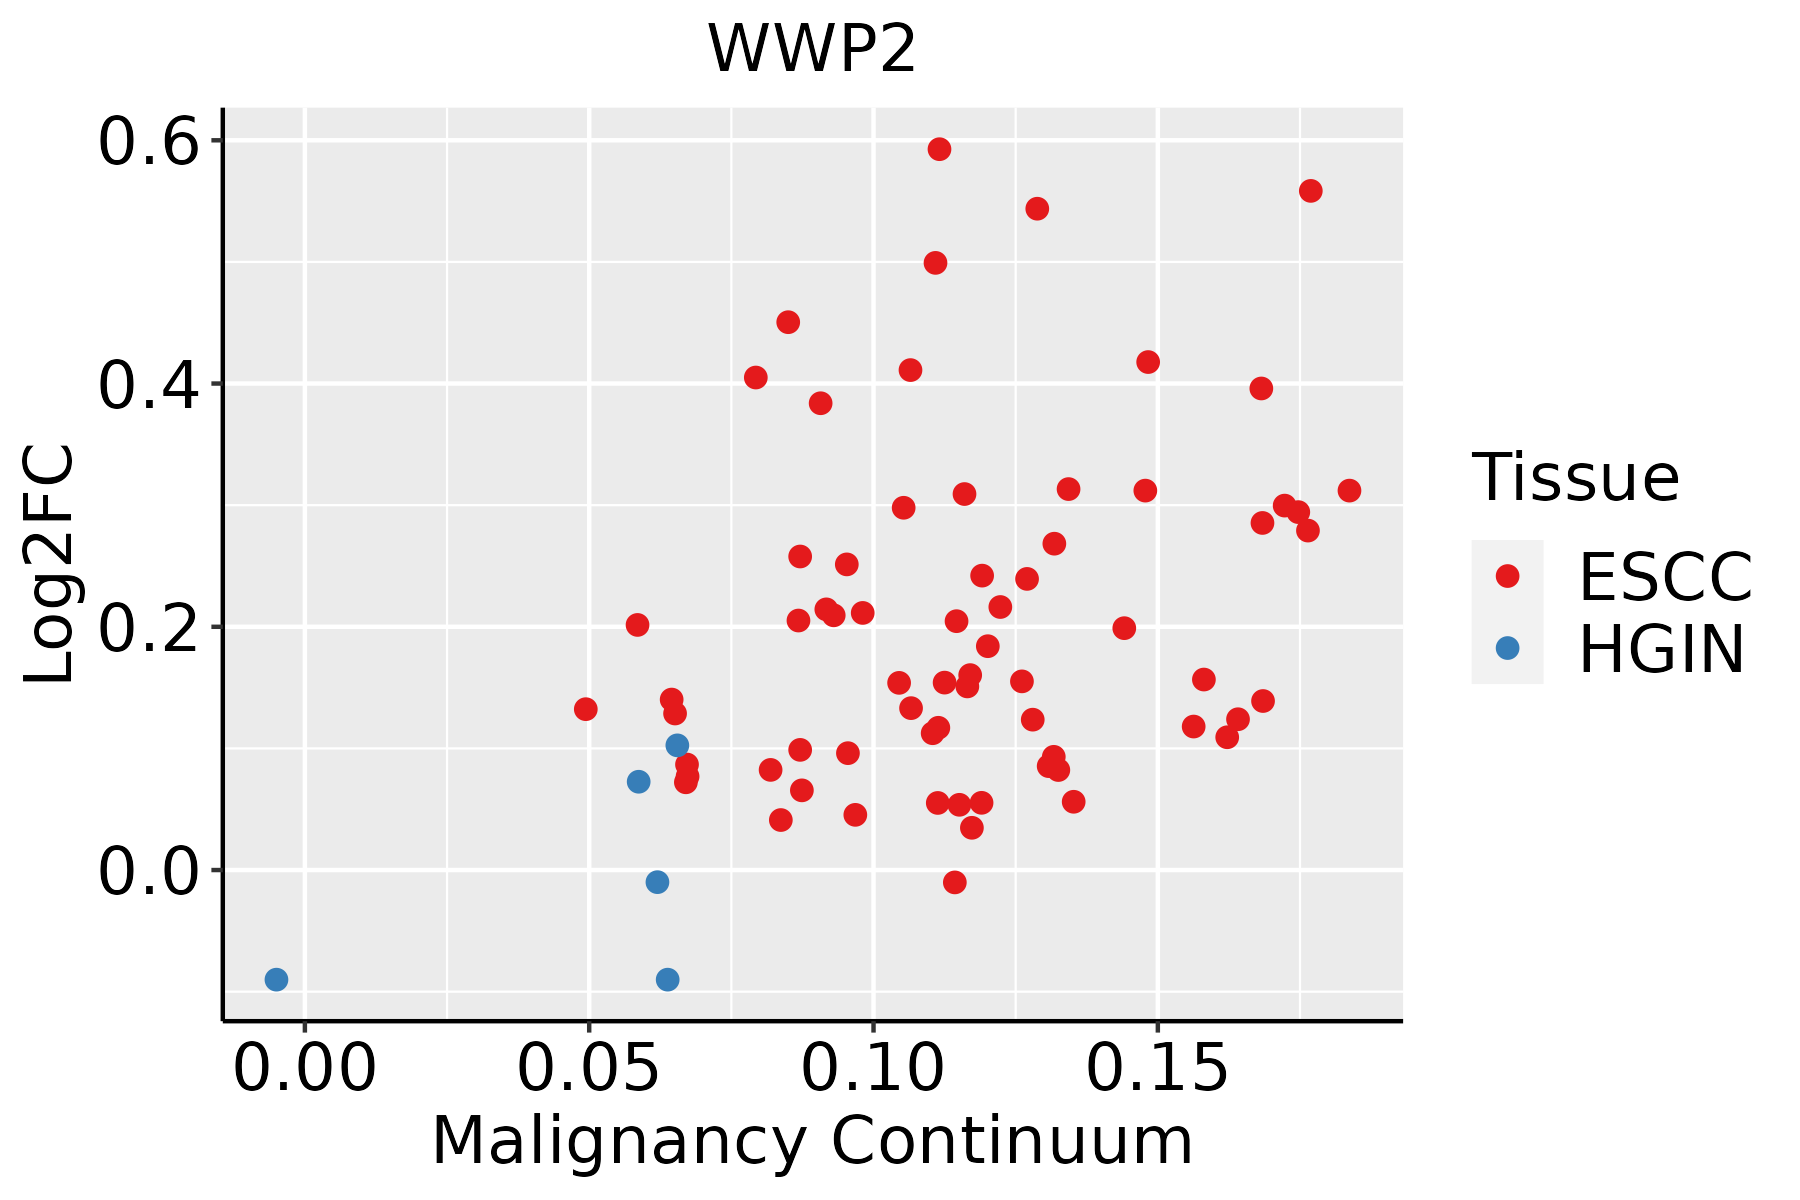 | ESCC: Esophageal squamous cell carcinoma |
| HGIN: High-grade intraepithelial neoplasias |
| LGIN: Low-grade intraepithelial neoplasias |
| Liver | 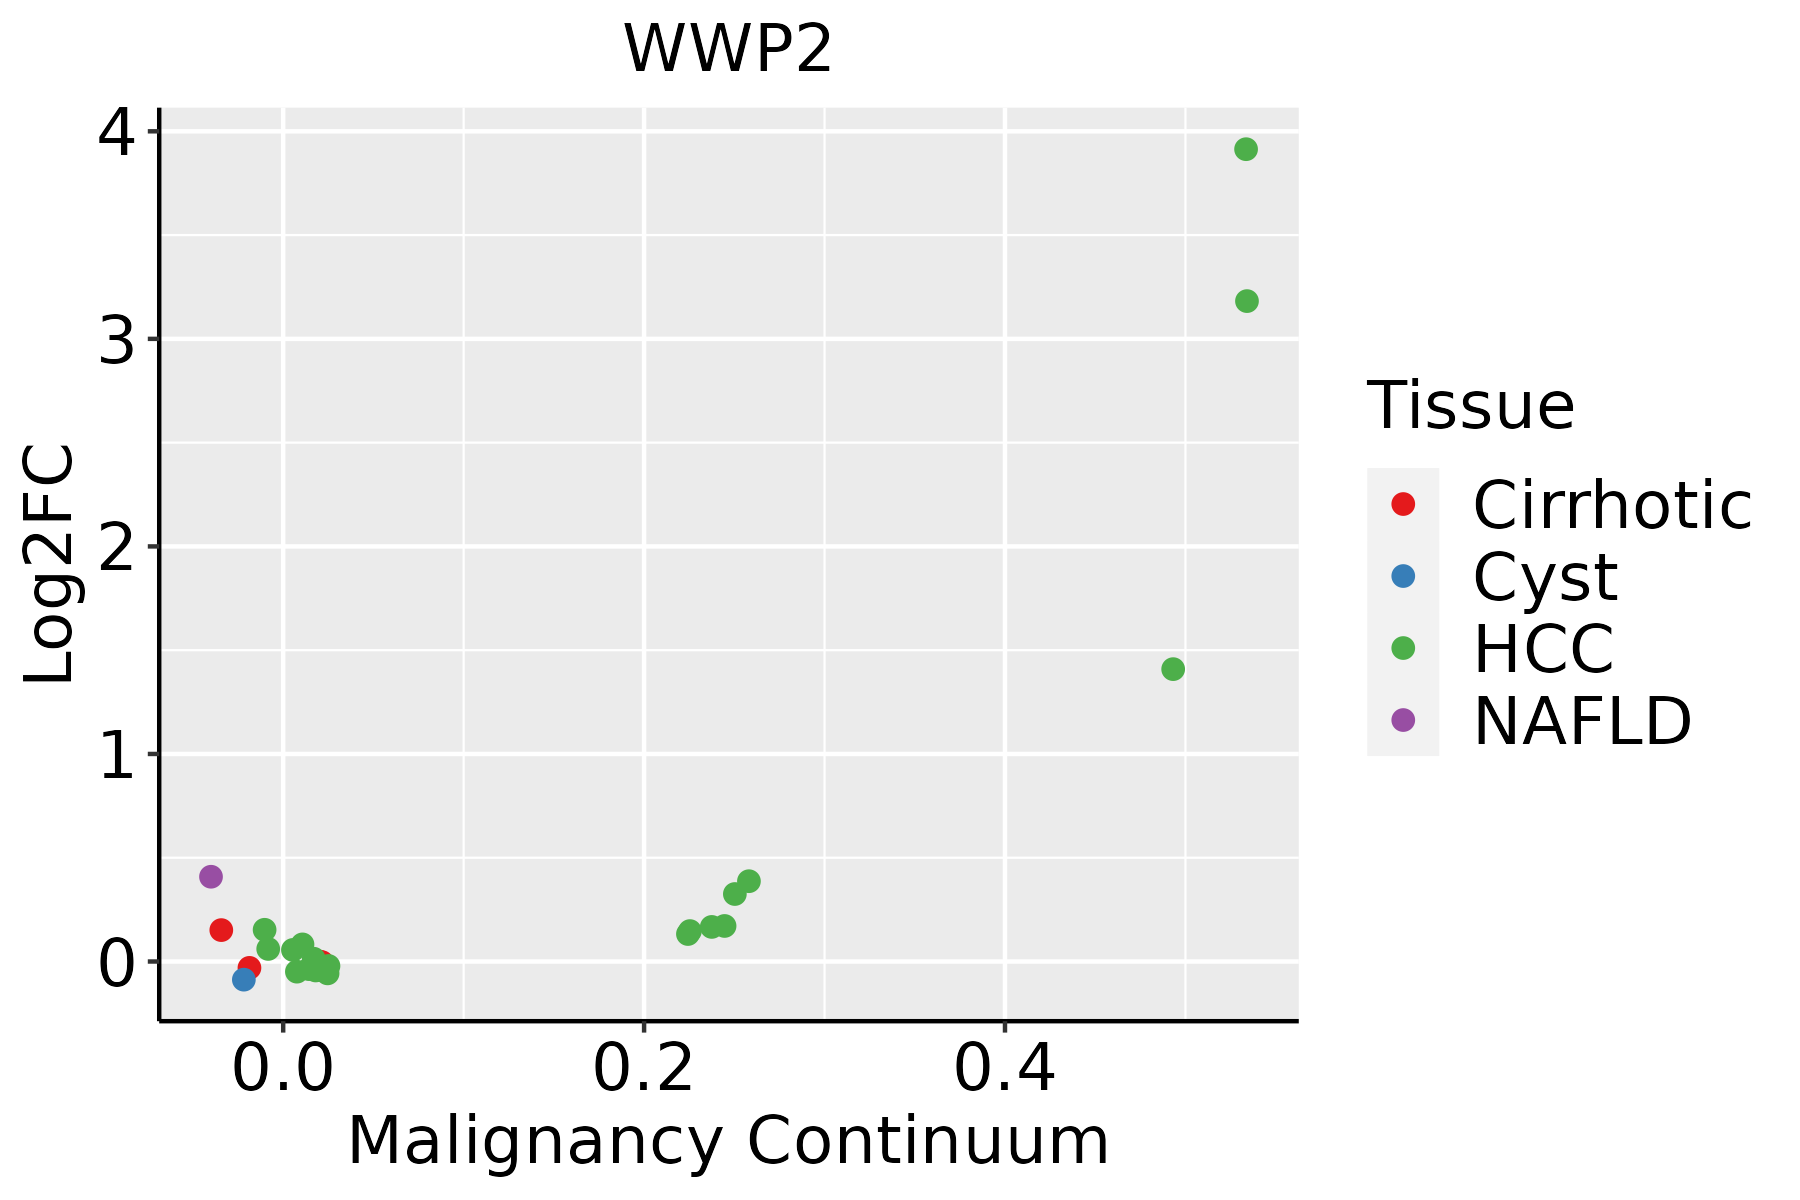 | HCC: Hepatocellular carcinoma |
| NAFLD: Non-alcoholic fatty liver disease |
| Lung | 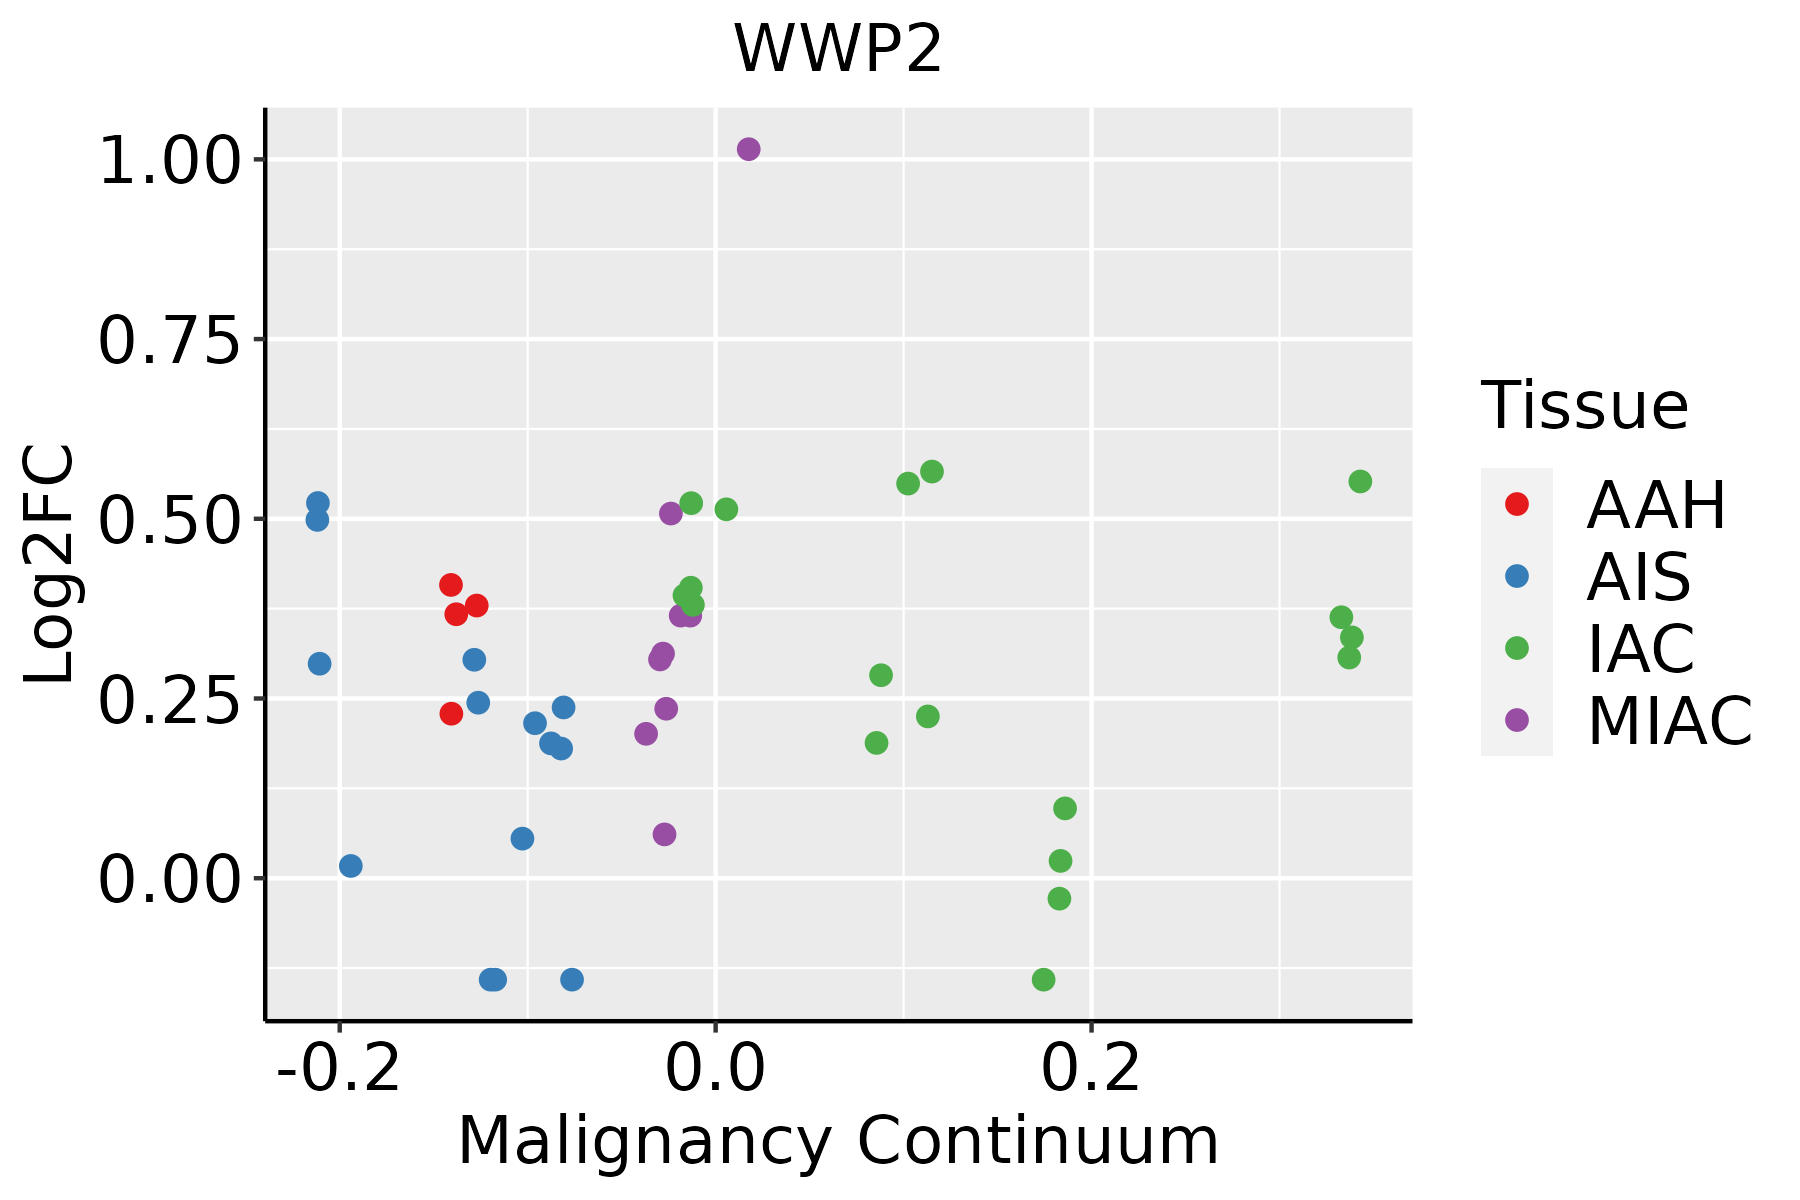 | AAH: Atypical adenomatous hyperplasia |
| AIS: Adenocarcinoma in situ |
| IAC: Invasive lung adenocarcinoma |
| MIA: Minimally invasive adenocarcinoma |
| GO ID | Tissue | Disease Stage | Description | Gene Ratio | Bg Ratio | pvalue | p.adjust | Count |
| GO:00518654 | Liver | HCC | protein autoubiquitination | 42/7958 | 73/18723 | 6.78e-03 | 2.73e-02 | 42 |
| GO:00098968 | Lung | IAC | positive regulation of catabolic process | 114/2061 | 492/18723 | 4.93e-15 | 1.25e-11 | 114 |
| GO:00421768 | Lung | IAC | regulation of protein catabolic process | 97/2061 | 391/18723 | 6.32e-15 | 1.25e-11 | 97 |
| GO:00160328 | Lung | IAC | viral process | 94/2061 | 415/18723 | 5.11e-12 | 4.27e-09 | 94 |
| GO:00190588 | Lung | IAC | viral life cycle | 77/2061 | 317/18723 | 1.23e-11 | 4.83e-09 | 77 |
| GO:00457328 | Lung | IAC | positive regulation of protein catabolic process | 61/2061 | 231/18723 | 4.44e-11 | 1.39e-08 | 61 |
| GO:00521268 | Lung | IAC | movement in host environment | 48/2061 | 175/18723 | 1.30e-09 | 2.21e-07 | 48 |
| GO:00517018 | Lung | IAC | biological process involved in interaction with host | 52/2061 | 203/18723 | 3.74e-09 | 5.84e-07 | 52 |
| GO:00467188 | Lung | IAC | viral entry into host cell | 41/2061 | 144/18723 | 6.27e-09 | 9.08e-07 | 41 |
| GO:00444098 | Lung | IAC | entry into host | 42/2061 | 151/18723 | 8.80e-09 | 1.19e-06 | 42 |
| GO:00444038 | Lung | IAC | biological process involved in symbiotic interaction | 63/2061 | 290/18723 | 8.57e-08 | 8.34e-06 | 63 |
| GO:00104988 | Lung | IAC | proteasomal protein catabolic process | 90/2061 | 490/18723 | 6.69e-07 | 3.89e-05 | 90 |
| GO:00431618 | Lung | IAC | proteasome-mediated ubiquitin-dependent protein catabolic process | 78/2061 | 412/18723 | 1.10e-06 | 6.02e-05 | 78 |
| GO:00002096 | Lung | IAC | protein polyubiquitination | 49/2061 | 236/18723 | 8.51e-06 | 2.89e-04 | 49 |
| GO:00510903 | Lung | IAC | regulation of DNA-binding transcription factor activity | 76/2061 | 440/18723 | 4.44e-05 | 1.05e-03 | 76 |
| GO:00518655 | Lung | IAC | protein autoubiquitination | 17/2061 | 73/18723 | 2.05e-03 | 2.05e-02 | 17 |
| GO:00324124 | Lung | IAC | regulation of ion transmembrane transporter activity | 45/2061 | 267/18723 | 2.43e-03 | 2.33e-02 | 45 |
| GO:19010162 | Lung | IAC | regulation of potassium ion transmembrane transporter activity | 16/2061 | 68/18723 | 2.45e-03 | 2.33e-02 | 16 |
| GO:00085932 | Lung | IAC | regulation of Notch signaling pathway | 20/2061 | 95/18723 | 3.15e-03 | 2.75e-02 | 20 |
| GO:00228984 | Lung | IAC | regulation of transmembrane transporter activity | 46/2061 | 278/18723 | 3.16e-03 | 2.75e-02 | 46 |
| Pathway ID | Tissue | Disease Stage | Description | Gene Ratio | Bg Ratio | pvalue | p.adjust | qvalue | Count |
| hsa0412014 | Cervix | CC | Ubiquitin mediated proteolysis | 49/1267 | 142/8465 | 4.26e-09 | 7.68e-08 | 4.54e-08 | 49 |
| hsa0412015 | Cervix | CC | Ubiquitin mediated proteolysis | 49/1267 | 142/8465 | 4.26e-09 | 7.68e-08 | 4.54e-08 | 49 |
| hsa04120 | Colorectum | AD | Ubiquitin mediated proteolysis | 58/2092 | 142/8465 | 1.46e-05 | 1.53e-04 | 9.76e-05 | 58 |
| hsa041201 | Colorectum | AD | Ubiquitin mediated proteolysis | 58/2092 | 142/8465 | 1.46e-05 | 1.53e-04 | 9.76e-05 | 58 |
| hsa041204 | Colorectum | MSS | Ubiquitin mediated proteolysis | 55/1875 | 142/8465 | 5.02e-06 | 6.00e-05 | 3.68e-05 | 55 |
| hsa041205 | Colorectum | MSS | Ubiquitin mediated proteolysis | 55/1875 | 142/8465 | 5.02e-06 | 6.00e-05 | 3.68e-05 | 55 |
| hsa041206 | Colorectum | FAP | Ubiquitin mediated proteolysis | 51/1404 | 142/8465 | 1.55e-08 | 5.84e-07 | 3.55e-07 | 51 |
| hsa041207 | Colorectum | FAP | Ubiquitin mediated proteolysis | 51/1404 | 142/8465 | 1.55e-08 | 5.84e-07 | 3.55e-07 | 51 |
| hsa041208 | Colorectum | CRC | Ubiquitin mediated proteolysis | 42/1091 | 142/8465 | 9.98e-08 | 6.67e-06 | 4.52e-06 | 42 |
| hsa041209 | Colorectum | CRC | Ubiquitin mediated proteolysis | 42/1091 | 142/8465 | 9.98e-08 | 6.67e-06 | 4.52e-06 | 42 |
| hsa0412027 | Esophagus | ESCC | Ubiquitin mediated proteolysis | 122/4205 | 142/8465 | 6.53e-20 | 7.29e-18 | 3.74e-18 | 122 |
| hsa0412036 | Esophagus | ESCC | Ubiquitin mediated proteolysis | 122/4205 | 142/8465 | 6.53e-20 | 7.29e-18 | 3.74e-18 | 122 |
| hsa0412041 | Liver | HCC | Ubiquitin mediated proteolysis | 110/4020 | 142/8465 | 1.67e-13 | 3.74e-12 | 2.08e-12 | 110 |
| hsa0412051 | Liver | HCC | Ubiquitin mediated proteolysis | 110/4020 | 142/8465 | 1.67e-13 | 3.74e-12 | 2.08e-12 | 110 |
| hsa0412012 | Lung | IAC | Ubiquitin mediated proteolysis | 40/1053 | 142/8465 | 3.24e-07 | 1.76e-05 | 1.17e-05 | 40 |
| hsa0412013 | Lung | IAC | Ubiquitin mediated proteolysis | 40/1053 | 142/8465 | 3.24e-07 | 1.76e-05 | 1.17e-05 | 40 |
| hsa0412022 | Lung | AIS | Ubiquitin mediated proteolysis | 41/961 | 142/8465 | 8.01e-09 | 4.33e-07 | 2.77e-07 | 41 |
| hsa0412032 | Lung | AIS | Ubiquitin mediated proteolysis | 41/961 | 142/8465 | 8.01e-09 | 4.33e-07 | 2.77e-07 | 41 |
| Hugo Symbol | Variant Class | Variant Classification | dbSNP RS | HGVSc | HGVSp | HGVSp Short | SWISSPROT | BIOTYPE | SIFT | PolyPhen | Tumor Sample Barcode | Tissue | Histology | Sex | Age | Stage | Therapy Types | Drugs | Outcome |
| WWP2 | SNV | Missense_Mutation | | c.2258N>T | p.Gln753Leu | p.Q753L | O00308 | protein_coding | deleterious(0) | probably_damaging(0.998) | TCGA-A2-A0CW-01 | Breast | breast invasive carcinoma | Female | >=65 | I/II | Hormone Therapy | anastrozole | SD |
| WWP2 | SNV | Missense_Mutation | | c.2071N>A | p.Gly691Ser | p.G691S | O00308 | protein_coding | deleterious(0) | probably_damaging(1) | TCGA-A8-A06O-01 | Breast | breast invasive carcinoma | Female | <65 | I/II | Hormone Therapy | letrozole | SD |
| WWP2 | SNV | Missense_Mutation | rs139052693 | c.748N>A | p.Val250Ile | p.V250I | O00308 | protein_coding | tolerated(0.31) | benign(0.007) | TCGA-A8-A097-01 | Breast | breast invasive carcinoma | Female | >=65 | I/II | Hormone Therapy | tamoxiphen | SD |
| WWP2 | SNV | Missense_Mutation | rs751603209 | c.1225N>G | p.Pro409Ala | p.P409A | O00308 | protein_coding | tolerated(0.29) | benign(0.007) | TCGA-AC-A23H-01 | Breast | breast invasive carcinoma | Female | >=65 | I/II | Unknown | Unknown | PD |
| WWP2 | SNV | Missense_Mutation | | c.2226N>C | p.Glu742Asp | p.E742D | O00308 | protein_coding | deleterious(0.01) | probably_damaging(0.998) | TCGA-AC-A23H-01 | Breast | breast invasive carcinoma | Female | >=65 | I/II | Unknown | Unknown | PD |
| WWP2 | SNV | Missense_Mutation | rs766917559 | c.2431N>A | p.Glu811Lys | p.E811K | O00308 | protein_coding | deleterious(0) | probably_damaging(0.999) | TCGA-AO-A128-01 | Breast | breast invasive carcinoma | Female | <65 | I/II | Chemotherapy | doxorubicin | SD |
| WWP2 | SNV | Missense_Mutation | | c.176N>A | p.Arg59His | p.R59H | O00308 | protein_coding | tolerated(0.58) | benign(0.226) | TCGA-AR-A1AN-01 | Breast | breast invasive carcinoma | Female | <65 | I/II | Chemotherapy | cytoxan | SD |
| WWP2 | SNV | Missense_Mutation | rs138661773 | c.1448N>T | p.Thr483Met | p.T483M | O00308 | protein_coding | tolerated(0.14) | benign(0.115) | TCGA-BH-A0DQ-01 | Breast | breast invasive carcinoma | Female | <65 | I/II | Chemotherapy | doxorubicin | SD |
| WWP2 | SNV | Missense_Mutation | | c.1670N>C | p.Gly557Ala | p.G557A | O00308 | protein_coding | deleterious(0.02) | possibly_damaging(0.73) | TCGA-BH-A5IZ-01 | Breast | breast invasive carcinoma | Female | <65 | I/II | Chemotherapy | adriamycin | CR |
| WWP2 | SNV | Missense_Mutation | | c.412N>T | p.Thr138Ser | p.T138S | O00308 | protein_coding | tolerated(0.63) | benign(0.026) | TCGA-D8-A1J8-01 | Breast | breast invasive carcinoma | Female | >=65 | I/II | Hormone Therapy | nolvadex | SD |


