| Tissue | Expression Dynamics | Abbreviation |
| Breast |  | IDC: Invasive ductal carcinoma |
| DCIS: Ductal carcinoma in situ |
| Precancer(BRCA1-mut): Precancerous lesion from BRCA1 mutation carriers |
| Cervix |  | CC: Cervix cancer |
| HSIL_HPV: HPV-infected high-grade squamous intraepithelial lesions |
| N_HPV: HPV-infected normal cervix |
| Colorectum (GSE201348) |  | FAP: Familial adenomatous polyposis |
| CRC: Colorectal cancer |
| Colorectum (HTA11) |  | AD: Adenomas |
| SER: Sessile serrated lesions |
| MSI-H: Microsatellite-high colorectal cancer |
| MSS: Microsatellite stable colorectal cancer |
| Endometrium | 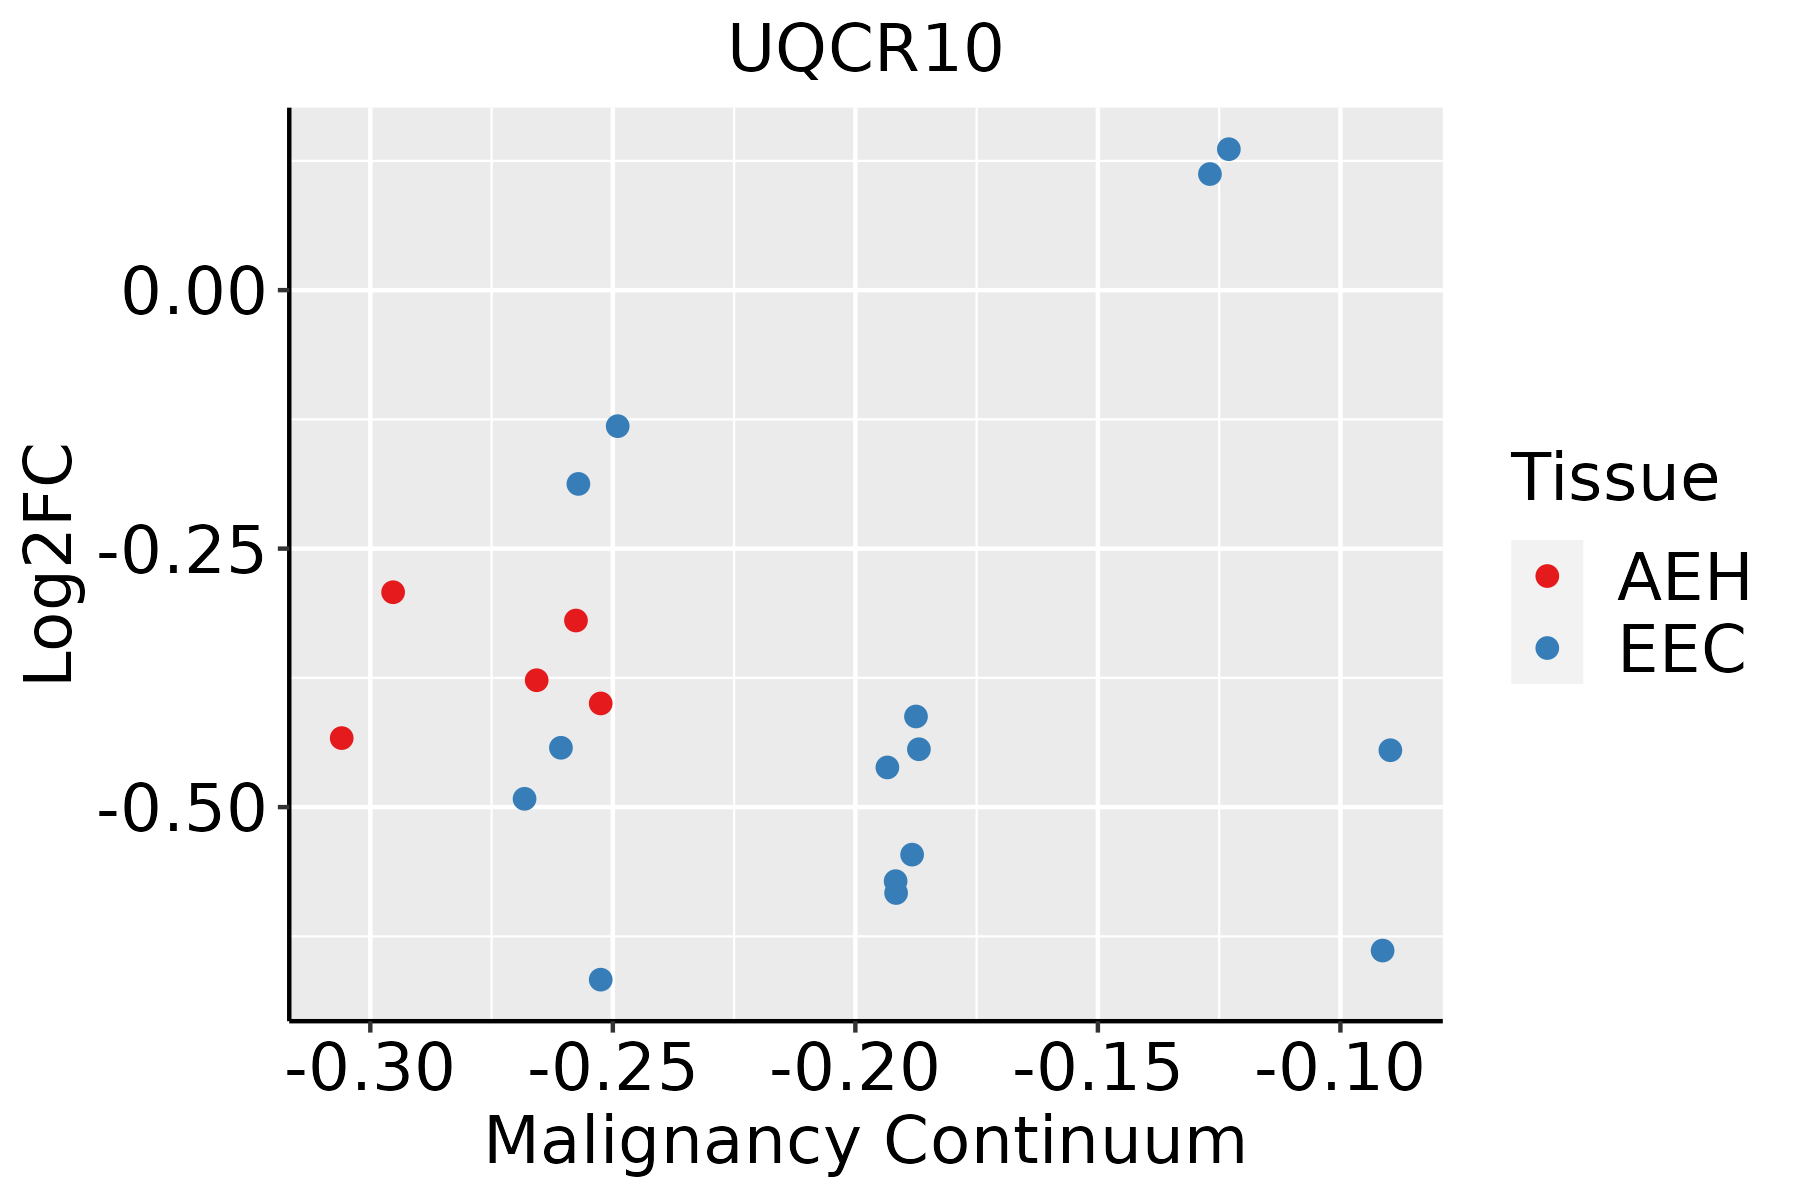 | AEH: Atypical endometrial hyperplasia |
| EEC: Endometrioid Cancer |
| Esophagus | 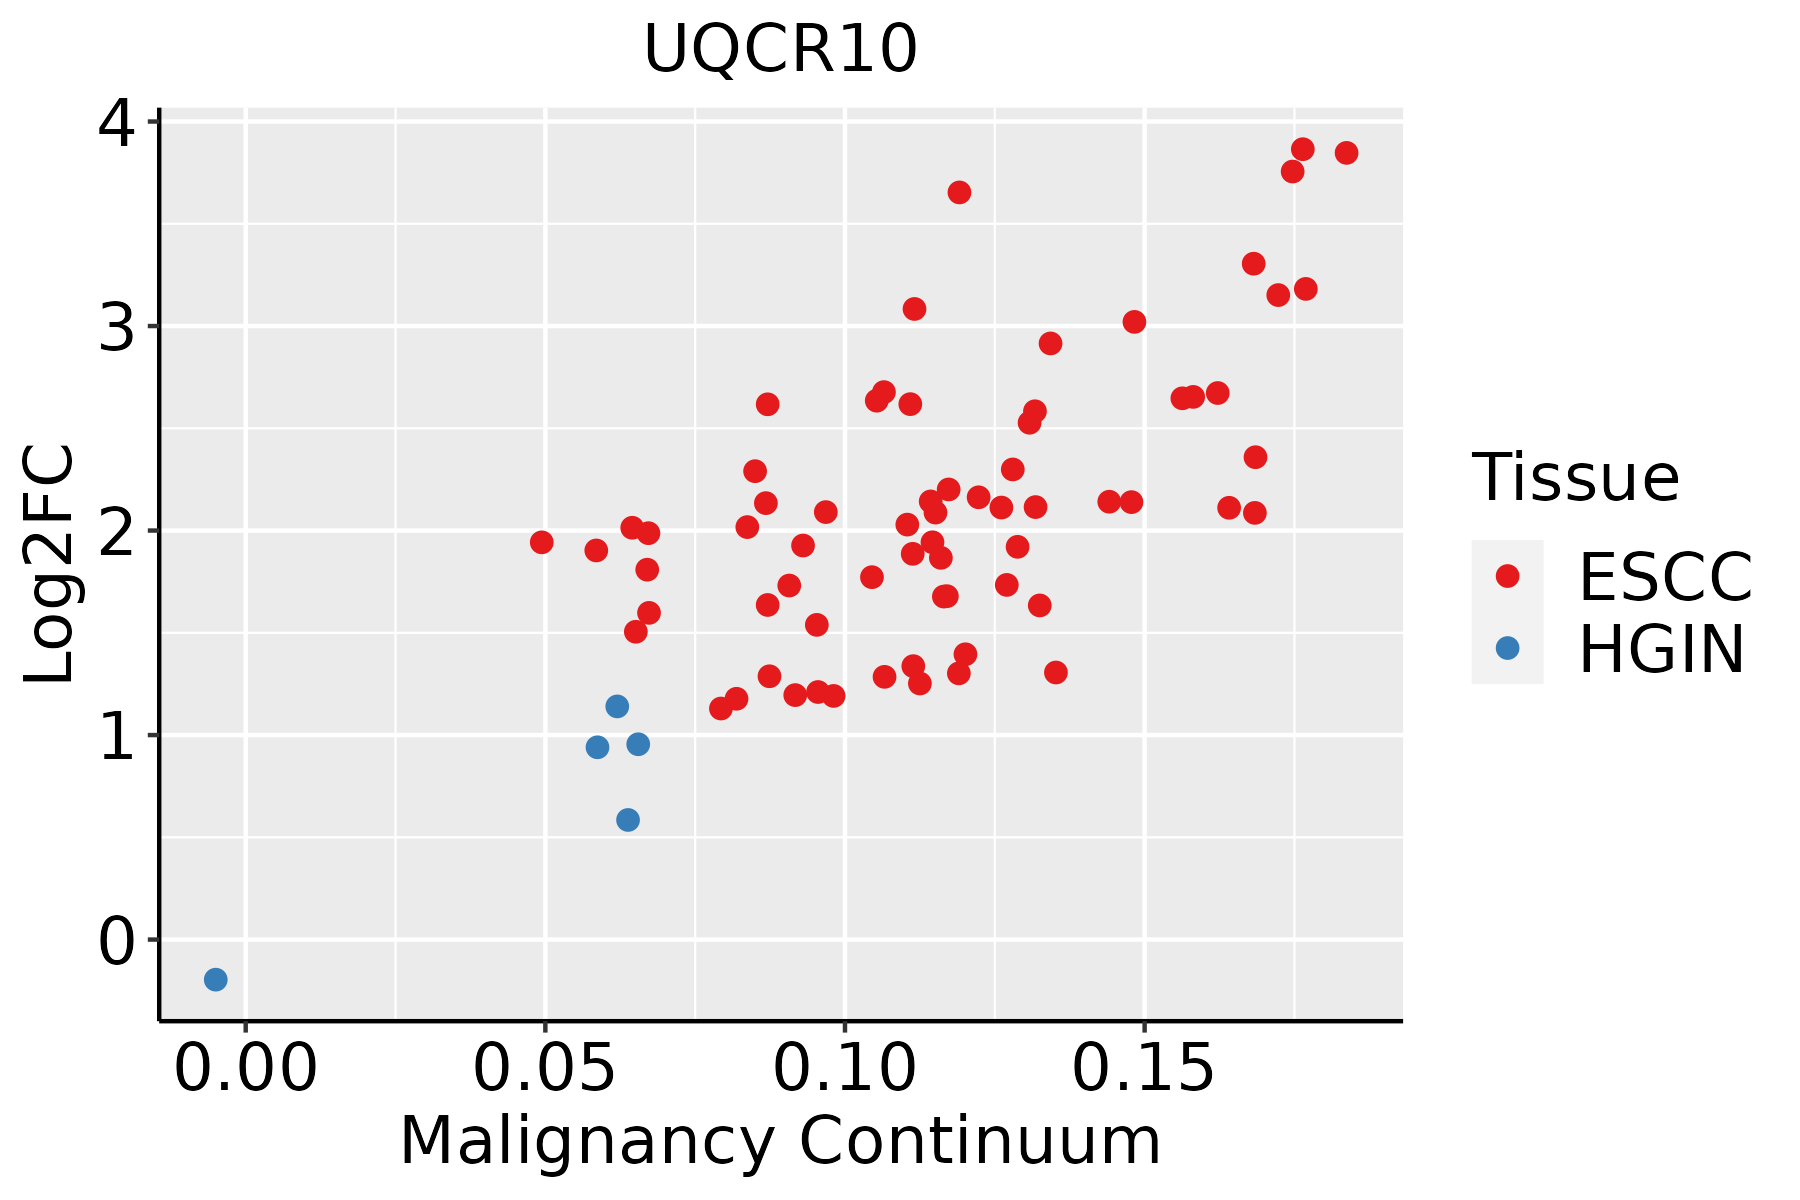 | ESCC: Esophageal squamous cell carcinoma |
| HGIN: High-grade intraepithelial neoplasias |
| LGIN: Low-grade intraepithelial neoplasias |
| Liver | 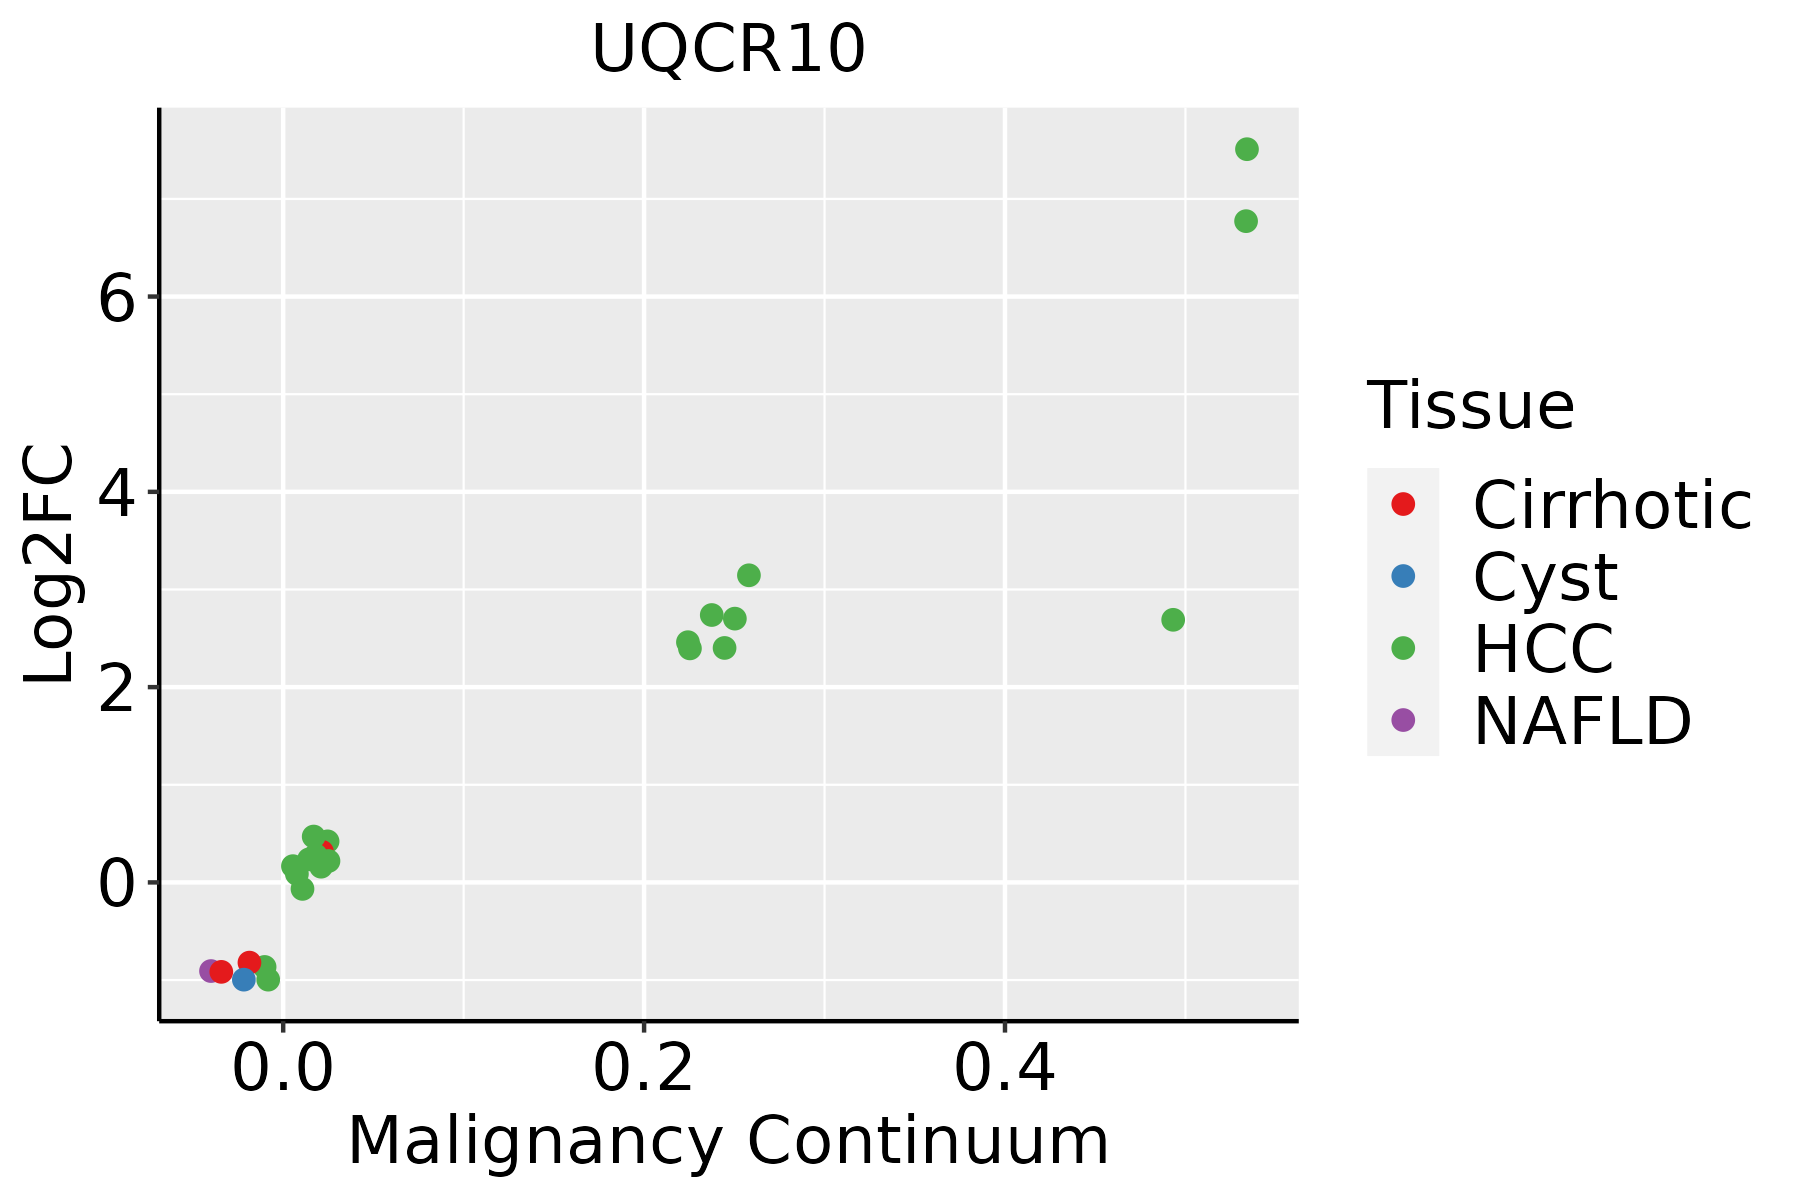 | HCC: Hepatocellular carcinoma |
| NAFLD: Non-alcoholic fatty liver disease |
| Lung | 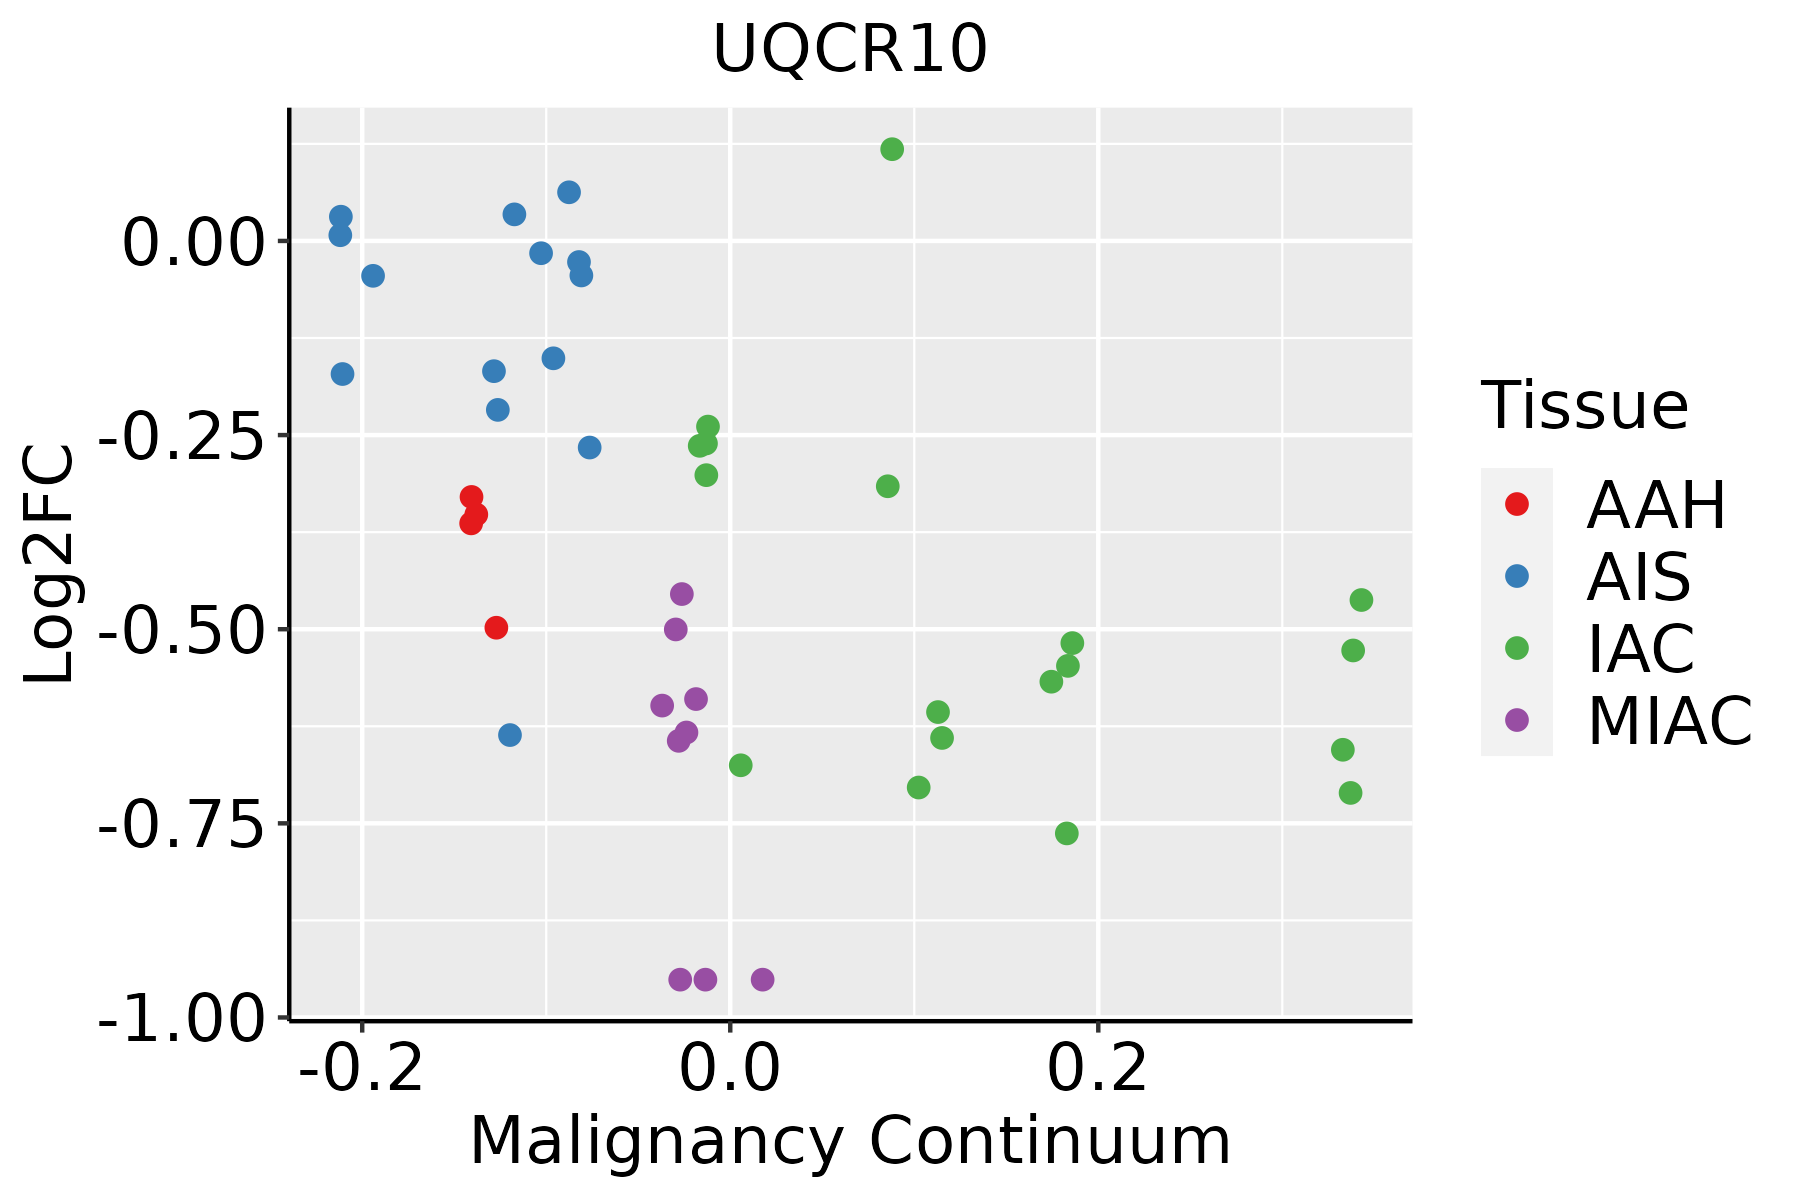 | AAH: Atypical adenomatous hyperplasia |
| AIS: Adenocarcinoma in situ |
| IAC: Invasive lung adenocarcinoma |
| MIA: Minimally invasive adenocarcinoma |
| Oral Cavity |  | EOLP: Erosive Oral lichen planus |
| LP: leukoplakia |
| NEOLP: Non-erosive oral lichen planus |
| OSCC: Oral squamous cell carcinoma |
| Prostate | 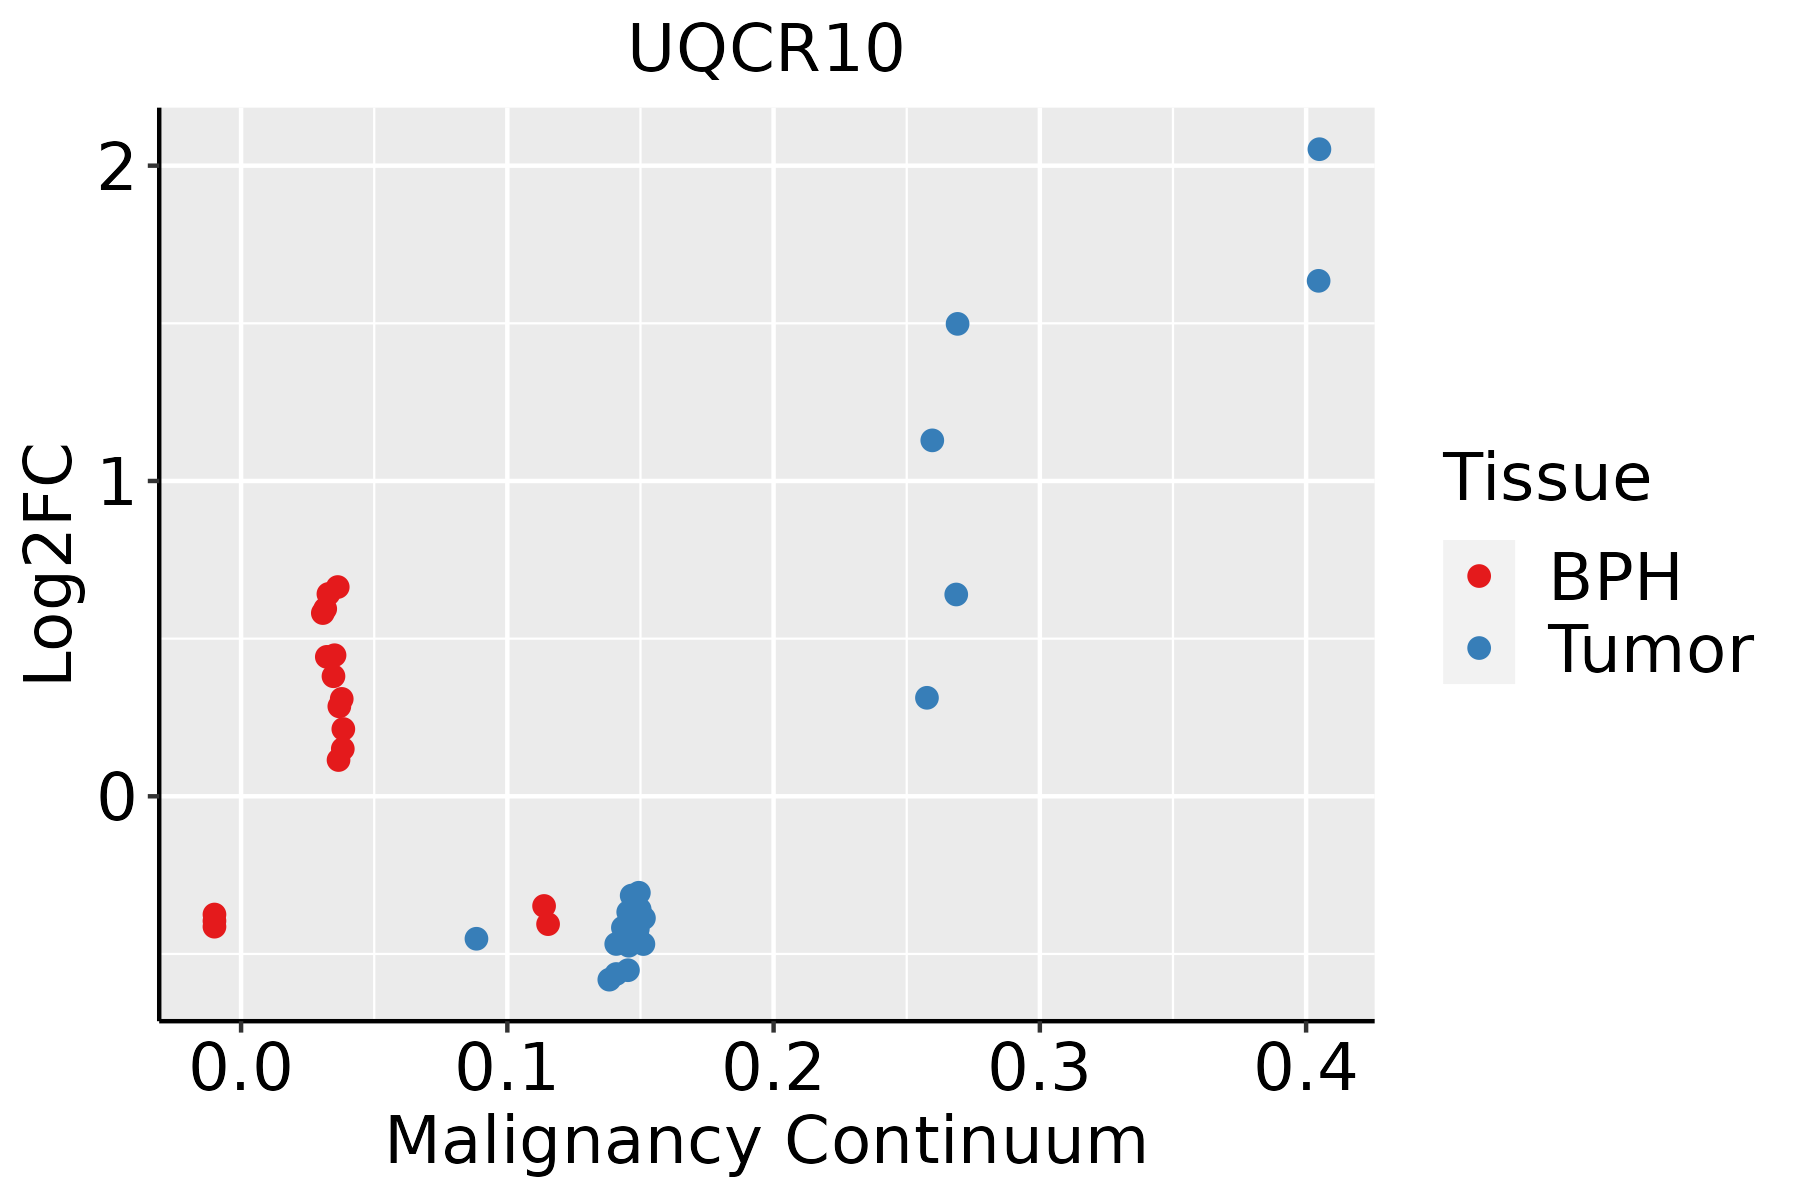 | BPH: Benign Prostatic Hyperplasia |
| Skin | 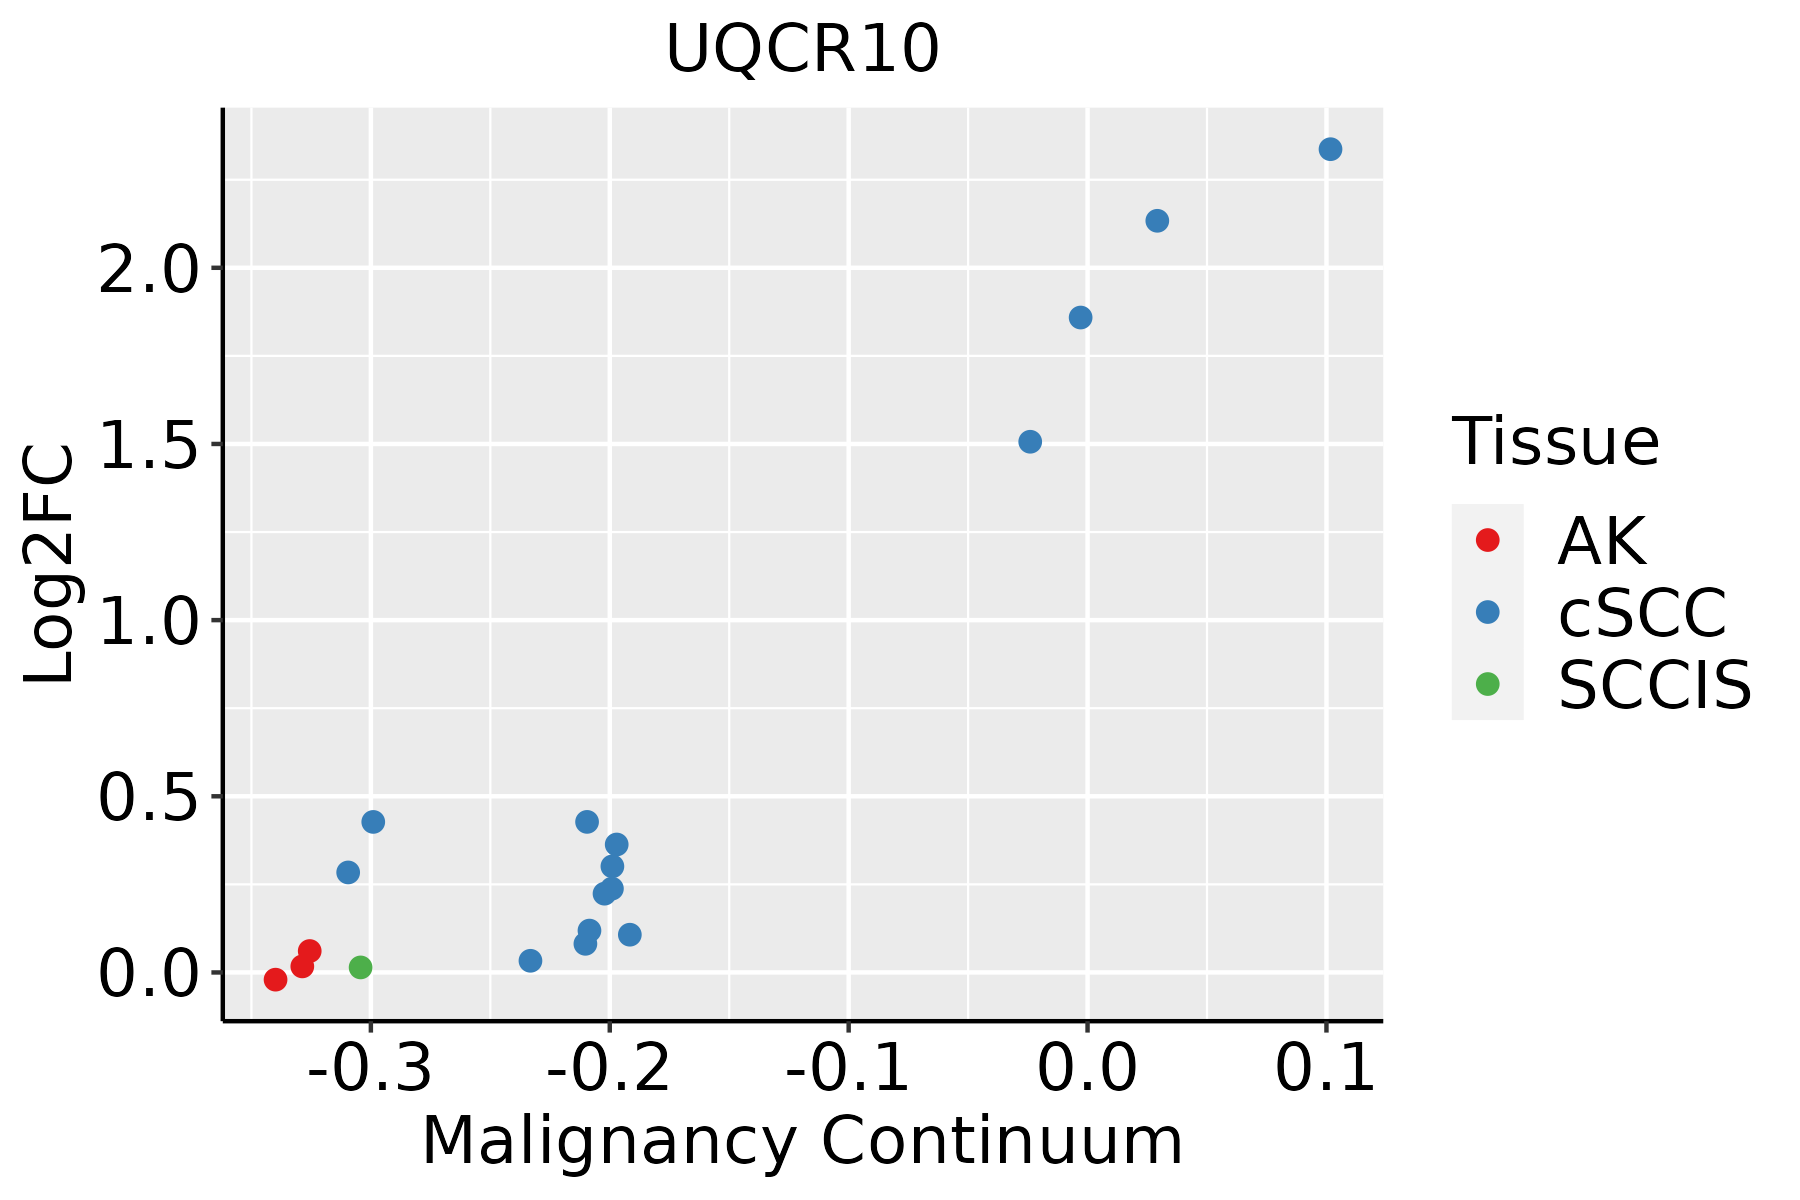 | AK: Actinic keratosis |
| cSCC: Cutaneous squamous cell carcinoma |
| SCCIS:squamous cell carcinoma in situ |
| Thyroid | 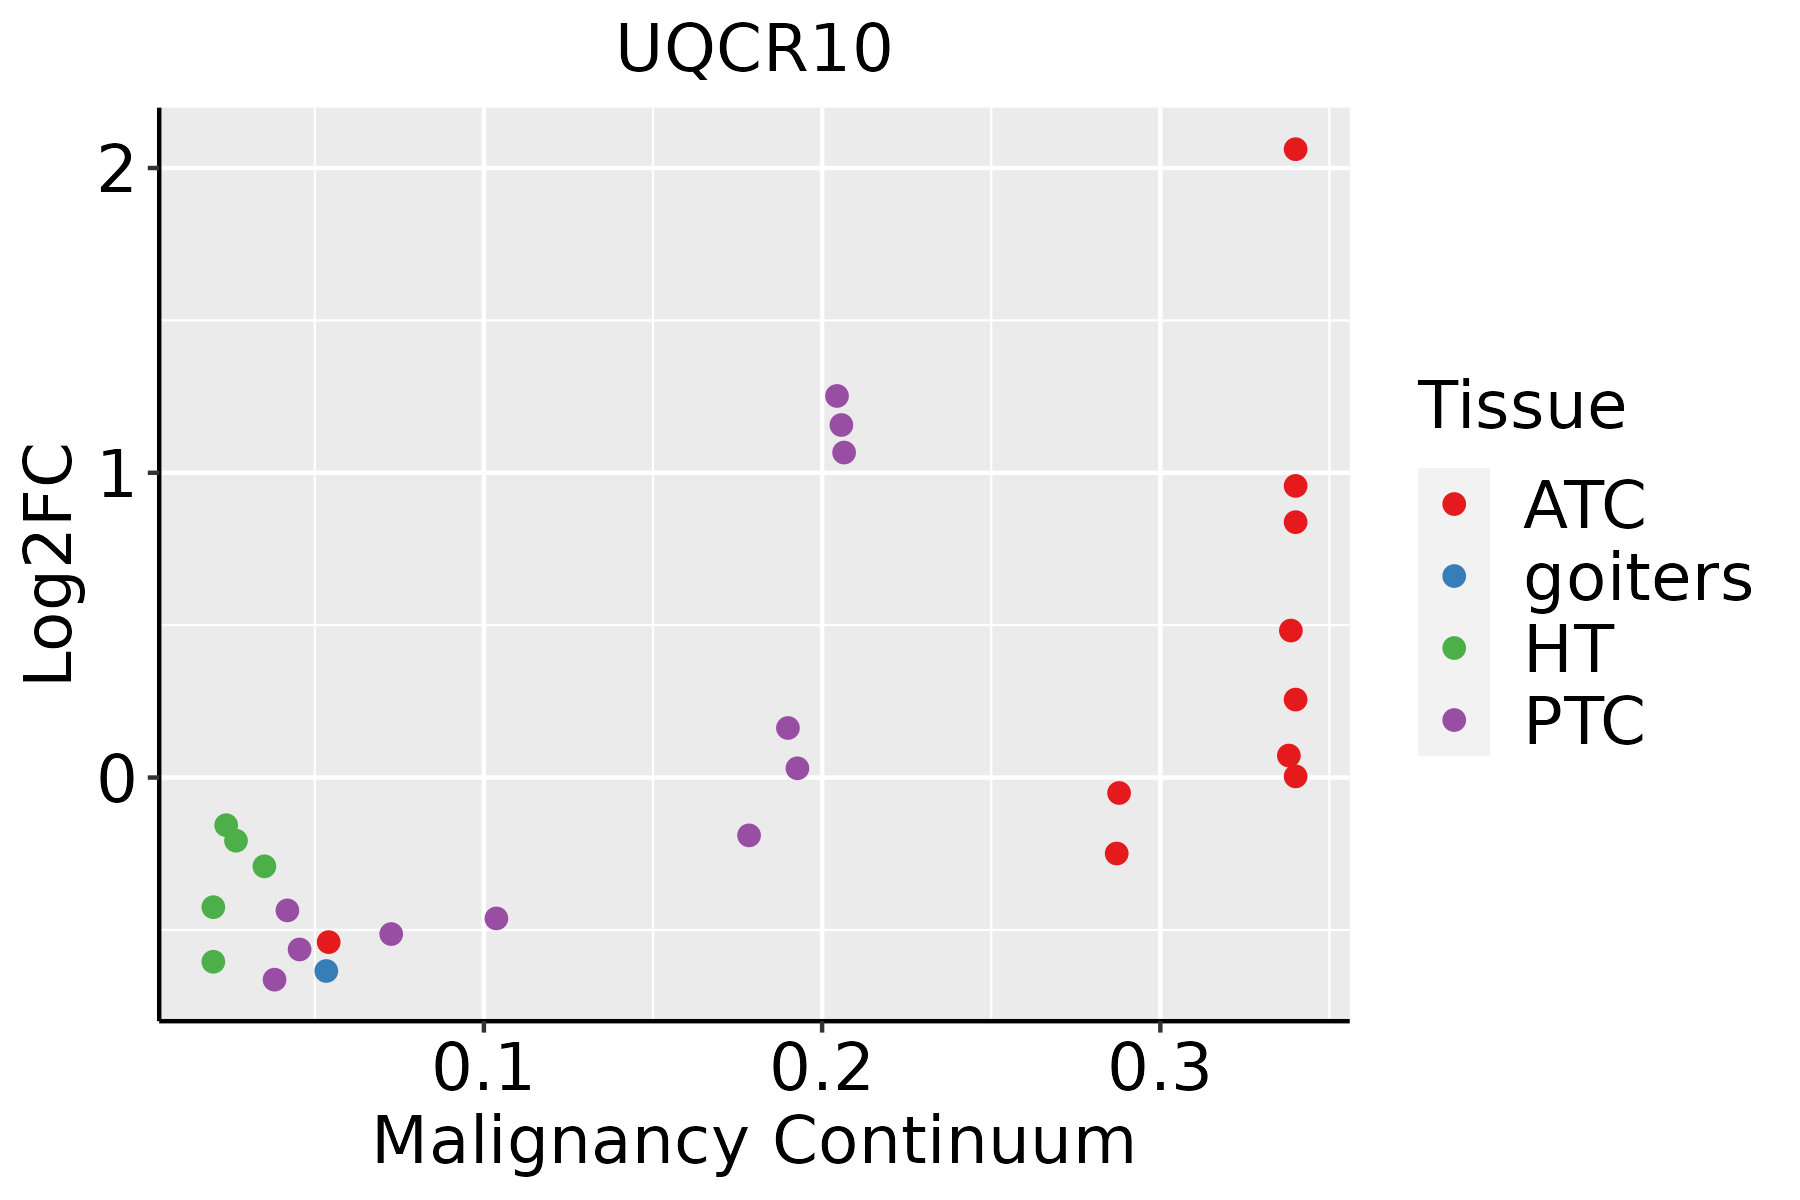 | ATC: Anaplastic thyroid cancer |
| HT: Hashimoto's thyroiditis |
| PTC: Papillary thyroid cancer |
| GO ID | Tissue | Disease Stage | Description | Gene Ratio | Bg Ratio | pvalue | p.adjust | Count |
| GO:002290020 | Esophagus | HGIN | electron transport chain | 66/2587 | 175/18723 | 2.21e-15 | 4.73e-13 | 66 |
| GO:190260017 | Esophagus | HGIN | proton transmembrane transport | 43/2587 | 157/18723 | 5.51e-06 | 1.75e-04 | 43 |
| GO:000612219 | Esophagus | HGIN | mitochondrial electron transport, ubiquinol to cytochrome c | 7/2587 | 11/18723 | 1.89e-04 | 3.52e-03 | 7 |
| GO:0006091110 | Esophagus | ESCC | generation of precursor metabolites and energy | 331/8552 | 490/18723 | 3.86e-23 | 8.45e-21 | 331 |
| GO:0045333110 | Esophagus | ESCC | cellular respiration | 173/8552 | 230/18723 | 4.53e-20 | 5.99e-18 | 173 |
| GO:0009060110 | Esophagus | ESCC | aerobic respiration | 145/8552 | 189/18723 | 2.16e-18 | 2.21e-16 | 145 |
| GO:0015980110 | Esophagus | ESCC | energy derivation by oxidation of organic compounds | 220/8552 | 318/18723 | 1.20e-17 | 1.09e-15 | 220 |
| GO:0022900110 | Esophagus | ESCC | electron transport chain | 133/8552 | 175/18723 | 2.18e-16 | 1.67e-14 | 133 |
| GO:0046034111 | Esophagus | ESCC | ATP metabolic process | 189/8552 | 277/18723 | 1.99e-14 | 1.04e-12 | 189 |
| GO:0006119111 | Esophagus | ESCC | oxidative phosphorylation | 106/8552 | 141/18723 | 8.19e-13 | 3.63e-11 | 106 |
| GO:0022904110 | Esophagus | ESCC | respiratory electron transport chain | 89/8552 | 114/18723 | 1.36e-12 | 5.80e-11 | 89 |
| GO:0042773110 | Esophagus | ESCC | ATP synthesis coupled electron transport | 74/8552 | 95/18723 | 1.28e-10 | 3.77e-09 | 74 |
| GO:0042775110 | Esophagus | ESCC | mitochondrial ATP synthesis coupled electron transport | 74/8552 | 95/18723 | 1.28e-10 | 3.77e-09 | 74 |
| GO:0019646110 | Esophagus | ESCC | aerobic electron transport chain | 67/8552 | 87/18723 | 2.30e-09 | 5.14e-08 | 67 |
| GO:0006122110 | Esophagus | ESCC | mitochondrial electron transport, ubiquinol to cytochrome c | 10/8552 | 11/18723 | 2.54e-03 | 1.08e-02 | 10 |
| GO:190260018 | Esophagus | ESCC | proton transmembrane transport | 88/8552 | 157/18723 | 5.62e-03 | 2.10e-02 | 88 |
| GO:000609112 | Liver | Cirrhotic | generation of precursor metabolites and energy | 238/4634 | 490/18723 | 6.85e-31 | 1.07e-27 | 238 |
| GO:002290012 | Liver | Cirrhotic | electron transport chain | 111/4634 | 175/18723 | 1.94e-27 | 1.52e-24 | 111 |
| GO:004603412 | Liver | Cirrhotic | ATP metabolic process | 144/4634 | 277/18723 | 1.04e-22 | 5.02e-20 | 144 |
| GO:00427737 | Liver | Cirrhotic | ATP synthesis coupled electron transport | 69/4634 | 95/18723 | 1.12e-22 | 5.02e-20 | 69 |
| Pathway ID | Tissue | Disease Stage | Description | Gene Ratio | Bg Ratio | pvalue | p.adjust | qvalue | Count |
| hsa0501218 | Breast | Precancer | Parkinson disease | 99/684 | 266/8465 | 3.58e-42 | 5.65e-40 | 4.33e-40 | 99 |
| hsa0502016 | Breast | Precancer | Prion disease | 95/684 | 273/8465 | 1.39e-37 | 1.46e-35 | 1.12e-35 | 95 |
| hsa0501616 | Breast | Precancer | Huntington disease | 98/684 | 306/8465 | 2.85e-35 | 2.25e-33 | 1.72e-33 | 98 |
| hsa0019016 | Breast | Precancer | Oxidative phosphorylation | 59/684 | 134/8465 | 6.15e-30 | 3.24e-28 | 2.48e-28 | 59 |
| hsa0501016 | Breast | Precancer | Alzheimer disease | 103/684 | 384/8465 | 1.03e-29 | 4.66e-28 | 3.57e-28 | 103 |
| hsa0501416 | Breast | Precancer | Amyotrophic lateral sclerosis | 98/684 | 364/8465 | 2.13e-28 | 8.41e-27 | 6.44e-27 | 98 |
| hsa0502216 | Breast | Precancer | Pathways of neurodegeneration - multiple diseases | 112/684 | 476/8465 | 6.96e-27 | 2.44e-25 | 1.87e-25 | 112 |
| hsa0520818 | Breast | Precancer | Chemical carcinogenesis - reactive oxygen species | 68/684 | 223/8465 | 3.61e-23 | 1.14e-21 | 8.73e-22 | 68 |
| hsa0471418 | Breast | Precancer | Thermogenesis | 68/684 | 232/8465 | 4.40e-22 | 1.26e-20 | 9.69e-21 | 68 |
| hsa0541518 | Breast | Precancer | Diabetic cardiomyopathy | 63/684 | 203/8465 | 5.63e-22 | 1.48e-20 | 1.14e-20 | 63 |
| hsa0493216 | Breast | Precancer | Non-alcoholic fatty liver disease | 48/684 | 155/8465 | 6.16e-17 | 1.50e-15 | 1.15e-15 | 48 |
| hsa0426016 | Breast | Precancer | Cardiac muscle contraction | 22/684 | 87/8465 | 9.72e-07 | 1.62e-05 | 1.24e-05 | 22 |
| hsa0501219 | Breast | Precancer | Parkinson disease | 99/684 | 266/8465 | 3.58e-42 | 5.65e-40 | 4.33e-40 | 99 |
| hsa0502017 | Breast | Precancer | Prion disease | 95/684 | 273/8465 | 1.39e-37 | 1.46e-35 | 1.12e-35 | 95 |
| hsa0501617 | Breast | Precancer | Huntington disease | 98/684 | 306/8465 | 2.85e-35 | 2.25e-33 | 1.72e-33 | 98 |
| hsa0019017 | Breast | Precancer | Oxidative phosphorylation | 59/684 | 134/8465 | 6.15e-30 | 3.24e-28 | 2.48e-28 | 59 |
| hsa0501017 | Breast | Precancer | Alzheimer disease | 103/684 | 384/8465 | 1.03e-29 | 4.66e-28 | 3.57e-28 | 103 |
| hsa0501417 | Breast | Precancer | Amyotrophic lateral sclerosis | 98/684 | 364/8465 | 2.13e-28 | 8.41e-27 | 6.44e-27 | 98 |
| hsa0502217 | Breast | Precancer | Pathways of neurodegeneration - multiple diseases | 112/684 | 476/8465 | 6.96e-27 | 2.44e-25 | 1.87e-25 | 112 |
| hsa0520819 | Breast | Precancer | Chemical carcinogenesis - reactive oxygen species | 68/684 | 223/8465 | 3.61e-23 | 1.14e-21 | 8.73e-22 | 68 |
| Hugo Symbol | Variant Class | Variant Classification | dbSNP RS | HGVSc | HGVSp | HGVSp Short | SWISSPROT | BIOTYPE | SIFT | PolyPhen | Tumor Sample Barcode | Tissue | Histology | Sex | Age | Stage | Therapy Types | Drugs | Outcome |
| UQCR10 | SNV | Missense_Mutation | rs374152934 | c.109N>A | p.Asp37Asn | p.D37N | Q9UDW1 | protein_coding | tolerated(0.06) | probably_damaging(0.977) | TCGA-BH-A0B6-01 | Breast | breast invasive carcinoma | Female | <65 | I/II | Unknown | Unknown | SD |
| UQCR10 | insertion | In_Frame_Ins | novel | c.108_109insAGAGGAACTACAAATCCCATAAAGTGTTGCACGTCTAGGGCCTTTGGA | p.Phe36_Asp37insArgGlyThrThrAsnProIleLysCysCysThrSerArgAlaPheGly | p.F36_D37insRGTTNPIKCCTSRAFG | Q9UDW1 | protein_coding | | | TCGA-AO-A0JD-01 | Breast | breast invasive carcinoma | Female | <65 | III/IV | Chemotherapy | cyclophosphamide | SD |
| UQCR10 | SNV | Missense_Mutation | | c.97N>A | p.Glu33Lys | p.E33K | Q9UDW1 | protein_coding | deleterious(0.03) | probably_damaging(0.951) | TCGA-D5-5541-01 | Colorectum | colon adenocarcinoma | Male | <65 | III/IV | Chemotherapy | calcium | SD |
| UQCR10 | SNV | Missense_Mutation | novel | c.183N>T | p.Glu61Asp | p.E61D | Q9UDW1 | protein_coding | deleterious(0.01) | probably_damaging(0.972) | TCGA-A5-A2K5-01 | Endometrium | uterine corpus endometrioid carcinoma | Female | >=65 | I/II | Unknown | Unknown | SD |
| UQCR10 | SNV | Missense_Mutation | rs536988546 | c.64G>A | p.Ala22Thr | p.A22T | Q9UDW1 | protein_coding | tolerated(0.21) | benign(0.297) | TCGA-AX-A1C8-01 | Endometrium | uterine corpus endometrioid carcinoma | Female | >=65 | III/IV | Unspecific | Carboplatin | SD |
| UQCR10 | SNV | Missense_Mutation | novel | c.158G>T | p.Trp53Leu | p.W53L | Q9UDW1 | protein_coding | deleterious(0) | possibly_damaging(0.886) | TCGA-DF-A2KU-01 | Endometrium | uterine corpus endometrioid carcinoma | Female | Unknown | I/II | Unknown | Unknown | SD |
| UQCR10 | SNV | Missense_Mutation | rs749721393 | c.103N>A | p.Ala35Thr | p.A35T | Q9UDW1 | protein_coding | tolerated(0.16) | benign(0.015) | TCGA-22-1012-01 | Lung | lung squamous cell carcinoma | Female | >=65 | I/II | Unknown | Unknown | SD |


