
|
|||||
|
 | |
| |
| |
| |
| |
| |
|
Gene: UBE2S |
Gene summary for UBE2S |
| Gene information | Species | Human | Gene symbol | UBE2S | Gene ID | 27338 |
| Gene name | ubiquitin conjugating enzyme E2 S | |
| Gene Alias | E2-EPF | |
| Cytomap | 19q13.42 | |
| Gene Type | protein-coding | GO ID | GO:0000209 | UniProtAcc | Q16763 |
Top |
Malignant transformation analysis |
| Identification of the aberrant gene expression in precancerous and cancerous lesions by comparing the gene expression of stem-like cells in diseased tissues with normal stem cells |
| Entrez ID | Symbol | Replicates | Species | Organ | Tissue | Adj P-value | Log2FC | Malignancy |
| 27338 | UBE2S | CA_HPV_1 | Human | Cervix | CC | 1.04e-02 | -1.85e-01 | 0.0264 |
| 27338 | UBE2S | CA_HPV_2 | Human | Cervix | CC | 3.55e-02 | 3.02e-01 | 0.0391 |
| 27338 | UBE2S | CA_HPV_3 | Human | Cervix | CC | 1.25e-05 | 9.61e-02 | 0.0414 |
| 27338 | UBE2S | N_HPV_2 | Human | Cervix | N_HPV | 7.40e-04 | 1.41e-01 | -0.0131 |
| 27338 | UBE2S | CCI_1 | Human | Cervix | CC | 4.94e-03 | -5.07e-01 | 0.528 |
| 27338 | UBE2S | CCI_3 | Human | Cervix | CC | 3.66e-02 | -4.21e-01 | 0.516 |
| 27338 | UBE2S | CCII_1 | Human | Cervix | CC | 1.85e-08 | -5.16e-01 | 0.3249 |
| 27338 | UBE2S | LZE2T | Human | Esophagus | ESCC | 8.89e-07 | 1.27e+00 | 0.082 |
| 27338 | UBE2S | LZE4T | Human | Esophagus | ESCC | 6.44e-17 | 5.94e-01 | 0.0811 |
| 27338 | UBE2S | LZE7T | Human | Esophagus | ESCC | 2.34e-04 | 3.96e-01 | 0.0667 |
| 27338 | UBE2S | LZE20T | Human | Esophagus | ESCC | 4.15e-11 | 6.16e-01 | 0.0662 |
| 27338 | UBE2S | LZE22D1 | Human | Esophagus | HGIN | 4.16e-02 | 1.72e-01 | 0.0595 |
| 27338 | UBE2S | LZE22T | Human | Esophagus | ESCC | 1.65e-07 | 8.28e-01 | 0.068 |
| 27338 | UBE2S | LZE24T | Human | Esophagus | ESCC | 1.38e-23 | 9.69e-01 | 0.0596 |
| 27338 | UBE2S | LZE21T | Human | Esophagus | ESCC | 1.84e-10 | 1.14e+00 | 0.0655 |
| 27338 | UBE2S | P1T-E | Human | Esophagus | ESCC | 3.20e-19 | 7.48e-01 | 0.0875 |
| 27338 | UBE2S | P2T-E | Human | Esophagus | ESCC | 1.72e-34 | 9.65e-01 | 0.1177 |
| 27338 | UBE2S | P4T-E | Human | Esophagus | ESCC | 1.36e-65 | 1.92e+00 | 0.1323 |
| 27338 | UBE2S | P5T-E | Human | Esophagus | ESCC | 3.63e-52 | 1.19e+00 | 0.1327 |
| 27338 | UBE2S | P8T-E | Human | Esophagus | ESCC | 5.34e-36 | 9.92e-01 | 0.0889 |
| Page: 1 2 3 4 5 6 7 8 9 |
| Tissue | Expression Dynamics | Abbreviation |
| Cervix | 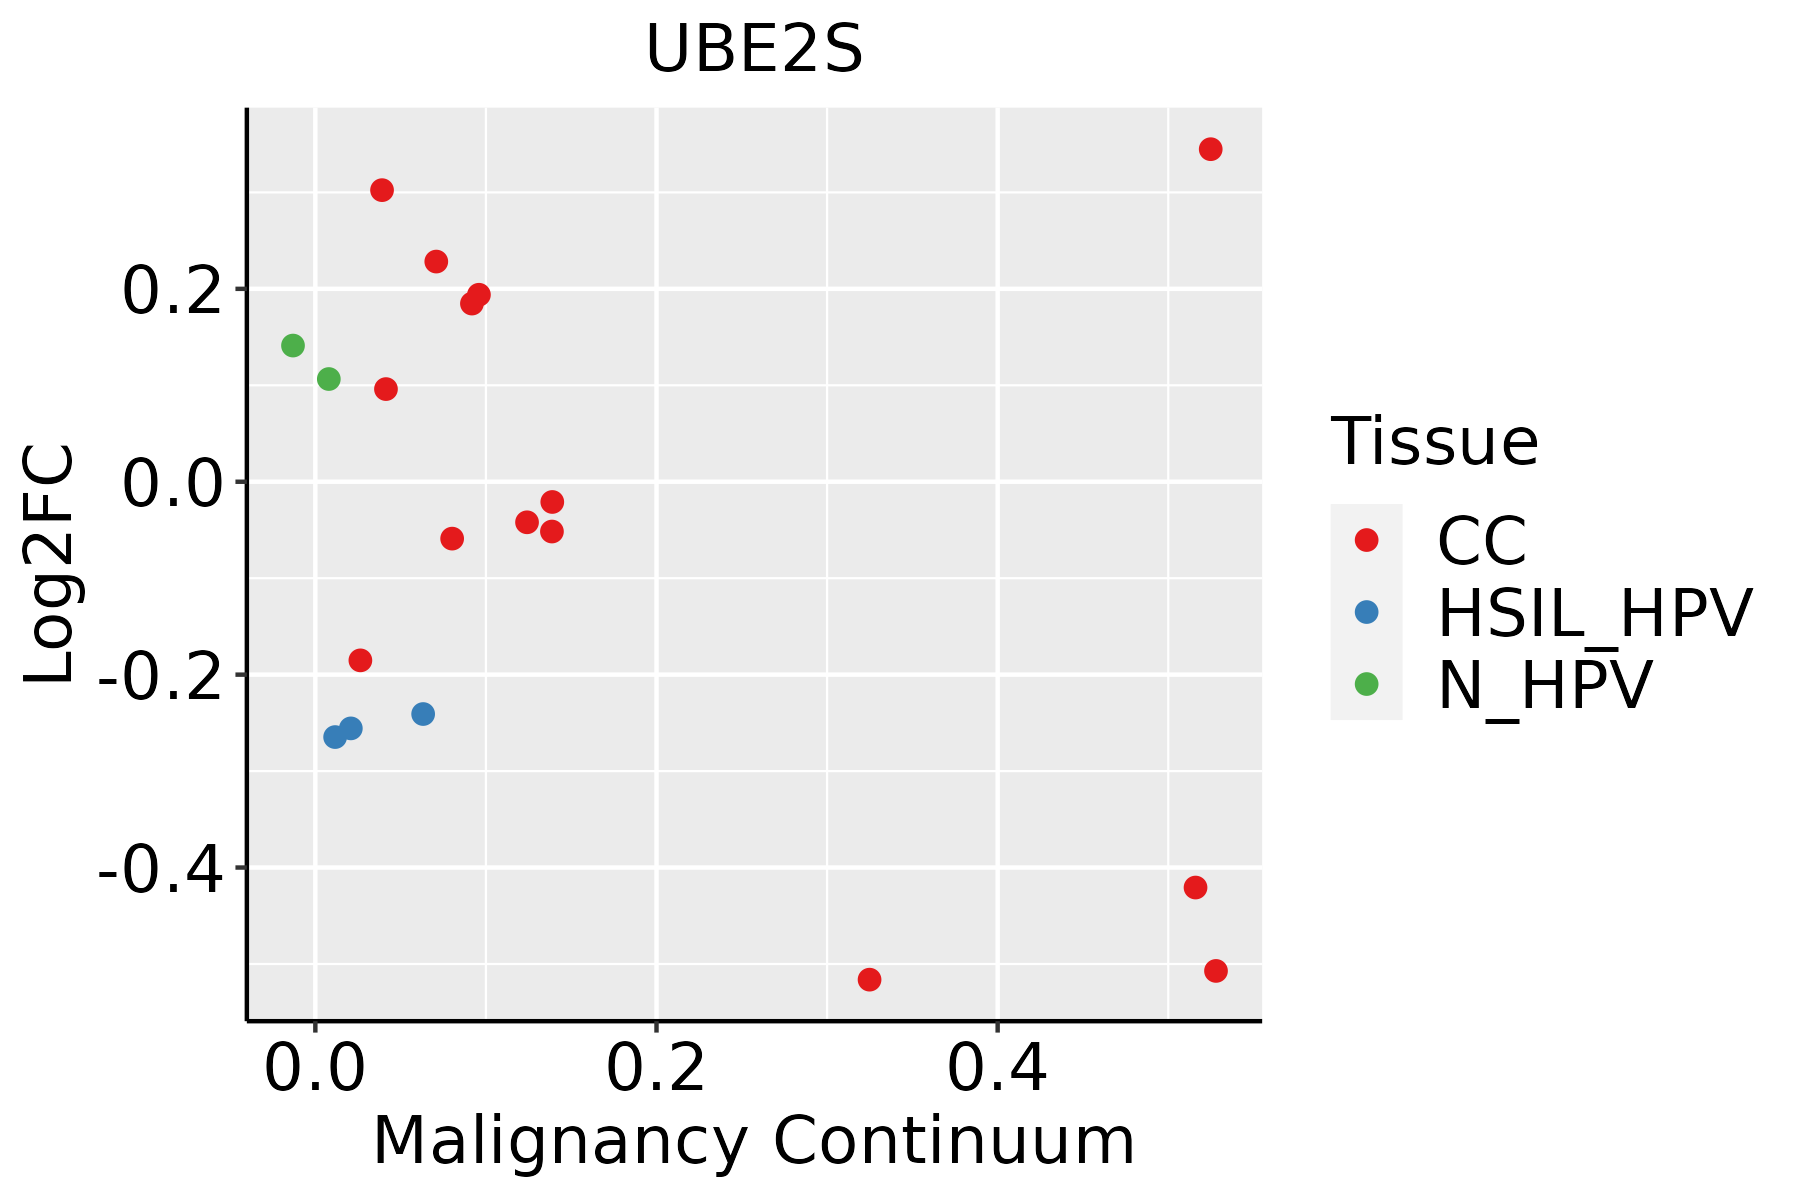 | CC: Cervix cancer |
| HSIL_HPV: HPV-infected high-grade squamous intraepithelial lesions | ||
| N_HPV: HPV-infected normal cervix | ||
| Esophagus |  | ESCC: Esophageal squamous cell carcinoma |
| HGIN: High-grade intraepithelial neoplasias | ||
| LGIN: Low-grade intraepithelial neoplasias | ||
| Liver | 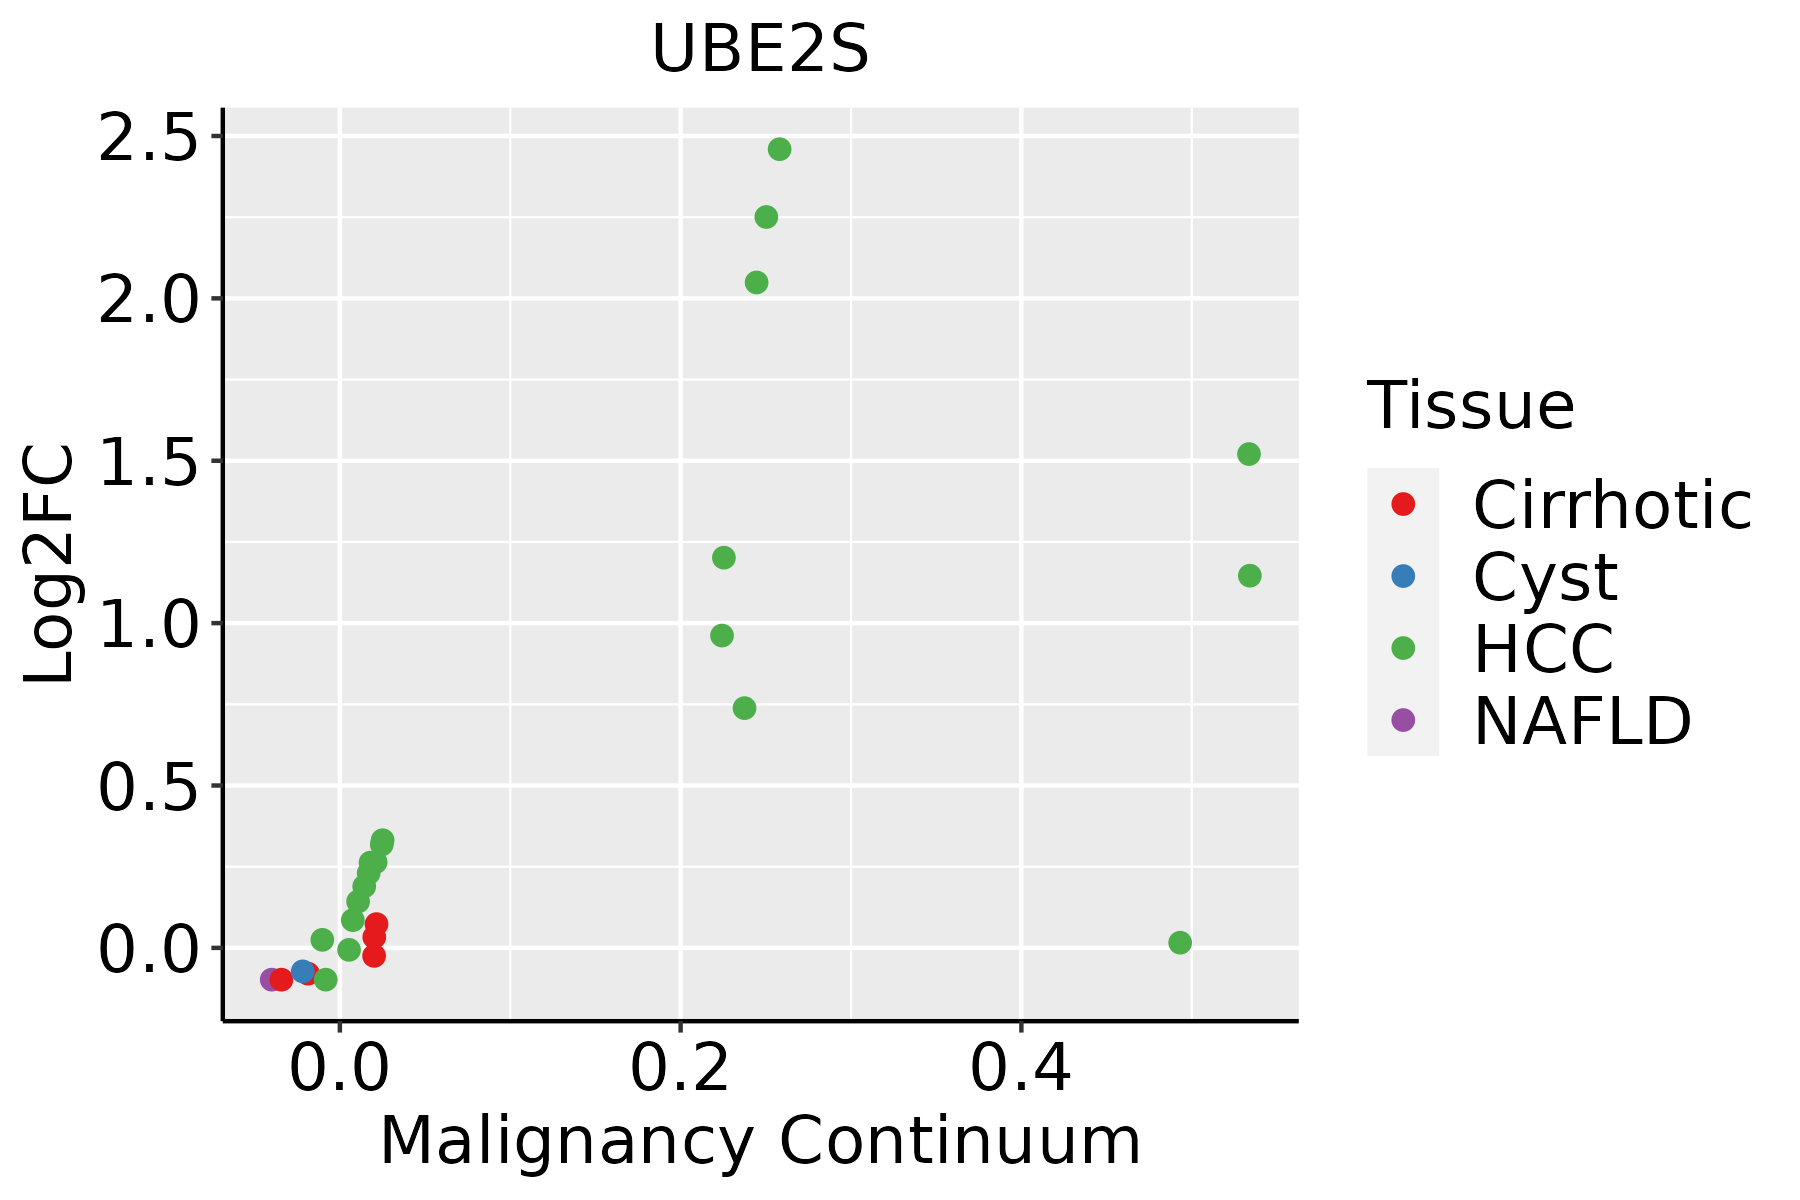 | HCC: Hepatocellular carcinoma |
| NAFLD: Non-alcoholic fatty liver disease | ||
| Lung |  | AAH: Atypical adenomatous hyperplasia |
| AIS: Adenocarcinoma in situ | ||
| IAC: Invasive lung adenocarcinoma | ||
| MIA: Minimally invasive adenocarcinoma | ||
| Oral Cavity | 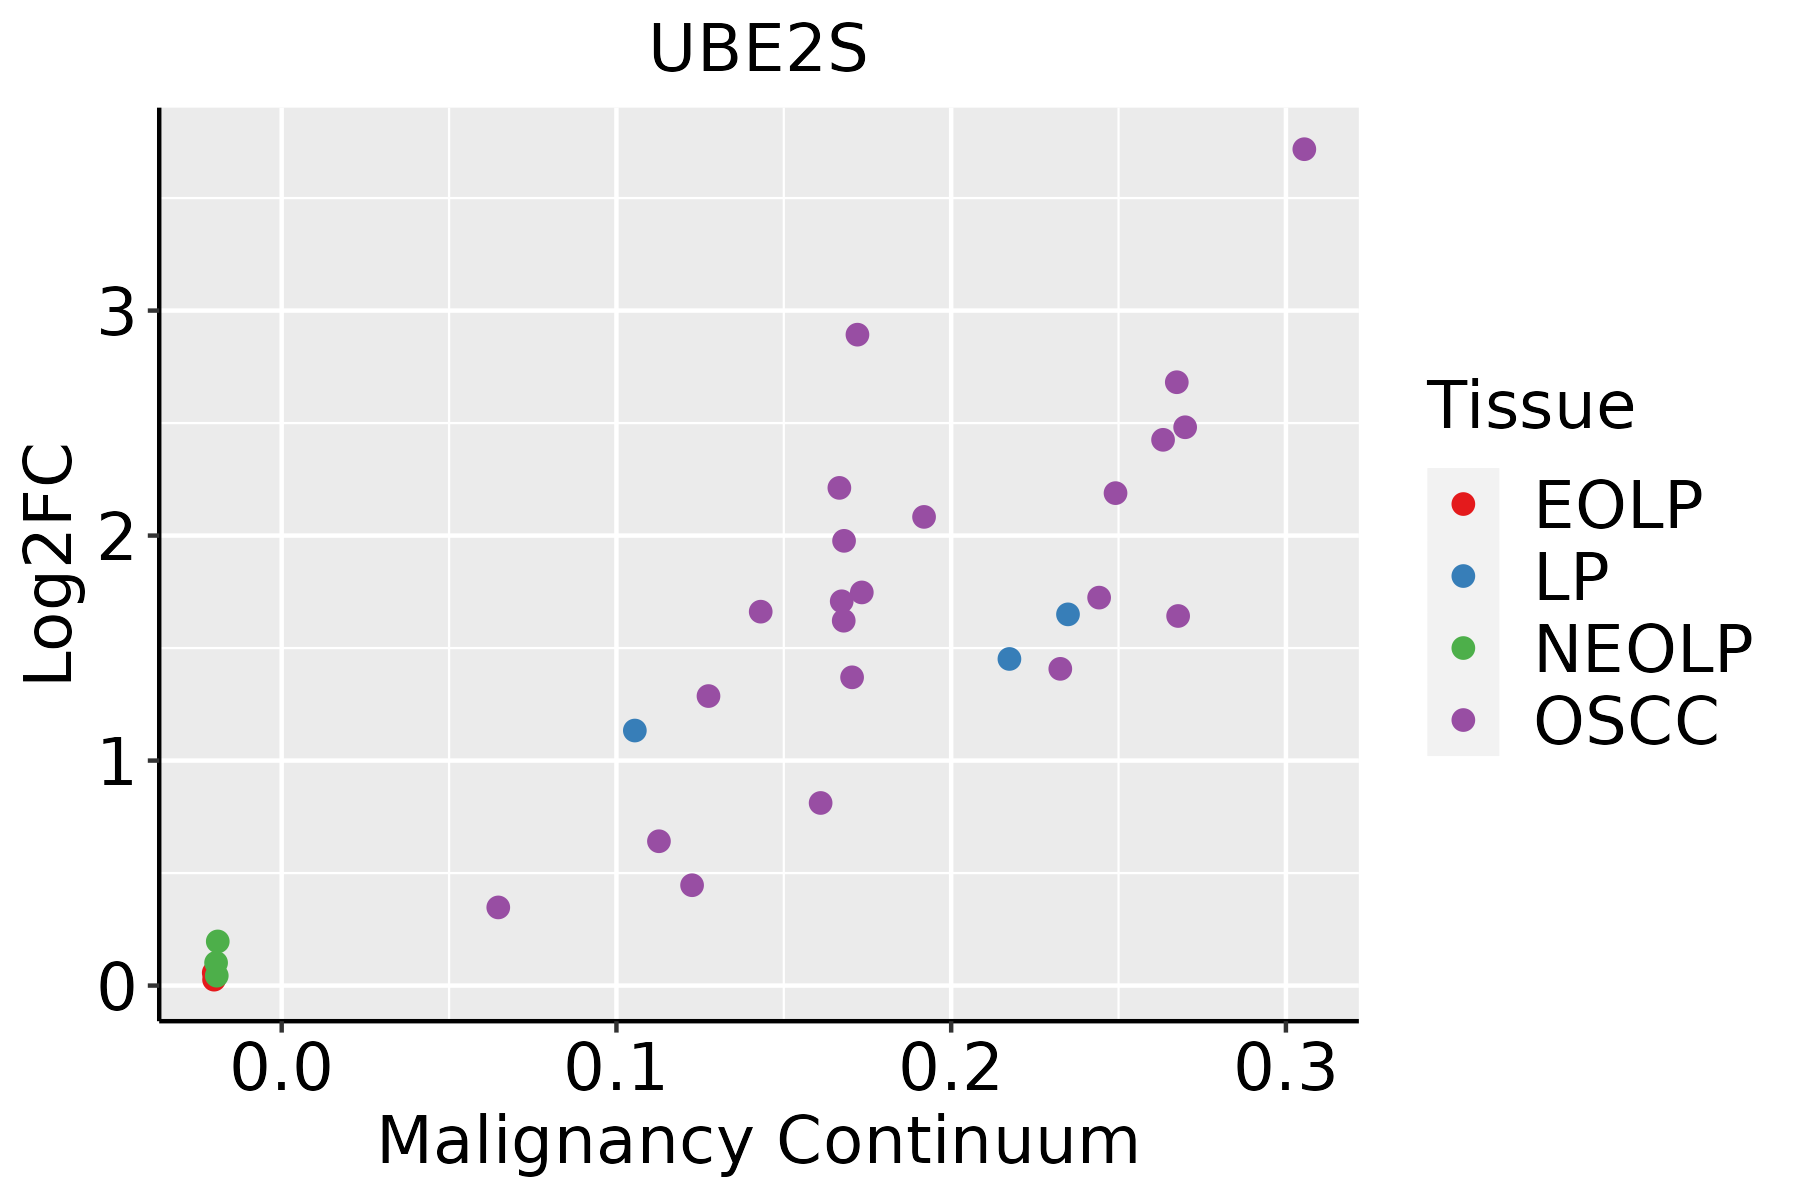 | EOLP: Erosive Oral lichen planus |
| LP: leukoplakia | ||
| NEOLP: Non-erosive oral lichen planus | ||
| OSCC: Oral squamous cell carcinoma | ||
| Prostate | 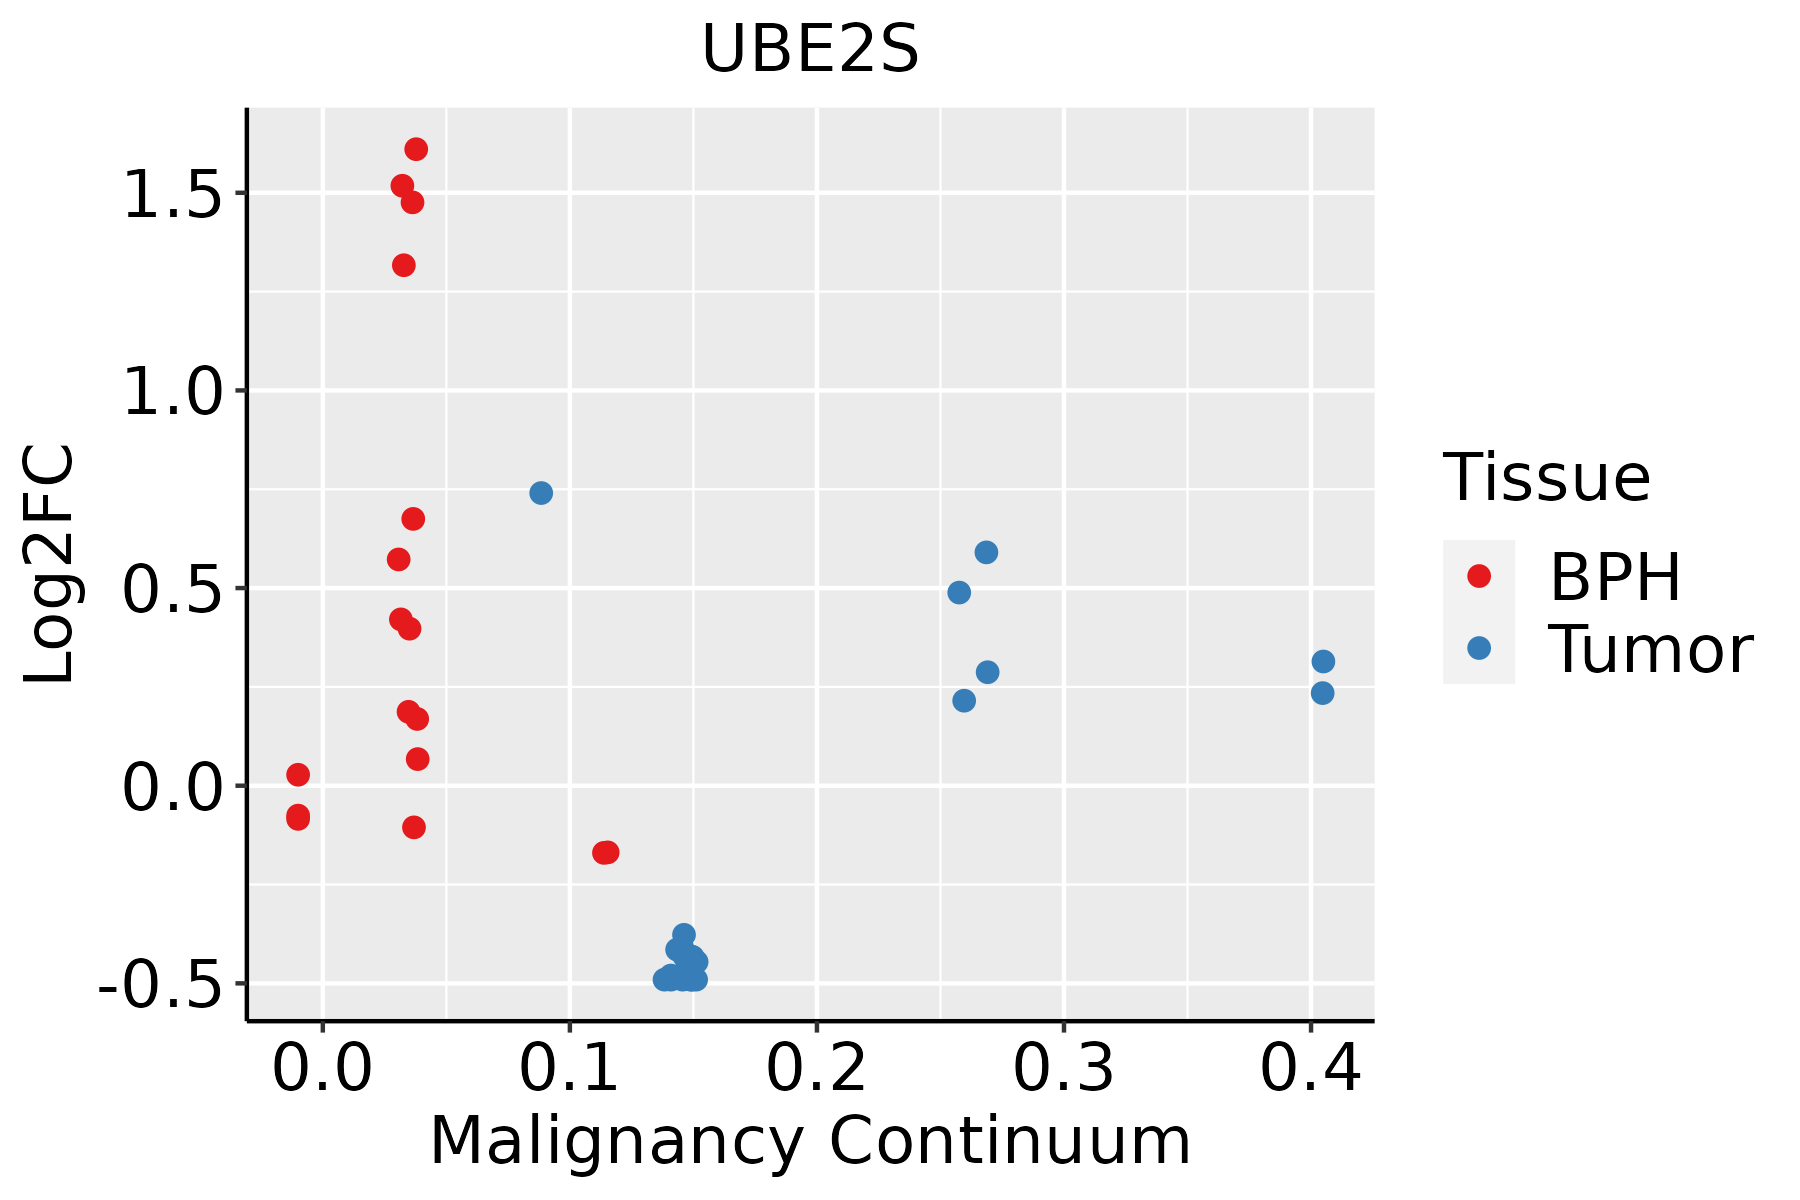 | BPH: Benign Prostatic Hyperplasia |
| Skin | 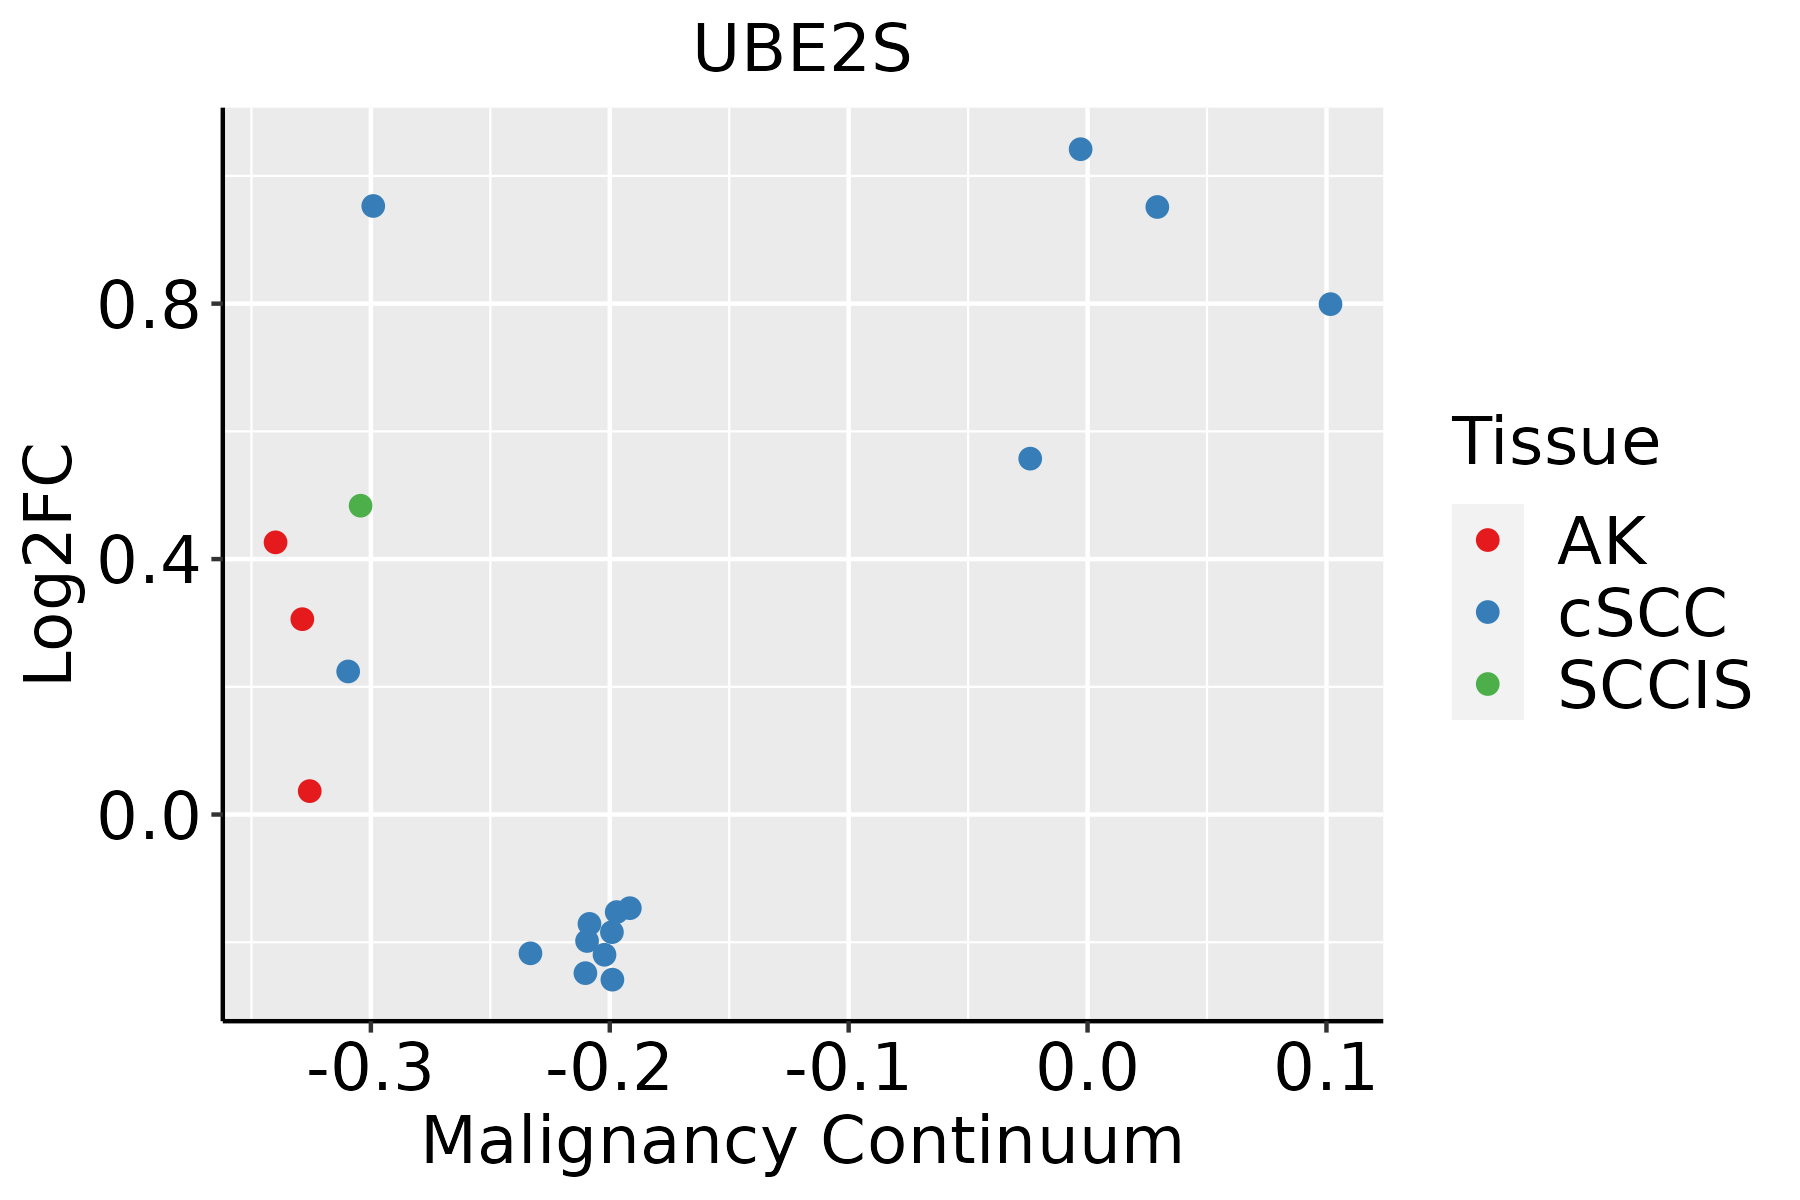 | AK: Actinic keratosis |
| cSCC: Cutaneous squamous cell carcinoma | ||
| SCCIS:squamous cell carcinoma in situ | ||
| Thyroid | 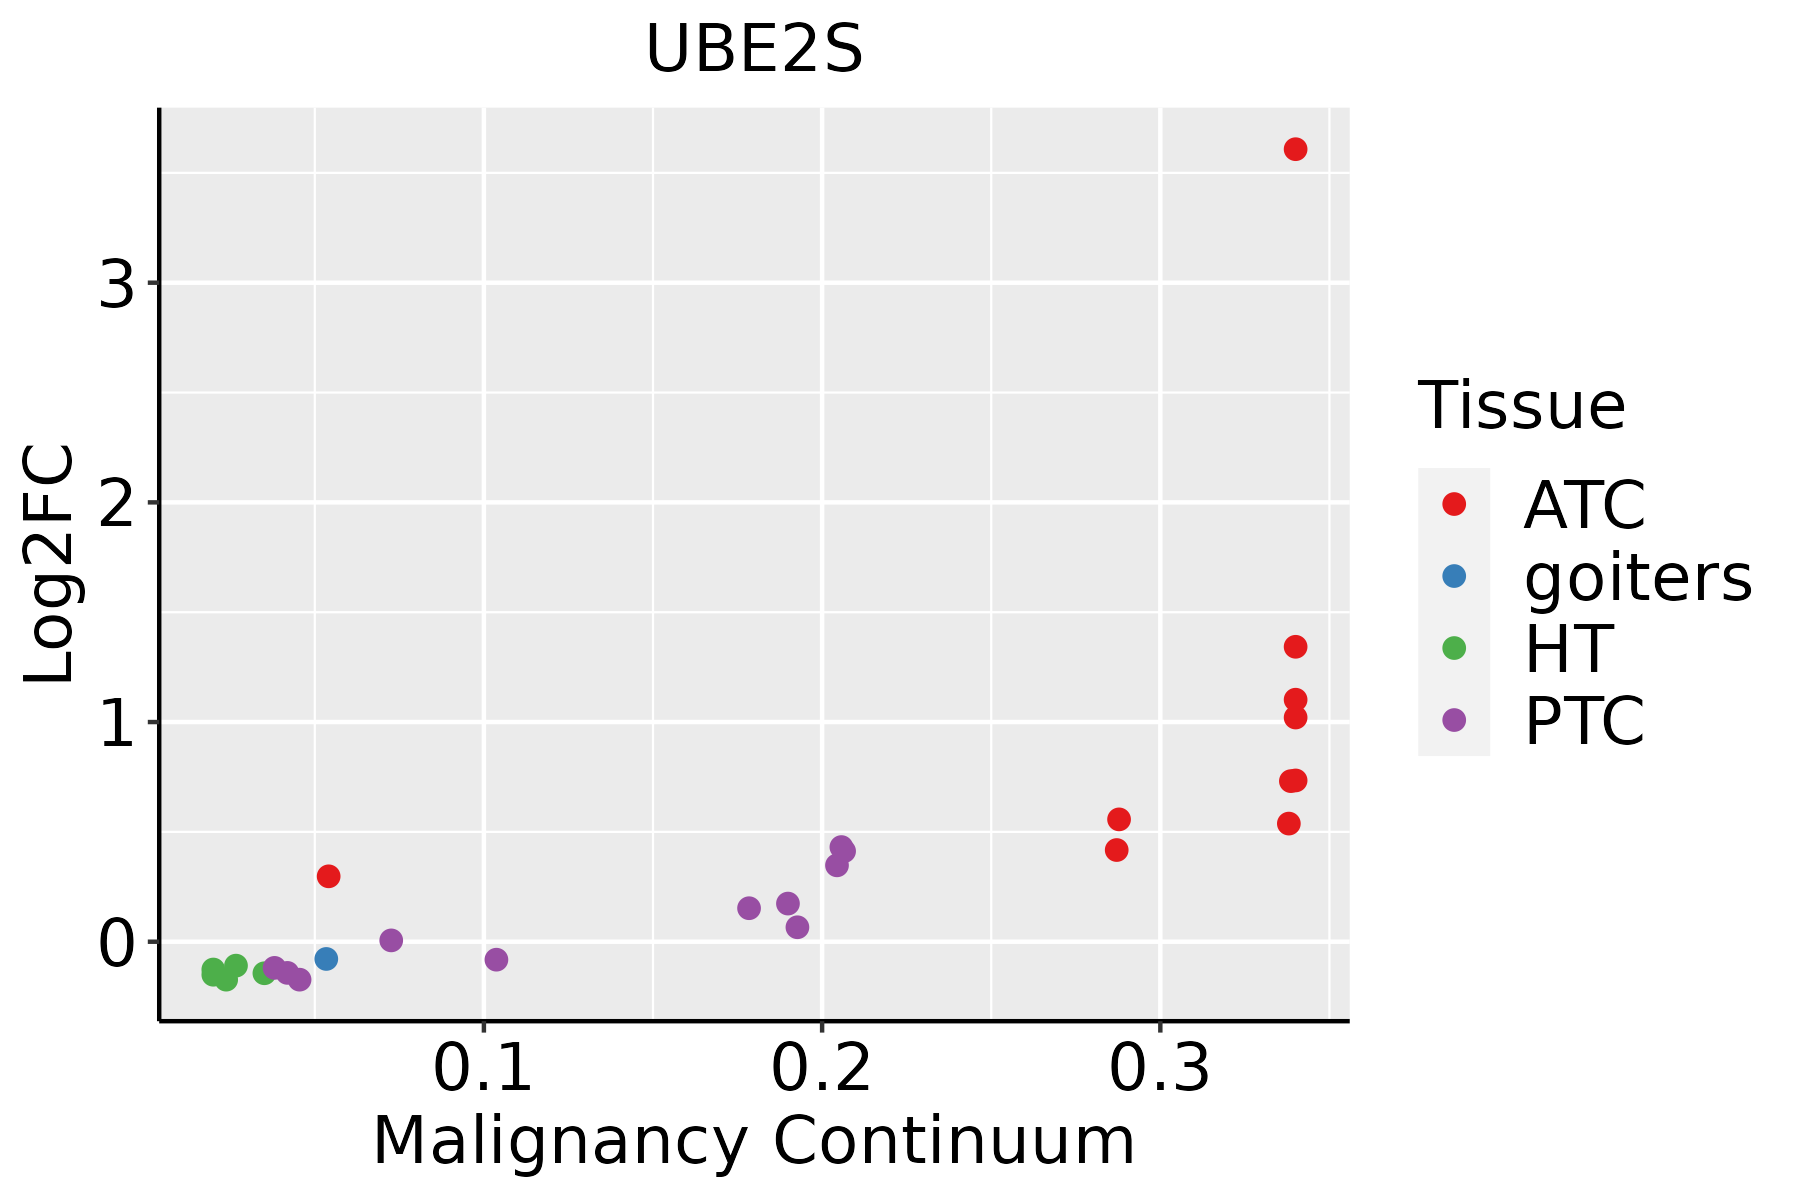 | ATC: Anaplastic thyroid cancer |
| HT: Hashimoto's thyroiditis | ||
| PTC: Papillary thyroid cancer |
| ∗log2FC in expression of this searched gene in stem-like cells from each diseased tissue sample relative to stem-like cells in normal samples in each tissue plotted against the malignancy continuum. Samples are colored based on if they are from different disease stage. |
Top |
Malignant transformation related pathway analysis |
| Find out the enriched GO biological processes and KEGG pathways involved in transition from healthy to precancer to cancer |
| Tissue | Disease Stage | Enriched GO biological Processes |
| Colorectum | AD |  |
| Colorectum | SER |  |
| Colorectum | MSS |  |
| Colorectum | MSI-H |  |
| Colorectum | FAP |  |
| ∗Top 15 enriched GO BP terms are showed in the bar plot of each disease state in each tissue. Each row represents a significant GO biological process which is colored according to the -log10(p.adjust). |
| Page: 1 2 3 4 5 6 7 8 9 |
| GO ID | Tissue | Disease Stage | Description | Gene Ratio | Bg Ratio | pvalue | p.adjust | Count |
| GO:190332018 | Prostate | BPH | regulation of protein modification by small protein conjugation or removal | 90/3107 | 242/18723 | 7.37e-15 | 1.01e-12 | 90 |
| GO:004316118 | Prostate | BPH | proteasome-mediated ubiquitin-dependent protein catabolic process | 127/3107 | 412/18723 | 3.84e-13 | 3.60e-11 | 127 |
| GO:005125818 | Prostate | BPH | protein polymerization | 96/3107 | 297/18723 | 1.52e-11 | 1.10e-09 | 96 |
| GO:003139618 | Prostate | BPH | regulation of protein ubiquitination | 74/3107 | 210/18723 | 3.66e-11 | 2.39e-09 | 74 |
| GO:00447727 | Prostate | BPH | mitotic cell cycle phase transition | 112/3107 | 424/18723 | 1.57e-07 | 3.58e-06 | 112 |
| GO:19033226 | Prostate | BPH | positive regulation of protein modification by small protein conjugation or removal | 46/3107 | 138/18723 | 1.09e-06 | 1.97e-05 | 46 |
| GO:00313985 | Prostate | BPH | positive regulation of protein ubiquitination | 39/3107 | 119/18723 | 1.09e-05 | 1.50e-04 | 39 |
| GO:00002099 | Prostate | BPH | protein polyubiquitination | 64/3107 | 236/18723 | 2.83e-05 | 3.31e-04 | 64 |
| GO:00514389 | Prostate | BPH | regulation of ubiquitin-protein transferase activity | 21/3107 | 53/18723 | 5.39e-05 | 5.50e-04 | 21 |
| GO:01400144 | Prostate | BPH | mitotic nuclear division | 67/3107 | 287/18723 | 1.87e-03 | 1.07e-02 | 67 |
| GO:190466617 | Prostate | BPH | regulation of ubiquitin protein ligase activity | 10/3107 | 23/18723 | 2.20e-03 | 1.22e-02 | 10 |
| GO:00514432 | Prostate | BPH | positive regulation of ubiquitin-protein transferase activity | 11/3107 | 31/18723 | 8.57e-03 | 3.68e-02 | 11 |
| GO:001049819 | Prostate | Tumor | proteasomal protein catabolic process | 158/3246 | 490/18723 | 3.05e-16 | 6.76e-14 | 158 |
| GO:190332019 | Prostate | Tumor | regulation of protein modification by small protein conjugation or removal | 92/3246 | 242/18723 | 1.20e-14 | 1.73e-12 | 92 |
| GO:004316119 | Prostate | Tumor | proteasome-mediated ubiquitin-dependent protein catabolic process | 130/3246 | 412/18723 | 7.97e-13 | 8.00e-11 | 130 |
| GO:003139619 | Prostate | Tumor | regulation of protein ubiquitination | 76/3246 | 210/18723 | 3.96e-11 | 2.68e-09 | 76 |
| GO:005125819 | Prostate | Tumor | protein polymerization | 93/3246 | 297/18723 | 2.22e-09 | 9.58e-08 | 93 |
| GO:190332214 | Prostate | Tumor | positive regulation of protein modification by small protein conjugation or removal | 47/3246 | 138/18723 | 1.50e-06 | 2.67e-05 | 47 |
| GO:003139814 | Prostate | Tumor | positive regulation of protein ubiquitination | 40/3246 | 119/18723 | 1.25e-05 | 1.76e-04 | 40 |
| GO:005143817 | Prostate | Tumor | regulation of ubiquitin-protein transferase activity | 22/3246 | 53/18723 | 3.06e-05 | 3.66e-04 | 22 |
| Page: 1 2 3 4 5 6 7 8 9 10 11 12 |
| Pathway ID | Tissue | Disease Stage | Description | Gene Ratio | Bg Ratio | pvalue | p.adjust | qvalue | Count |
| hsa0412014 | Cervix | CC | Ubiquitin mediated proteolysis | 49/1267 | 142/8465 | 4.26e-09 | 7.68e-08 | 4.54e-08 | 49 |
| hsa0412015 | Cervix | CC | Ubiquitin mediated proteolysis | 49/1267 | 142/8465 | 4.26e-09 | 7.68e-08 | 4.54e-08 | 49 |
| hsa0412026 | Esophagus | HGIN | Ubiquitin mediated proteolysis | 49/1383 | 142/8465 | 7.78e-08 | 1.33e-06 | 1.06e-06 | 49 |
| hsa04120111 | Esophagus | HGIN | Ubiquitin mediated proteolysis | 49/1383 | 142/8465 | 7.78e-08 | 1.33e-06 | 1.06e-06 | 49 |
| hsa0412027 | Esophagus | ESCC | Ubiquitin mediated proteolysis | 122/4205 | 142/8465 | 6.53e-20 | 7.29e-18 | 3.74e-18 | 122 |
| hsa0412036 | Esophagus | ESCC | Ubiquitin mediated proteolysis | 122/4205 | 142/8465 | 6.53e-20 | 7.29e-18 | 3.74e-18 | 122 |
| hsa0412041 | Liver | HCC | Ubiquitin mediated proteolysis | 110/4020 | 142/8465 | 1.67e-13 | 3.74e-12 | 2.08e-12 | 110 |
| hsa0412051 | Liver | HCC | Ubiquitin mediated proteolysis | 110/4020 | 142/8465 | 1.67e-13 | 3.74e-12 | 2.08e-12 | 110 |
| hsa0412012 | Lung | IAC | Ubiquitin mediated proteolysis | 40/1053 | 142/8465 | 3.24e-07 | 1.76e-05 | 1.17e-05 | 40 |
| hsa0412013 | Lung | IAC | Ubiquitin mediated proteolysis | 40/1053 | 142/8465 | 3.24e-07 | 1.76e-05 | 1.17e-05 | 40 |
| hsa0412020 | Oral cavity | OSCC | Ubiquitin mediated proteolysis | 105/3704 | 142/8465 | 1.83e-13 | 4.37e-12 | 2.23e-12 | 105 |
| hsa04120110 | Oral cavity | OSCC | Ubiquitin mediated proteolysis | 105/3704 | 142/8465 | 1.83e-13 | 4.37e-12 | 2.23e-12 | 105 |
| hsa0412025 | Oral cavity | LP | Ubiquitin mediated proteolysis | 66/2418 | 142/8465 | 3.74e-06 | 3.46e-05 | 2.23e-05 | 66 |
| hsa0412035 | Oral cavity | LP | Ubiquitin mediated proteolysis | 66/2418 | 142/8465 | 3.74e-06 | 3.46e-05 | 2.23e-05 | 66 |
| hsa0412061 | Oral cavity | NEOLP | Ubiquitin mediated proteolysis | 43/1112 | 142/8465 | 5.78e-08 | 9.19e-07 | 5.78e-07 | 43 |
| hsa0412071 | Oral cavity | NEOLP | Ubiquitin mediated proteolysis | 43/1112 | 142/8465 | 5.78e-08 | 9.19e-07 | 5.78e-07 | 43 |
| hsa0412018 | Prostate | BPH | Ubiquitin mediated proteolysis | 61/1718 | 142/8465 | 5.50e-10 | 9.07e-09 | 5.61e-09 | 61 |
| hsa0412019 | Prostate | BPH | Ubiquitin mediated proteolysis | 61/1718 | 142/8465 | 5.50e-10 | 9.07e-09 | 5.61e-09 | 61 |
| hsa0412024 | Prostate | Tumor | Ubiquitin mediated proteolysis | 61/1791 | 142/8465 | 3.08e-09 | 5.09e-08 | 3.16e-08 | 61 |
| hsa0412034 | Prostate | Tumor | Ubiquitin mediated proteolysis | 61/1791 | 142/8465 | 3.08e-09 | 5.09e-08 | 3.16e-08 | 61 |
| Page: 1 |
Top |
Cell-cell communication analysis |
| Identification of potential cell-cell interactions between two cell types and their ligand-receptor pairs for different disease states |
| Ligand | Receptor | LRpair | Pathway | Tissue | Disease Stage |
| Page: 1 |
Top |
Single-cell gene regulatory network inference analysis |
| Find out the significant the regulons (TFs) and the target genes of each regulon across cell types for different disease states |
| TF | Cell Type | Tissue | Disease Stage | Target Gene | RSS | Regulon Activity |
| ∗The dot plots of a searched regulon are shown for all cell subpopulations in each disease state of each tissue based on the regulon specific score inferred using pySCENIC and by calculating the average expression. |
| Page: 1 |
Top |
Somatic mutation of malignant transformation related genes |
| Annotation of somatic variants for genes involved in malignant transformation |
| Hugo Symbol | Variant Class | Variant Classification | dbSNP RS | HGVSc | HGVSp | HGVSp Short | SWISSPROT | BIOTYPE | SIFT | PolyPhen | Tumor Sample Barcode | Tissue | Histology | Sex | Age | Stage | Therapy Types | Drugs | Outcome |
| UBE2S | SNV | Missense_Mutation | novel | c.260N>G | p.Asn87Ser | p.N87S | Q16763 | protein_coding | deleterious(0) | probably_damaging(0.999) | TCGA-AA-3510-01 | Colorectum | colon adenocarcinoma | Male | >=65 | I/II | Unknown | Unknown | SD |
| UBE2S | SNV | Missense_Mutation | rs780497000 | c.653C>T | p.Ala218Val | p.A218V | Q16763 | protein_coding | deleterious(0.01) | probably_damaging(0.97) | TCGA-AJ-A3EK-01 | Endometrium | uterine corpus endometrioid carcinoma | Female | <65 | I/II | Chemotherapy | carboplatin | CR |
| UBE2S | SNV | Missense_Mutation | novel | c.403C>T | p.Arg135Cys | p.R135C | Q16763 | protein_coding | deleterious(0.05) | probably_damaging(0.974) | TCGA-AJ-A3OK-01 | Endometrium | uterine corpus endometrioid carcinoma | Female | >=65 | I/II | Chemotherapy | carboplatin | CR |
| UBE2S | SNV | Missense_Mutation | novel | c.18N>T | p.Glu6Asp | p.E6D | Q16763 | protein_coding | deleterious(0) | probably_damaging(0.955) | TCGA-AX-A05Z-01 | Endometrium | uterine corpus endometrioid carcinoma | Female | <65 | III/IV | Chemotherapy | adriamycin | SD |
| UBE2S | SNV | Missense_Mutation | novel | c.652N>A | p.Ala218Thr | p.A218T | Q16763 | protein_coding | tolerated(0.32) | probably_damaging(0.977) | TCGA-DI-A1BU-01 | Endometrium | uterine corpus endometrioid carcinoma | Female | <65 | I/II | Chemotherapy | paclitaxel | SD |
| UBE2S | SNV | Missense_Mutation | novel | c.403N>T | p.Arg135Cys | p.R135C | Q16763 | protein_coding | deleterious(0.05) | probably_damaging(0.974) | TCGA-FI-A2D0-01 | Endometrium | uterine corpus endometrioid carcinoma | Female | <65 | I/II | Unknown | Unknown | SD |
| UBE2S | SNV | Missense_Mutation | rs374069290 | c.40N>T | p.Arg14Cys | p.R14C | Q16763 | protein_coding | deleterious(0) | probably_damaging(0.946) | TCGA-FV-A3I0-01 | Liver | liver hepatocellular carcinoma | Female | >=65 | I/II | Chemotherapy | gemcitabine | PD |
| UBE2S | SNV | Missense_Mutation | c.578G>A | p.Gly193Asp | p.G193D | Q16763 | protein_coding | deleterious(0.02) | probably_damaging(0.984) | TCGA-55-6985-01 | Lung | lung adenocarcinoma | Female | <65 | I/II | Unknown | Unknown | SD | |
| UBE2S | SNV | Missense_Mutation | c.37N>T | p.Ile13Phe | p.I13F | Q16763 | protein_coding | deleterious(0) | benign(0.28) | TCGA-69-7765-01 | Lung | lung adenocarcinoma | Male | <65 | III/IV | Chemotherapy | carboplatin | SD | |
| UBE2S | SNV | Missense_Mutation | novel | c.262N>T | p.Val88Leu | p.V88L | Q16763 | protein_coding | deleterious(0) | probably_damaging(0.982) | TCGA-CR-7372-01 | Oral cavity | head & neck squamous cell carcinoma | Male | <65 | I/II | Unknown | Unknown | SD |
| Page: 1 2 |
Top |
Related drugs of malignant transformation related genes |
| Identification of chemicals and drugs interact with genes involved in malignant transfromation |
| (DGIdb 4.0) |
| Entrez ID | Symbol | Category | Interaction Types | Drug Claim Name | Drug Name | PMIDs |
| Page: 1 |

Copyright 2023-Present -The University of Texas Health Science Center at Houston |