
|
|||||
|
 | |
| |
| |
| |
| |
| |
|
Gene: TRAPPC1 |
Gene summary for TRAPPC1 |
| Gene information | Species | Human | Gene symbol | TRAPPC1 | Gene ID | 58485 |
| Gene name | trafficking protein particle complex subunit 1 | |
| Gene Alias | BET5 | |
| Cytomap | 17p13.1 | |
| Gene Type | protein-coding | GO ID | GO:0006810 | UniProtAcc | Q9Y5R8 |
Top |
Malignant transformation analysis |
| Identification of the aberrant gene expression in precancerous and cancerous lesions by comparing the gene expression of stem-like cells in diseased tissues with normal stem cells |
| Entrez ID | Symbol | Replicates | Species | Organ | Tissue | Adj P-value | Log2FC | Malignancy |
| 58485 | TRAPPC1 | CA_HPV_1 | Human | Cervix | CC | 1.05e-05 | -2.50e-02 | 0.0264 |
| 58485 | TRAPPC1 | CCI_1 | Human | Cervix | CC | 7.13e-08 | -6.07e-01 | 0.528 |
| 58485 | TRAPPC1 | CCI_3 | Human | Cervix | CC | 3.72e-08 | -5.91e-01 | 0.516 |
| 58485 | TRAPPC1 | CCII_1 | Human | Cervix | CC | 2.01e-12 | -5.95e-01 | 0.3249 |
| 58485 | TRAPPC1 | HTA11_3410_2000001011 | Human | Colorectum | AD | 9.09e-07 | 1.79e-01 | 0.0155 |
| 58485 | TRAPPC1 | HTA11_2487_2000001011 | Human | Colorectum | SER | 2.87e-12 | 4.03e-01 | -0.1808 |
| 58485 | TRAPPC1 | HTA11_2951_2000001011 | Human | Colorectum | AD | 2.49e-02 | 2.65e-01 | 0.0216 |
| 58485 | TRAPPC1 | HTA11_1938_2000001011 | Human | Colorectum | AD | 2.99e-07 | 3.26e-01 | -0.0811 |
| 58485 | TRAPPC1 | HTA11_78_2000001011 | Human | Colorectum | AD | 1.91e-02 | 1.91e-01 | -0.1088 |
| 58485 | TRAPPC1 | HTA11_347_2000001011 | Human | Colorectum | AD | 1.40e-13 | 3.42e-01 | -0.1954 |
| 58485 | TRAPPC1 | HTA11_411_2000001011 | Human | Colorectum | SER | 3.65e-02 | 3.89e-01 | -0.2602 |
| 58485 | TRAPPC1 | HTA11_3361_2000001011 | Human | Colorectum | AD | 6.29e-08 | 3.05e-01 | -0.1207 |
| 58485 | TRAPPC1 | HTA11_83_2000001011 | Human | Colorectum | SER | 5.22e-04 | 3.07e-01 | -0.1526 |
| 58485 | TRAPPC1 | HTA11_696_2000001011 | Human | Colorectum | AD | 5.25e-16 | 3.60e-01 | -0.1464 |
| 58485 | TRAPPC1 | HTA11_866_2000001011 | Human | Colorectum | AD | 1.80e-07 | 1.86e-01 | -0.1001 |
| 58485 | TRAPPC1 | HTA11_1391_2000001011 | Human | Colorectum | AD | 2.56e-18 | 5.14e-01 | -0.059 |
| 58485 | TRAPPC1 | HTA11_2992_2000001011 | Human | Colorectum | SER | 1.37e-04 | 4.29e-01 | -0.1706 |
| 58485 | TRAPPC1 | HTA11_5212_2000001011 | Human | Colorectum | AD | 7.59e-07 | 3.87e-01 | -0.2061 |
| 58485 | TRAPPC1 | HTA11_5216_2000001011 | Human | Colorectum | SER | 9.12e-05 | 4.00e-01 | -0.1462 |
| 58485 | TRAPPC1 | HTA11_546_2000001011 | Human | Colorectum | AD | 1.57e-10 | 4.91e-01 | -0.0842 |
| Page: 1 2 3 4 5 6 7 8 9 10 11 |
| Tissue | Expression Dynamics | Abbreviation |
| Cervix | 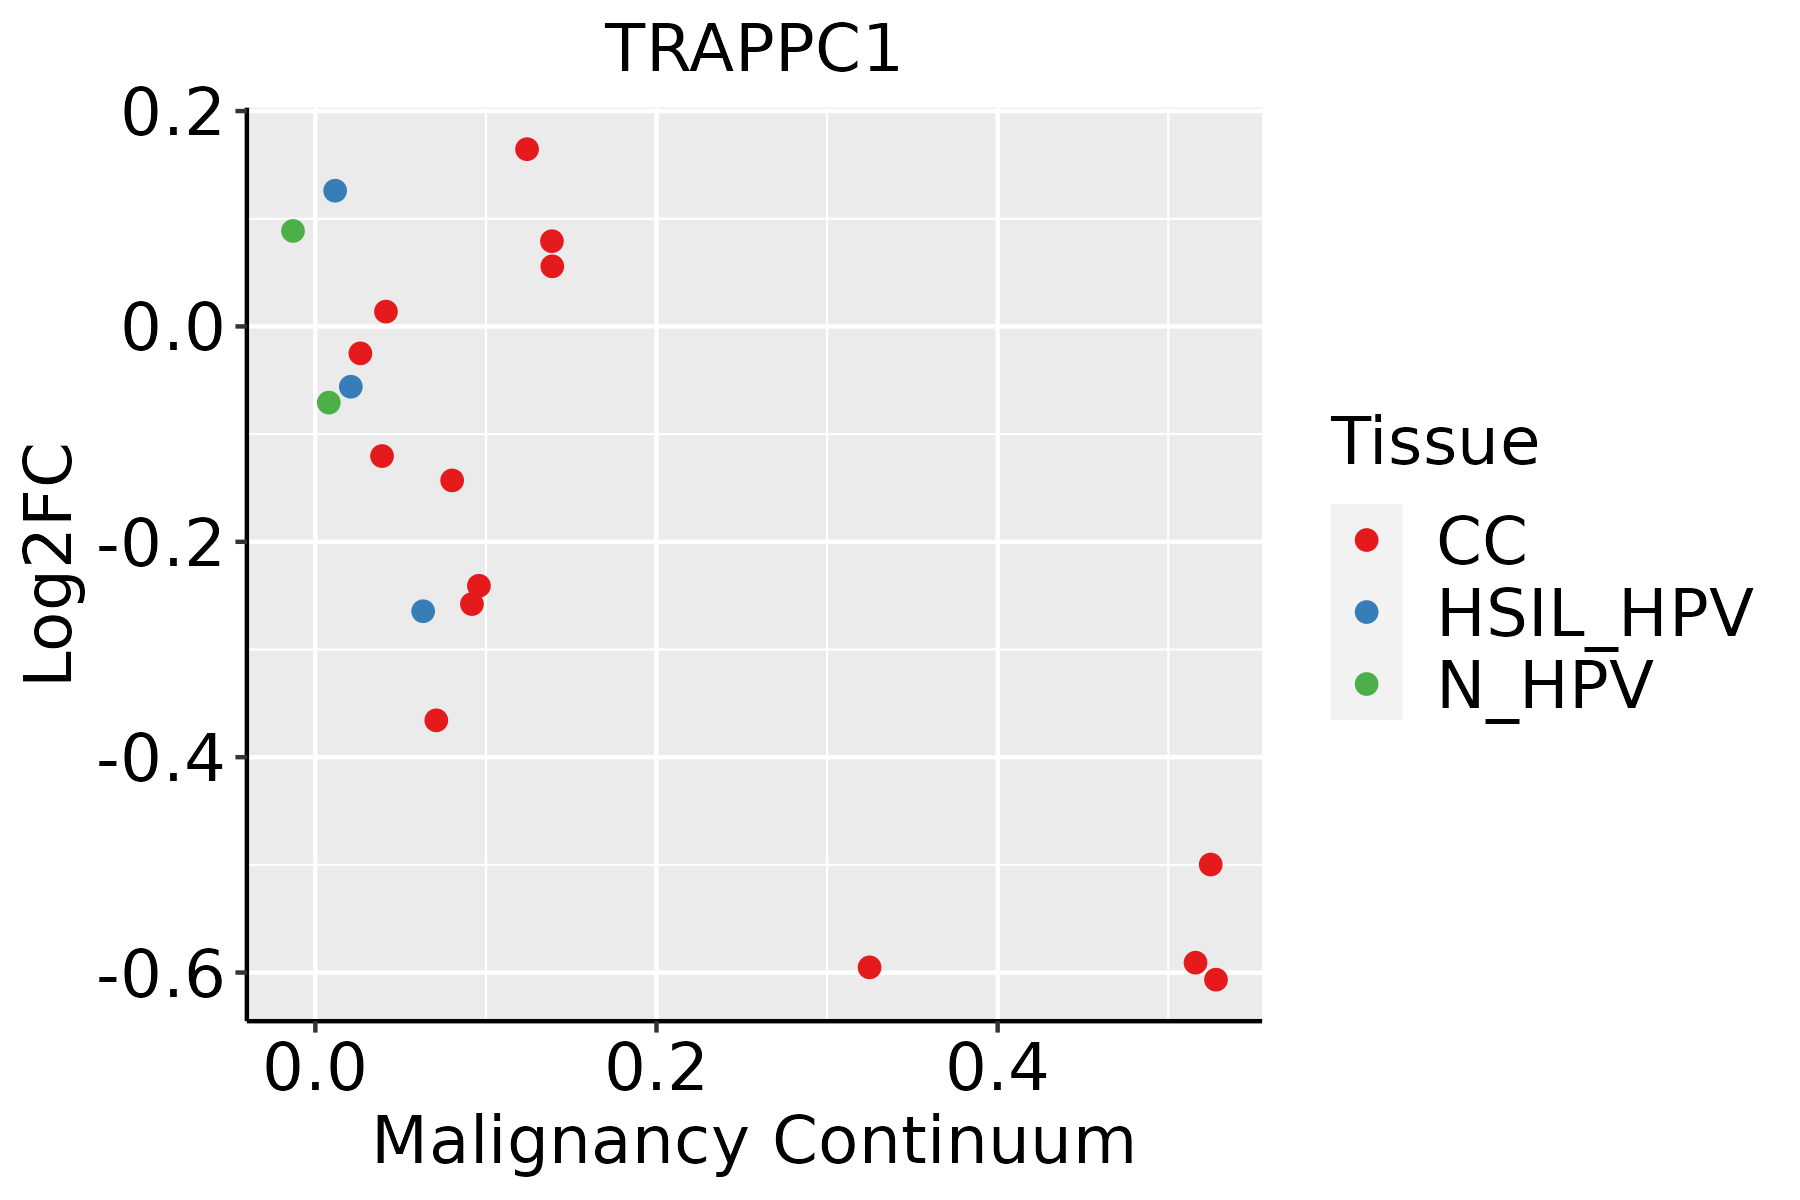 | CC: Cervix cancer |
| HSIL_HPV: HPV-infected high-grade squamous intraepithelial lesions | ||
| N_HPV: HPV-infected normal cervix | ||
| Colorectum (GSE201348) | 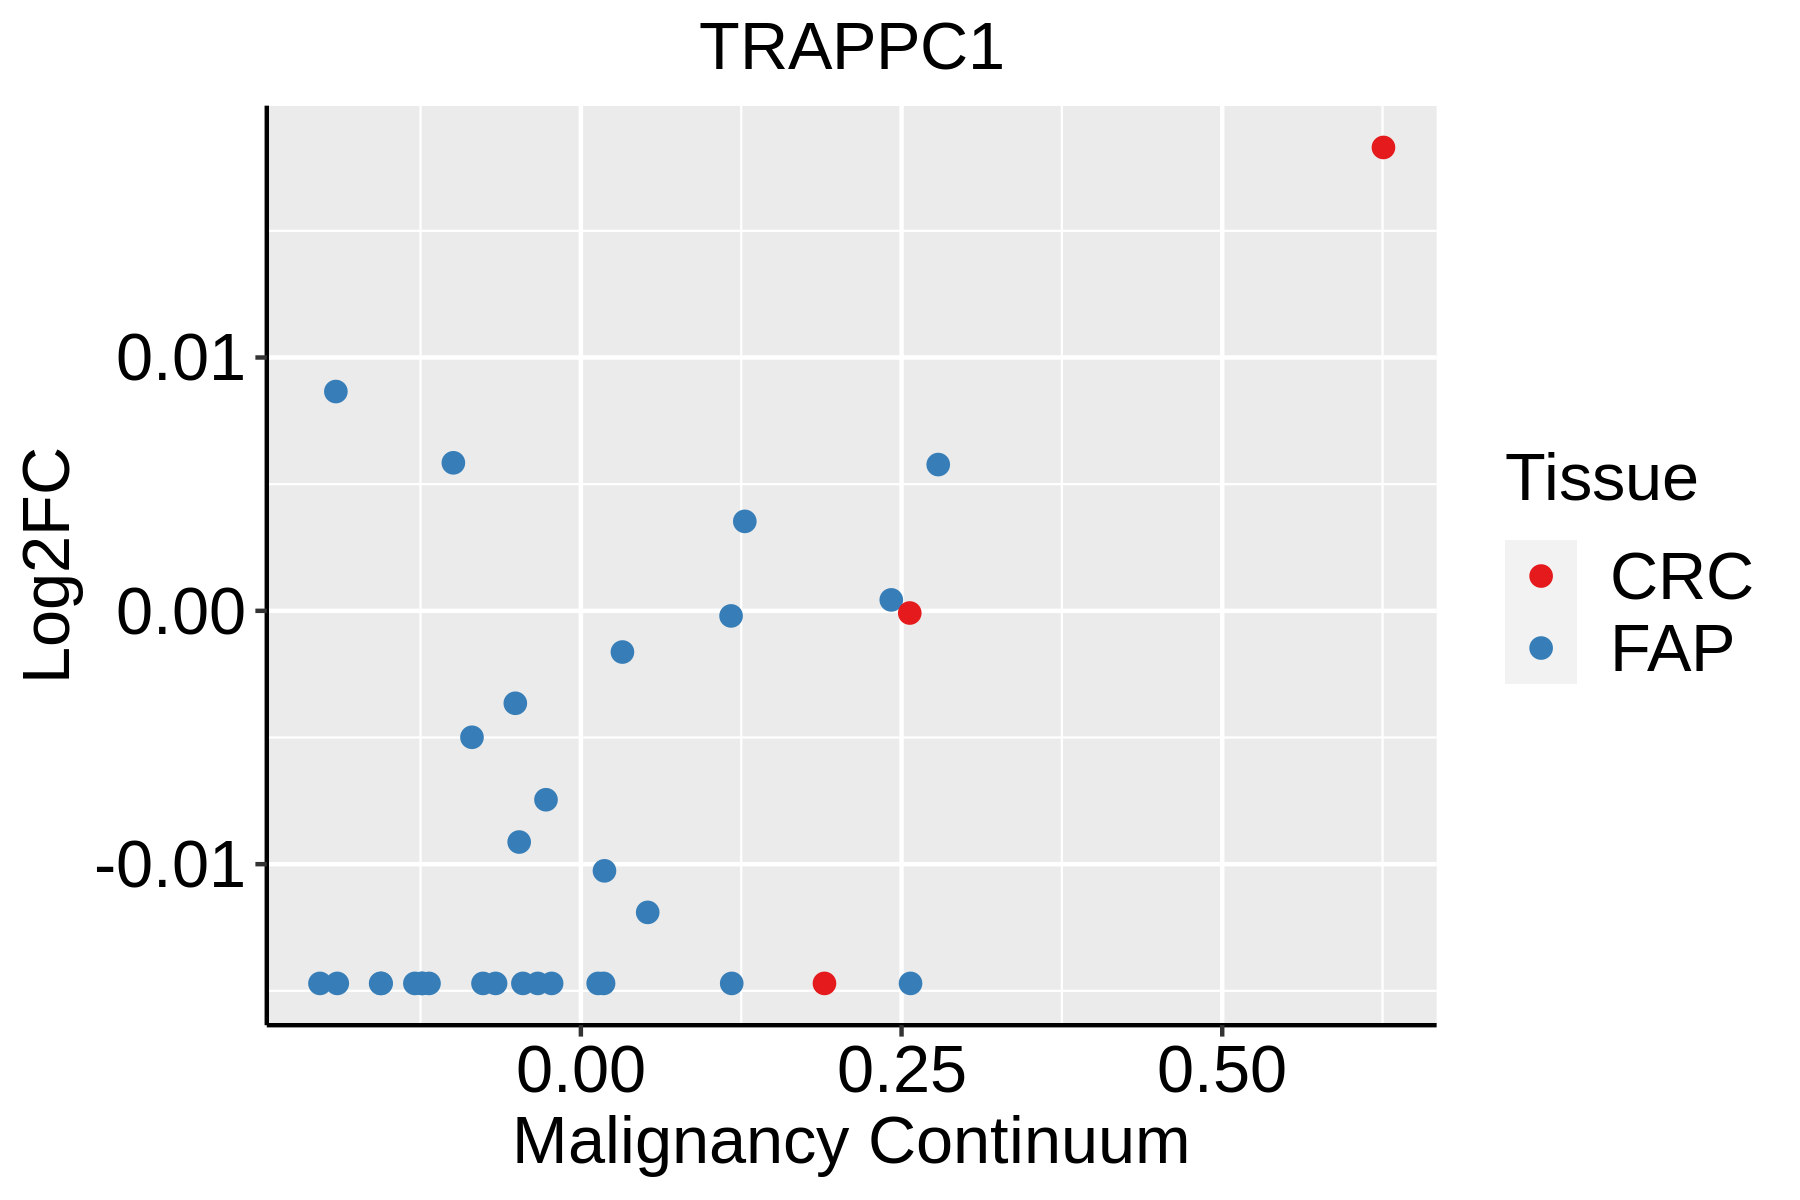 | FAP: Familial adenomatous polyposis |
| CRC: Colorectal cancer | ||
| Colorectum (HTA11) |  | AD: Adenomas |
| SER: Sessile serrated lesions | ||
| MSI-H: Microsatellite-high colorectal cancer | ||
| MSS: Microsatellite stable colorectal cancer | ||
| Endometrium | 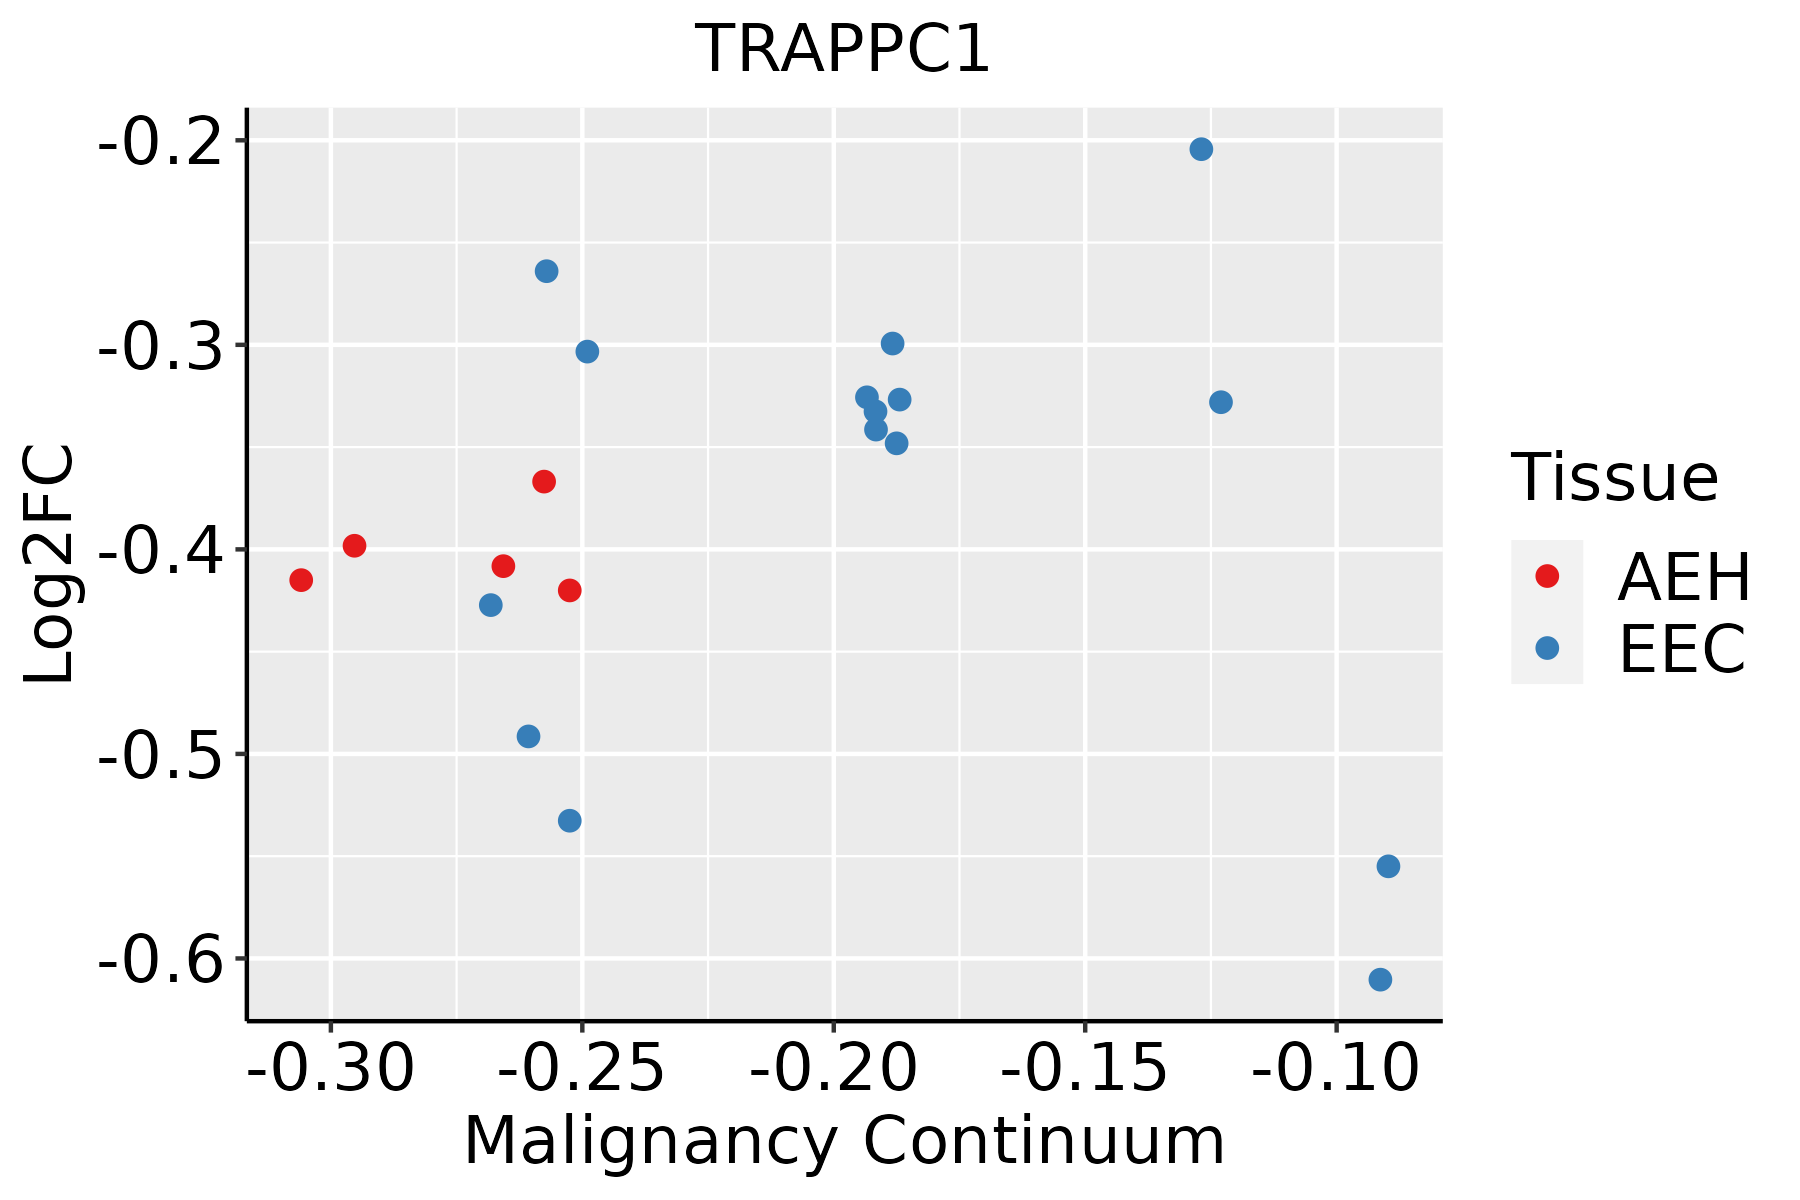 | AEH: Atypical endometrial hyperplasia |
| EEC: Endometrioid Cancer | ||
| Esophagus | 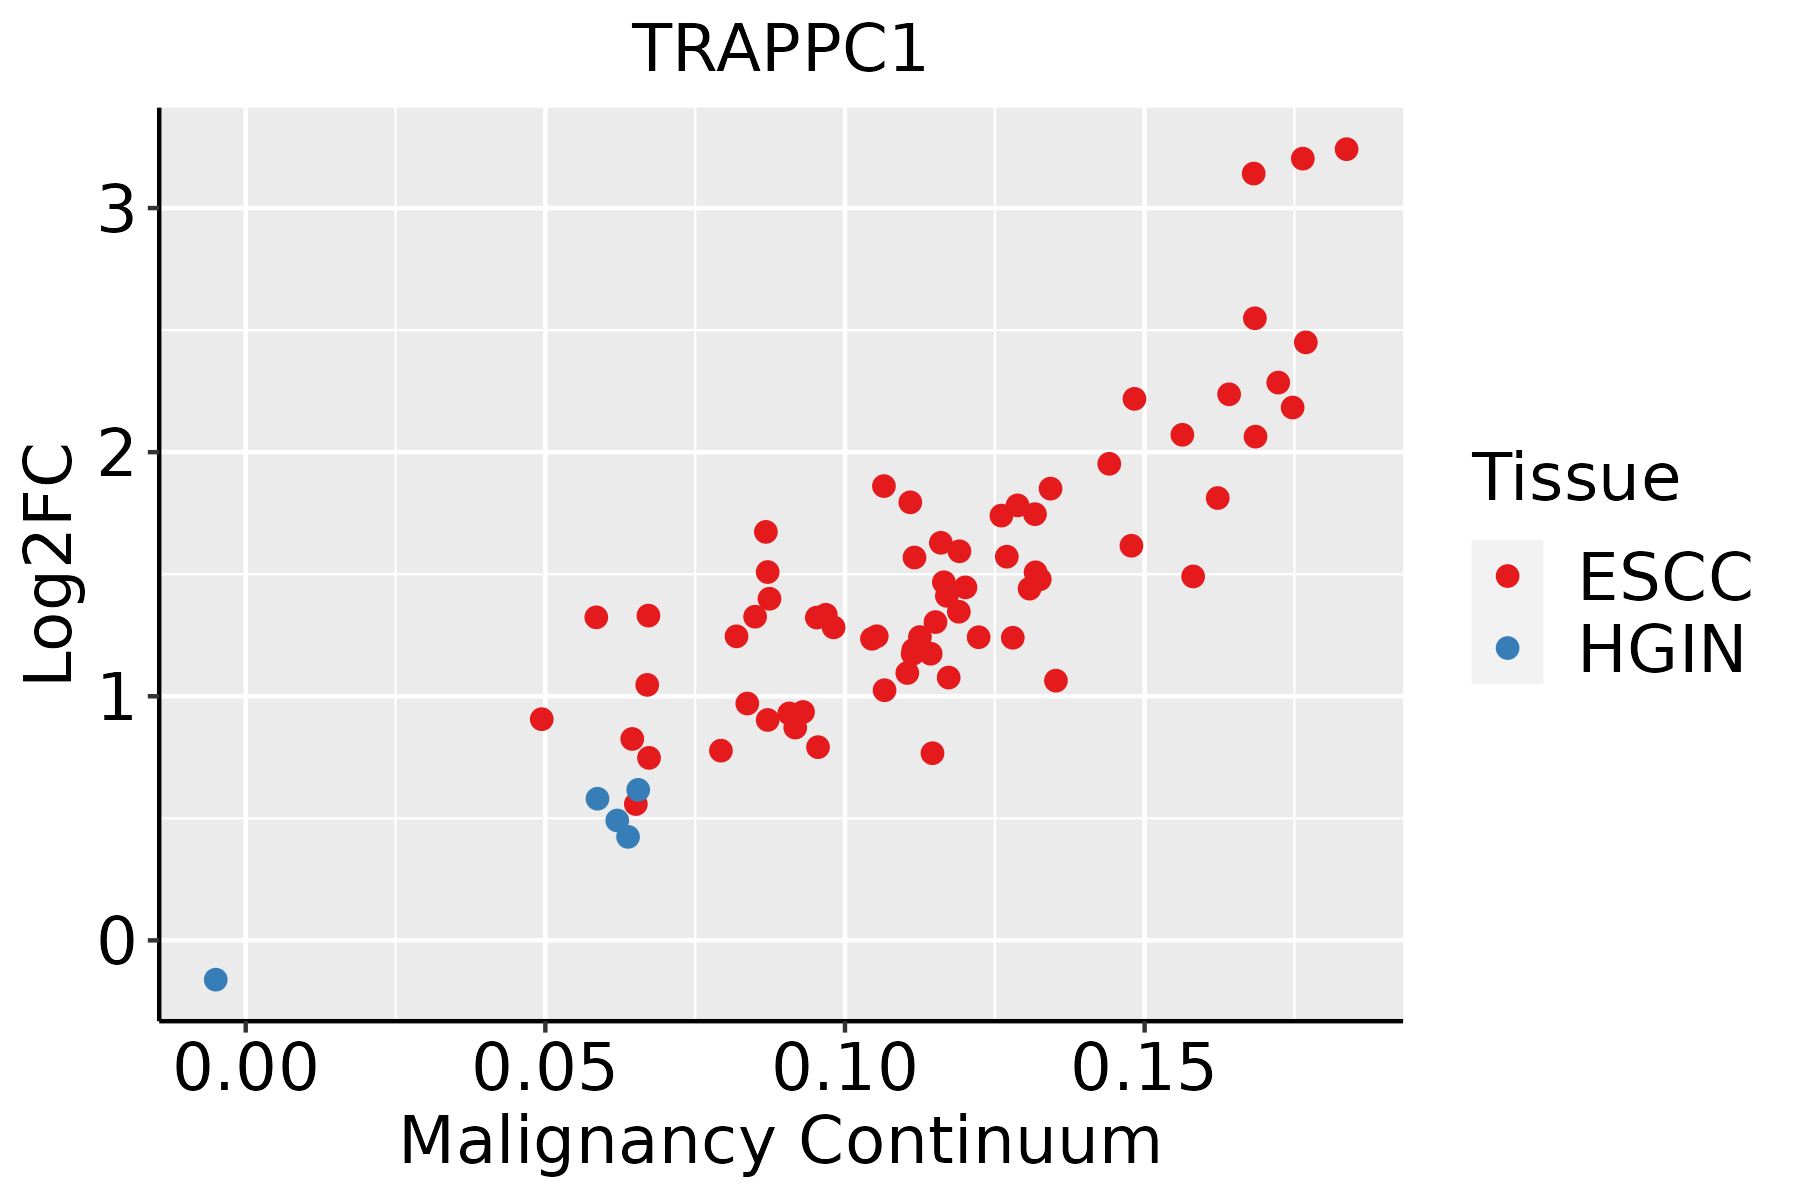 | ESCC: Esophageal squamous cell carcinoma |
| HGIN: High-grade intraepithelial neoplasias | ||
| LGIN: Low-grade intraepithelial neoplasias | ||
| GC | 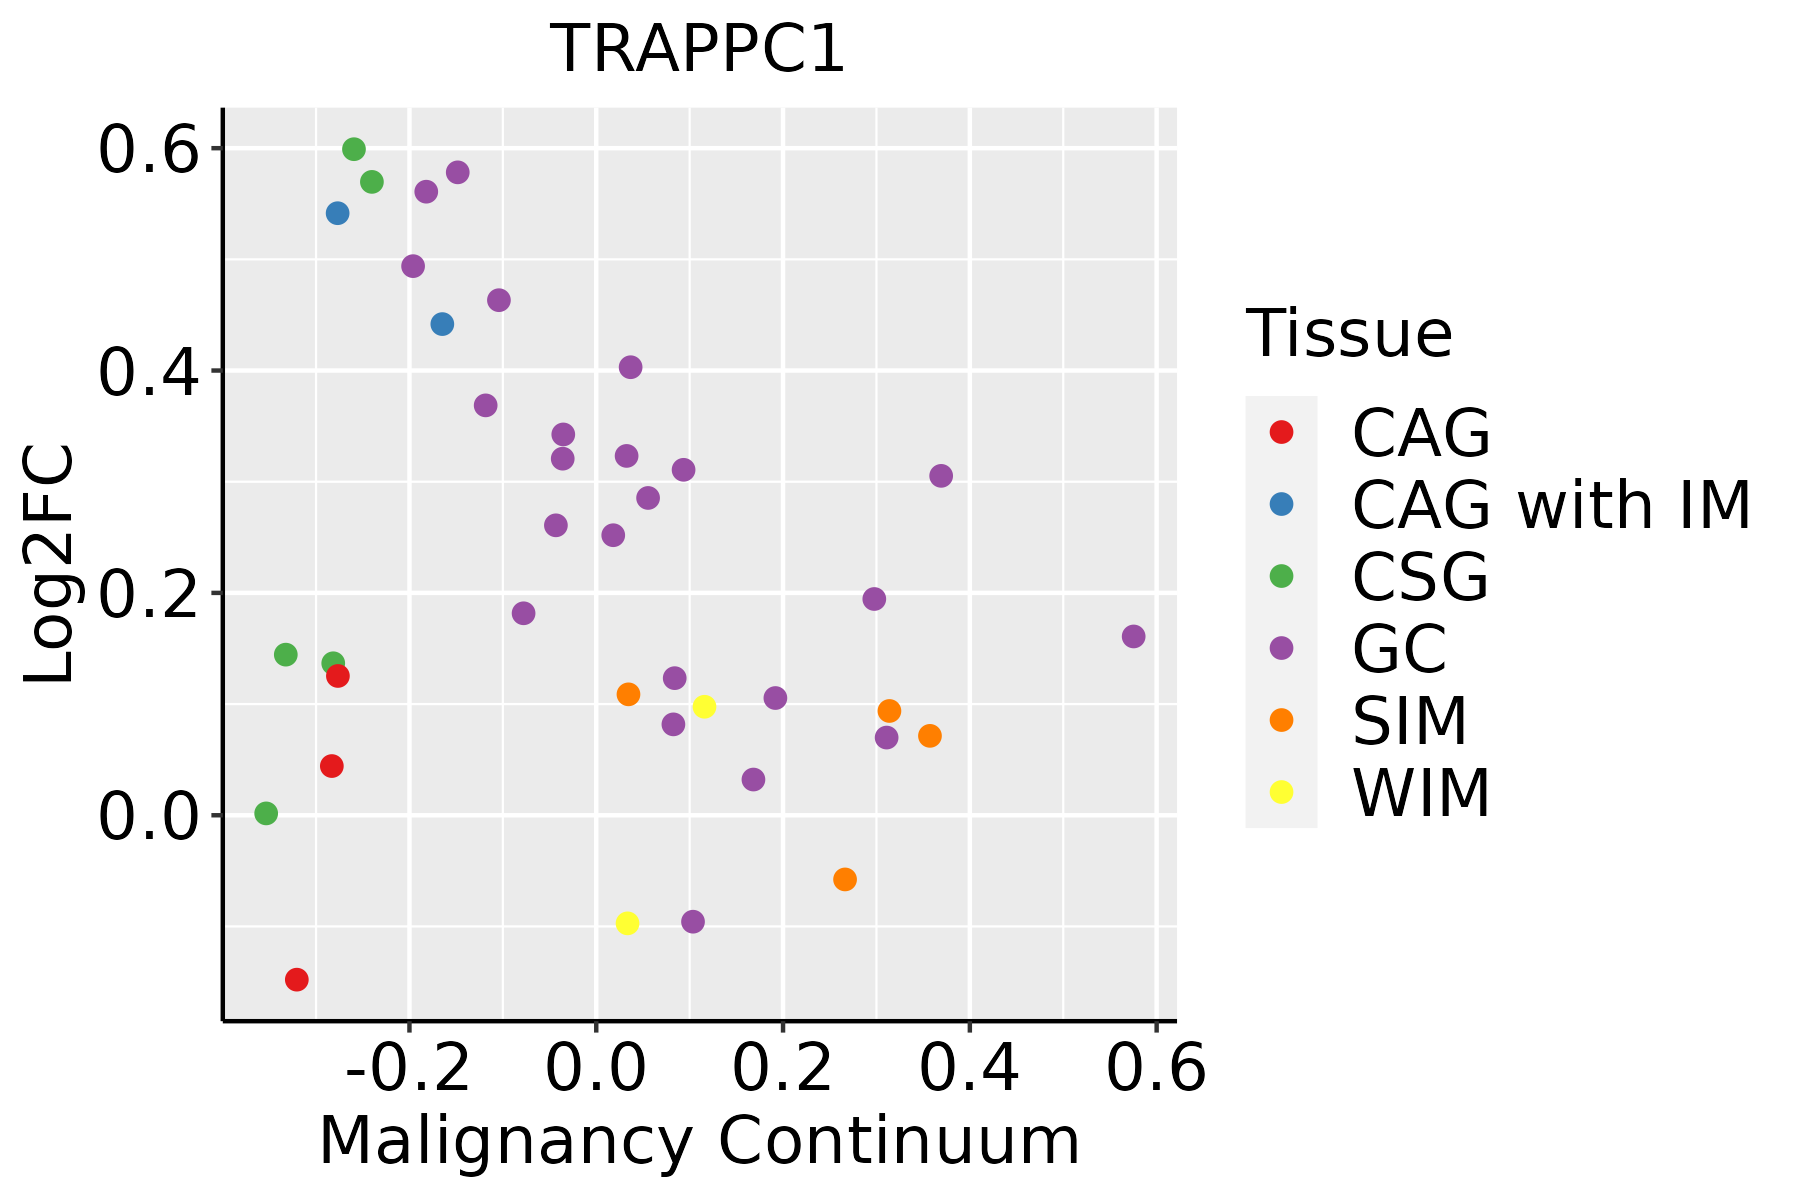 | CAG: Chronic atrophic gastritis |
| CAG with IM: Chronic atrophic gastritis with intestinal metaplasia | ||
| CSG: Chronic superficial gastritis | ||
| GC: Gastric cancer | ||
| SIM: Severe intestinal metaplasia | ||
| WIM: Wild intestinal metaplasia | ||
| Liver | 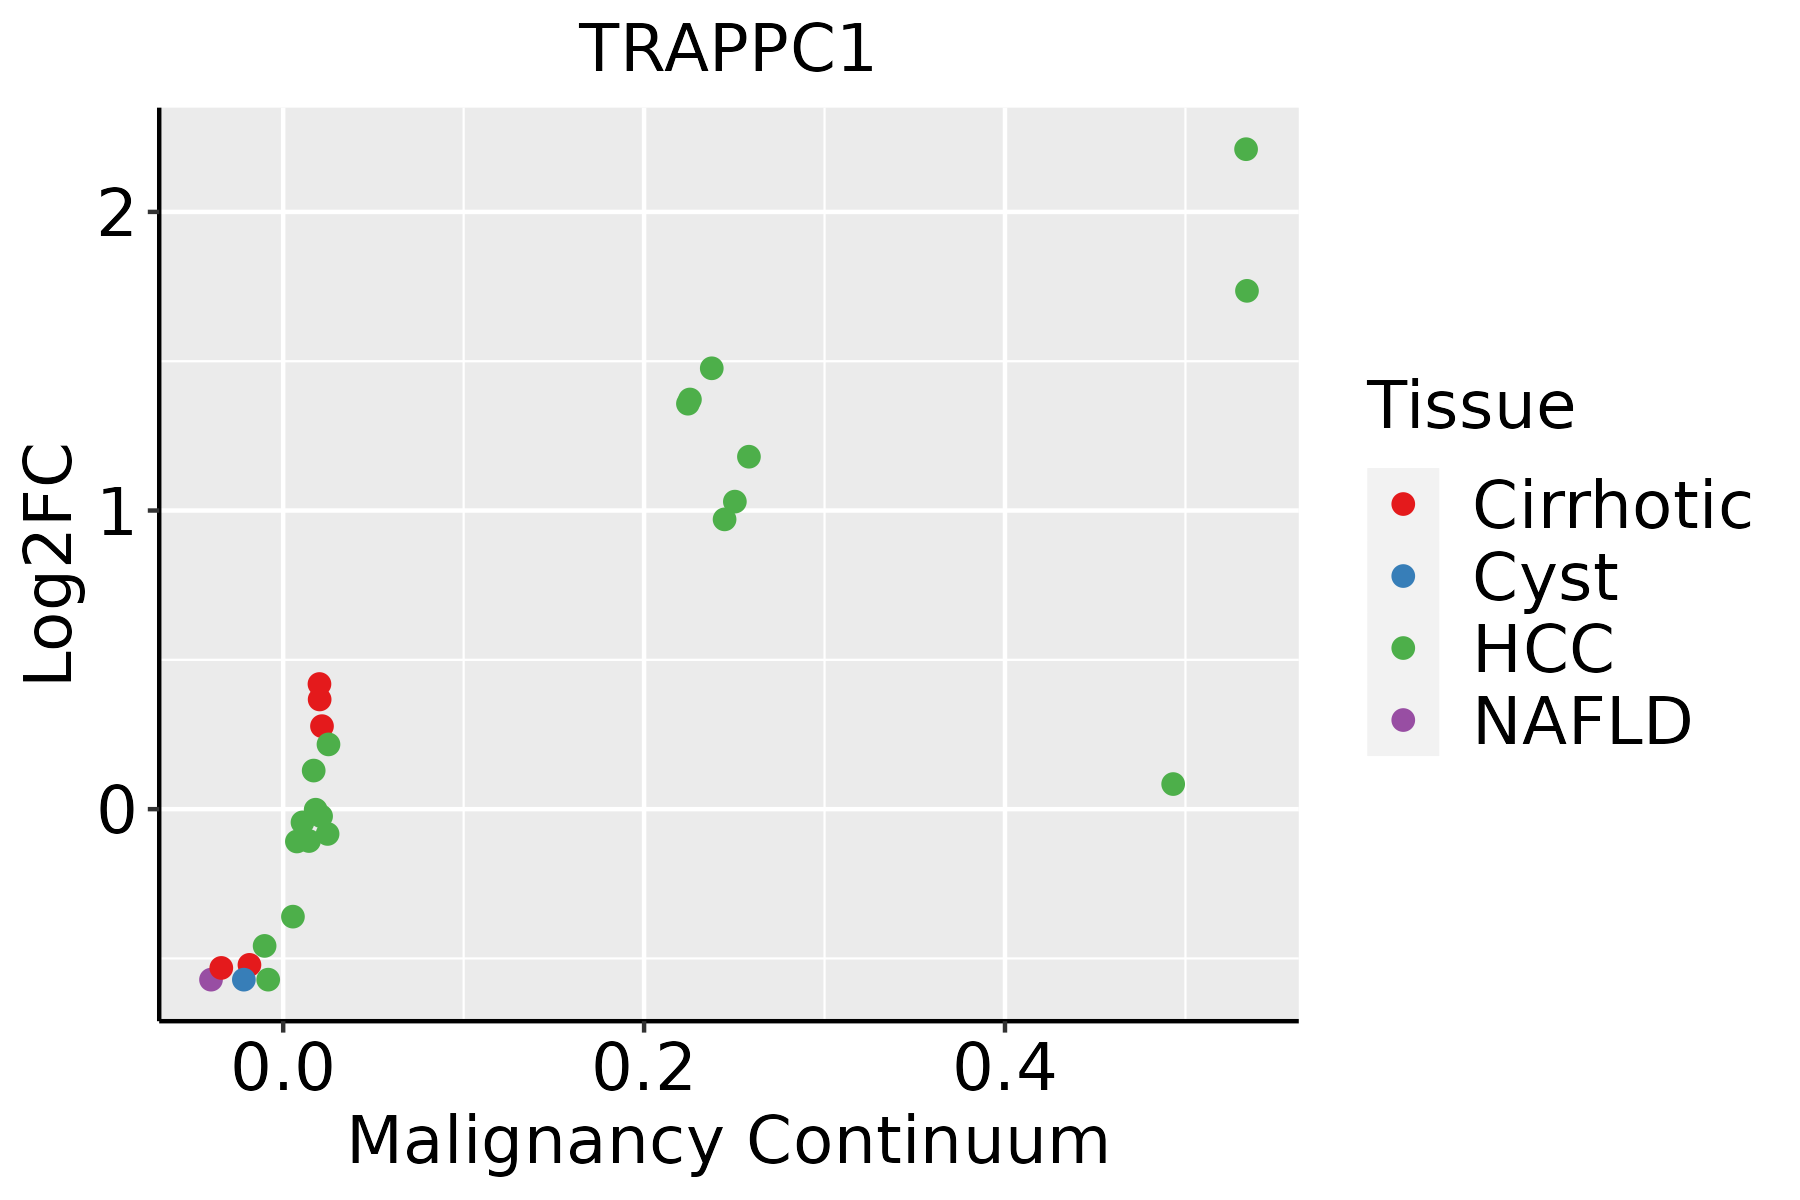 | HCC: Hepatocellular carcinoma |
| NAFLD: Non-alcoholic fatty liver disease | ||
| Oral Cavity |  | EOLP: Erosive Oral lichen planus |
| LP: leukoplakia | ||
| NEOLP: Non-erosive oral lichen planus | ||
| OSCC: Oral squamous cell carcinoma | ||
| Prostate | 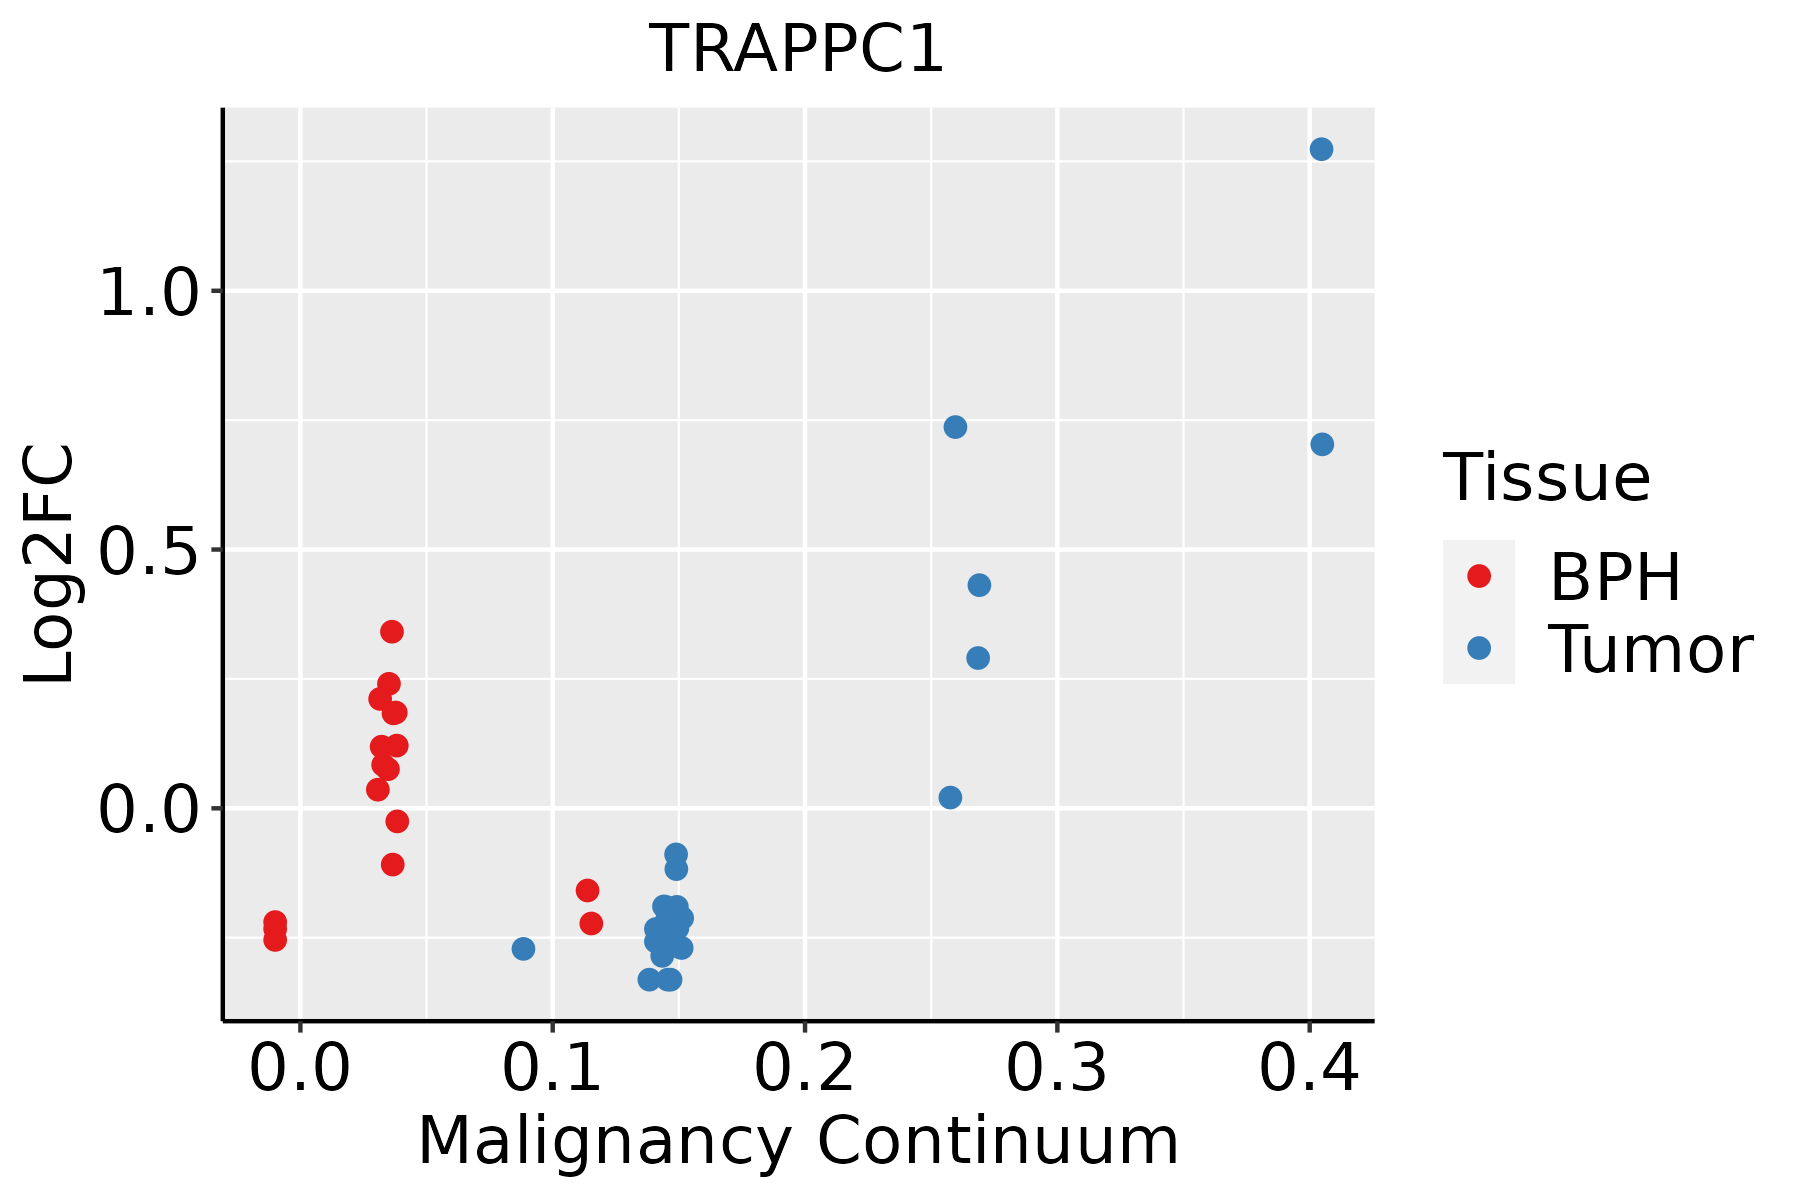 | BPH: Benign Prostatic Hyperplasia |
| Skin |  | AK: Actinic keratosis |
| cSCC: Cutaneous squamous cell carcinoma | ||
| SCCIS:squamous cell carcinoma in situ | ||
| Thyroid | 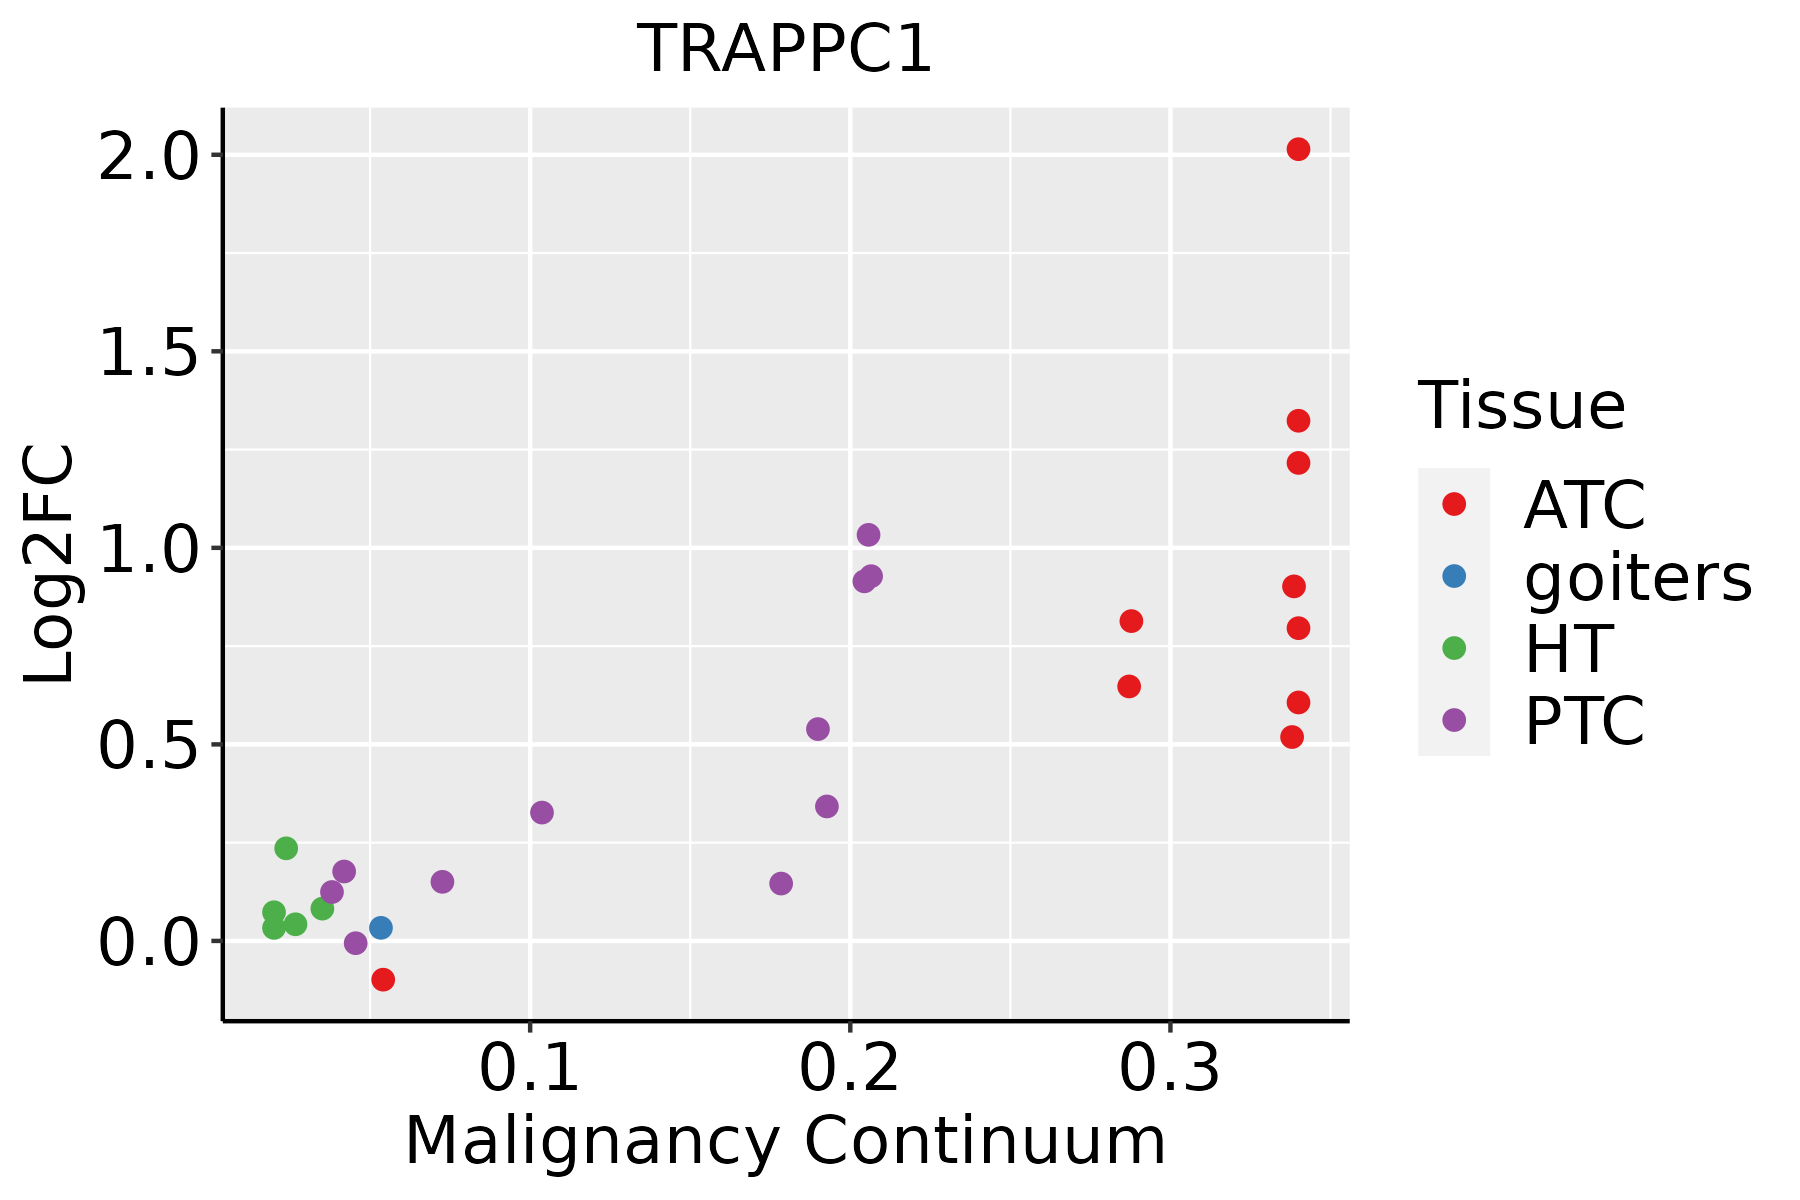 | ATC: Anaplastic thyroid cancer |
| HT: Hashimoto's thyroiditis | ||
| PTC: Papillary thyroid cancer |
| ∗log2FC in expression of this searched gene in stem-like cells from each diseased tissue sample relative to stem-like cells in normal samples in each tissue plotted against the malignancy continuum. Samples are colored based on if they are from different disease stage. |
Top |
Malignant transformation related pathway analysis |
| Find out the enriched GO biological processes and KEGG pathways involved in transition from healthy to precancer to cancer |
| Tissue | Disease Stage | Enriched GO biological Processes |
| Colorectum | AD |  |
| Colorectum | SER |  |
| Colorectum | MSS |  |
| Colorectum | MSI-H |  |
| Colorectum | FAP |  |
| ∗Top 15 enriched GO BP terms are showed in the bar plot of each disease state in each tissue. Each row represents a significant GO biological process which is colored according to the -log10(p.adjust). |
| Page: 1 2 3 4 5 6 7 8 9 |
| GO ID | Tissue | Disease Stage | Description | Gene Ratio | Bg Ratio | pvalue | p.adjust | Count |
| GO:009881312 | Thyroid | ATC | nuclear chromosome segregation | 145/6293 | 281/18723 | 3.06e-10 | 8.61e-09 | 145 |
| GO:001648218 | Thyroid | ATC | cytosolic transport | 93/6293 | 168/18723 | 5.19e-09 | 1.15e-07 | 93 |
| GO:005000013 | Thyroid | ATC | chromosome localization | 49/6293 | 82/18723 | 1.07e-06 | 1.39e-05 | 49 |
| GO:005130312 | Thyroid | ATC | establishment of chromosome localization | 47/6293 | 80/18723 | 3.44e-06 | 3.86e-05 | 47 |
| GO:005131012 | Thyroid | ATC | metaphase plate congression | 40/6293 | 65/18723 | 3.67e-06 | 4.08e-05 | 40 |
| GO:003450212 | Thyroid | ATC | protein localization to chromosome | 52/6293 | 92/18723 | 5.21e-06 | 5.61e-05 | 52 |
| GO:000703015 | Thyroid | ATC | Golgi organization | 79/6293 | 157/18723 | 1.07e-05 | 1.05e-04 | 79 |
| GO:00513833 | Thyroid | ATC | kinetochore organization | 18/6293 | 23/18723 | 1.47e-05 | 1.39e-04 | 18 |
| GO:190211522 | Thyroid | ATC | regulation of organelle assembly | 90/6293 | 186/18723 | 2.00e-05 | 1.81e-04 | 90 |
| GO:00513823 | Thyroid | ATC | kinetochore assembly | 15/6293 | 18/18723 | 2.06e-05 | 1.85e-04 | 15 |
| GO:004214715 | Thyroid | ATC | retrograde transport, endosome to Golgi | 49/6293 | 91/18723 | 5.48e-05 | 4.23e-04 | 49 |
| GO:00345083 | Thyroid | ATC | centromere complex assembly | 20/6293 | 30/18723 | 2.18e-04 | 1.43e-03 | 20 |
| GO:000689113 | Thyroid | ATC | intra-Golgi vesicle-mediated transport | 20/6293 | 33/18723 | 1.33e-03 | 6.96e-03 | 20 |
| GO:00718242 | Thyroid | ATC | protein-DNA complex subunit organization | 103/6293 | 241/18723 | 1.84e-03 | 9.03e-03 | 103 |
| Page: 1 2 3 4 5 6 7 8 |
| Pathway ID | Tissue | Disease Stage | Description | Gene Ratio | Bg Ratio | pvalue | p.adjust | qvalue | Count |
| Page: 1 |
Top |
Cell-cell communication analysis |
| Identification of potential cell-cell interactions between two cell types and their ligand-receptor pairs for different disease states |
| Ligand | Receptor | LRpair | Pathway | Tissue | Disease Stage |
| Page: 1 |
Top |
Single-cell gene regulatory network inference analysis |
| Find out the significant the regulons (TFs) and the target genes of each regulon across cell types for different disease states |
| TF | Cell Type | Tissue | Disease Stage | Target Gene | RSS | Regulon Activity |
| ∗The dot plots of a searched regulon are shown for all cell subpopulations in each disease state of each tissue based on the regulon specific score inferred using pySCENIC and by calculating the average expression. |
| Page: 1 |
Top |
Somatic mutation of malignant transformation related genes |
| Annotation of somatic variants for genes involved in malignant transformation |
| Hugo Symbol | Variant Class | Variant Classification | dbSNP RS | HGVSc | HGVSp | HGVSp Short | SWISSPROT | BIOTYPE | SIFT | PolyPhen | Tumor Sample Barcode | Tissue | Histology | Sex | Age | Stage | Therapy Types | Drugs | Outcome |
| TRAPPC1 | SNV | Missense_Mutation | c.140N>G | p.Ser47Trp | p.S47W | Q9Y5R8 | protein_coding | deleterious(0) | probably_damaging(0.993) | TCGA-AN-A0XW-01 | Breast | breast invasive carcinoma | Female | <65 | III/IV | Unknown | Unknown | SD | |
| TRAPPC1 | SNV | Missense_Mutation | c.386N>A | p.Arg129Gln | p.R129Q | Q9Y5R8 | protein_coding | tolerated(0.26) | benign(0.003) | TCGA-AQ-A1H2-01 | Breast | breast invasive carcinoma | Female | >=65 | III/IV | Chemotherapy | herceptin | SD | |
| TRAPPC1 | SNV | Missense_Mutation | rs148790381 | c.379N>T | p.Arg127Cys | p.R127C | Q9Y5R8 | protein_coding | deleterious(0.05) | possibly_damaging(0.74) | TCGA-EA-A3HS-01 | Cervix | cervical & endocervical cancer | Female | <65 | I/II | Unknown | Unknown | SD |
| TRAPPC1 | SNV | Missense_Mutation | c.427N>T | p.Arg143Trp | p.R143W | Q9Y5R8 | protein_coding | deleterious(0) | possibly_damaging(0.798) | TCGA-AZ-6598-01 | Colorectum | colon adenocarcinoma | Female | >=65 | I/II | Unknown | Unknown | SD | |
| TRAPPC1 | SNV | Missense_Mutation | c.5N>T | p.Thr2Ile | p.T2I | Q9Y5R8 | protein_coding | deleterious(0.01) | probably_damaging(0.934) | TCGA-AP-A059-01 | Endometrium | uterine corpus endometrioid carcinoma | Female | >=65 | I/II | Unknown | Unknown | SD | |
| TRAPPC1 | SNV | Missense_Mutation | novel | c.68N>A | p.Arg23His | p.R23H | Q9Y5R8 | protein_coding | deleterious(0) | possibly_damaging(0.486) | TCGA-AP-A1DV-01 | Endometrium | uterine corpus endometrioid carcinoma | Female | <65 | I/II | Unknown | Unknown | SD |
| TRAPPC1 | SNV | Missense_Mutation | c.314A>G | p.Tyr105Cys | p.Y105C | Q9Y5R8 | protein_coding | deleterious(0) | probably_damaging(0.999) | TCGA-B5-A0JY-01 | Endometrium | uterine corpus endometrioid carcinoma | Female | <65 | III/IV | Chemotherapy | doxorubicin | SD | |
| TRAPPC1 | SNV | Missense_Mutation | c.72N>T | p.Lys24Asn | p.K24N | Q9Y5R8 | protein_coding | tolerated(0.5) | benign(0.153) | TCGA-BS-A0UF-01 | Endometrium | uterine corpus endometrioid carcinoma | Female | >=65 | I/II | Unknown | Unknown | SD | |
| TRAPPC1 | SNV | Missense_Mutation | c.227C>T | p.Thr76Met | p.T76M | Q9Y5R8 | protein_coding | deleterious(0) | probably_damaging(0.994) | TCGA-97-8171-01 | Lung | lung adenocarcinoma | Male | >=65 | III/IV | Targeted Molecular therapy | tarceva | PD | |
| TRAPPC1 | SNV | Missense_Mutation | c.347N>T | p.Pro116Leu | p.P116L | Q9Y5R8 | protein_coding | tolerated(0.27) | benign(0.052) | TCGA-BR-8078-01 | Stomach | stomach adenocarcinoma | Female | >=65 | I/II | Unknown | Unknown | SD |
| Page: 1 2 |
Top |
Related drugs of malignant transformation related genes |
| Identification of chemicals and drugs interact with genes involved in malignant transfromation |
| (DGIdb 4.0) |
| Entrez ID | Symbol | Category | Interaction Types | Drug Claim Name | Drug Name | PMIDs |
| Page: 1 |

Copyright 2023-Present -The University of Texas Health Science Center at Houston |