
|
|||||
|
 | |
| |
| |
| |
| |
| |
|
Gene: TOMM7 |
Gene summary for TOMM7 |
| Gene information | Species | Human | Gene symbol | TOMM7 | Gene ID | 54543 |
| Gene name | translocase of outer mitochondrial membrane 7 | |
| Gene Alias | TOM7 | |
| Cytomap | 7p15.3 | |
| Gene Type | protein-coding | GO ID | GO:0000422 | UniProtAcc | Q75MR5 |
Top |
Malignant transformation analysis |
| Identification of the aberrant gene expression in precancerous and cancerous lesions by comparing the gene expression of stem-like cells in diseased tissues with normal stem cells |
| Entrez ID | Symbol | Replicates | Species | Organ | Tissue | Adj P-value | Log2FC | Malignancy |
| 54543 | TOMM7 | GSM4909280 | Human | Breast | Precancer | 1.98e-02 | -1.06e-01 | 0.0305 |
| 54543 | TOMM7 | GSM4909281 | Human | Breast | IDC | 6.03e-05 | -1.71e-01 | 0.21 |
| 54543 | TOMM7 | GSM4909286 | Human | Breast | IDC | 2.61e-08 | -4.85e-03 | 0.1081 |
| 54543 | TOMM7 | GSM4909288 | Human | Breast | IDC | 1.82e-02 | -1.13e-01 | 0.0988 |
| 54543 | TOMM7 | GSM4909291 | Human | Breast | IDC | 5.60e-04 | 2.23e-01 | 0.1753 |
| 54543 | TOMM7 | GSM4909293 | Human | Breast | IDC | 2.44e-06 | -3.47e-02 | 0.1581 |
| 54543 | TOMM7 | GSM4909294 | Human | Breast | IDC | 1.58e-06 | -6.74e-02 | 0.2022 |
| 54543 | TOMM7 | GSM4909296 | Human | Breast | IDC | 7.18e-10 | 1.80e-01 | 0.1524 |
| 54543 | TOMM7 | GSM4909297 | Human | Breast | IDC | 2.22e-23 | -7.13e-02 | 0.1517 |
| 54543 | TOMM7 | GSM4909298 | Human | Breast | IDC | 1.36e-07 | 2.95e-01 | 0.1551 |
| 54543 | TOMM7 | GSM4909299 | Human | Breast | IDC | 2.59e-18 | 4.04e-01 | 0.035 |
| 54543 | TOMM7 | GSM4909302 | Human | Breast | IDC | 1.14e-21 | 2.43e-01 | 0.1545 |
| 54543 | TOMM7 | GSM4909308 | Human | Breast | IDC | 1.13e-04 | -1.91e-01 | 0.158 |
| 54543 | TOMM7 | GSM4909309 | Human | Breast | IDC | 2.55e-05 | 4.64e-02 | 0.0483 |
| 54543 | TOMM7 | GSM4909311 | Human | Breast | IDC | 5.42e-50 | -2.16e-01 | 0.1534 |
| 54543 | TOMM7 | GSM4909312 | Human | Breast | IDC | 3.05e-07 | -1.91e-01 | 0.1552 |
| 54543 | TOMM7 | GSM4909313 | Human | Breast | IDC | 4.25e-05 | 9.31e-02 | 0.0391 |
| 54543 | TOMM7 | GSM4909315 | Human | Breast | IDC | 7.84e-04 | 1.12e-01 | 0.21 |
| 54543 | TOMM7 | GSM4909316 | Human | Breast | IDC | 2.57e-02 | 2.16e-01 | 0.21 |
| 54543 | TOMM7 | GSM4909319 | Human | Breast | IDC | 1.35e-65 | -2.21e-01 | 0.1563 |
| Page: 1 2 3 4 5 6 7 8 9 10 11 12 13 14 15 16 17 18 |
| Tissue | Expression Dynamics | Abbreviation |
| Breast | 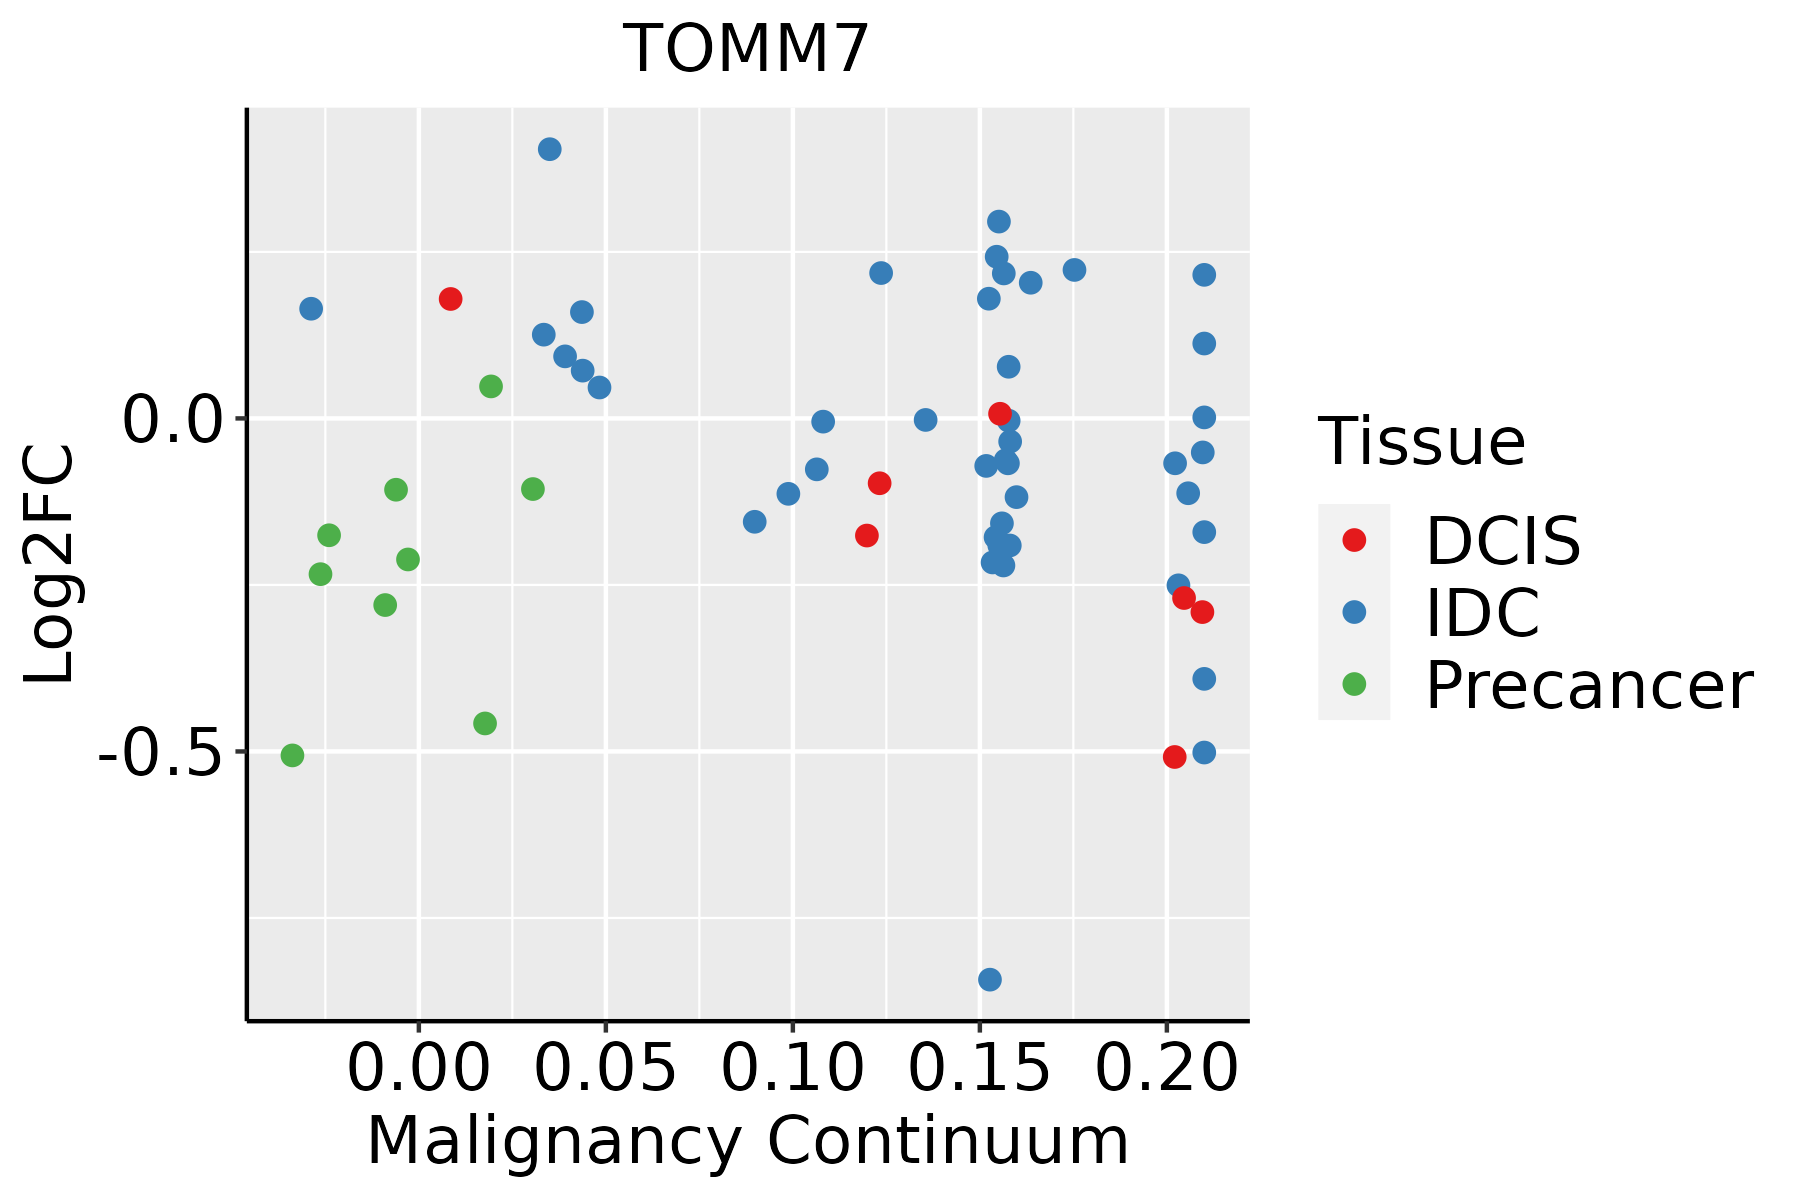 | IDC: Invasive ductal carcinoma |
| DCIS: Ductal carcinoma in situ | ||
| Precancer(BRCA1-mut): Precancerous lesion from BRCA1 mutation carriers | ||
| Cervix | 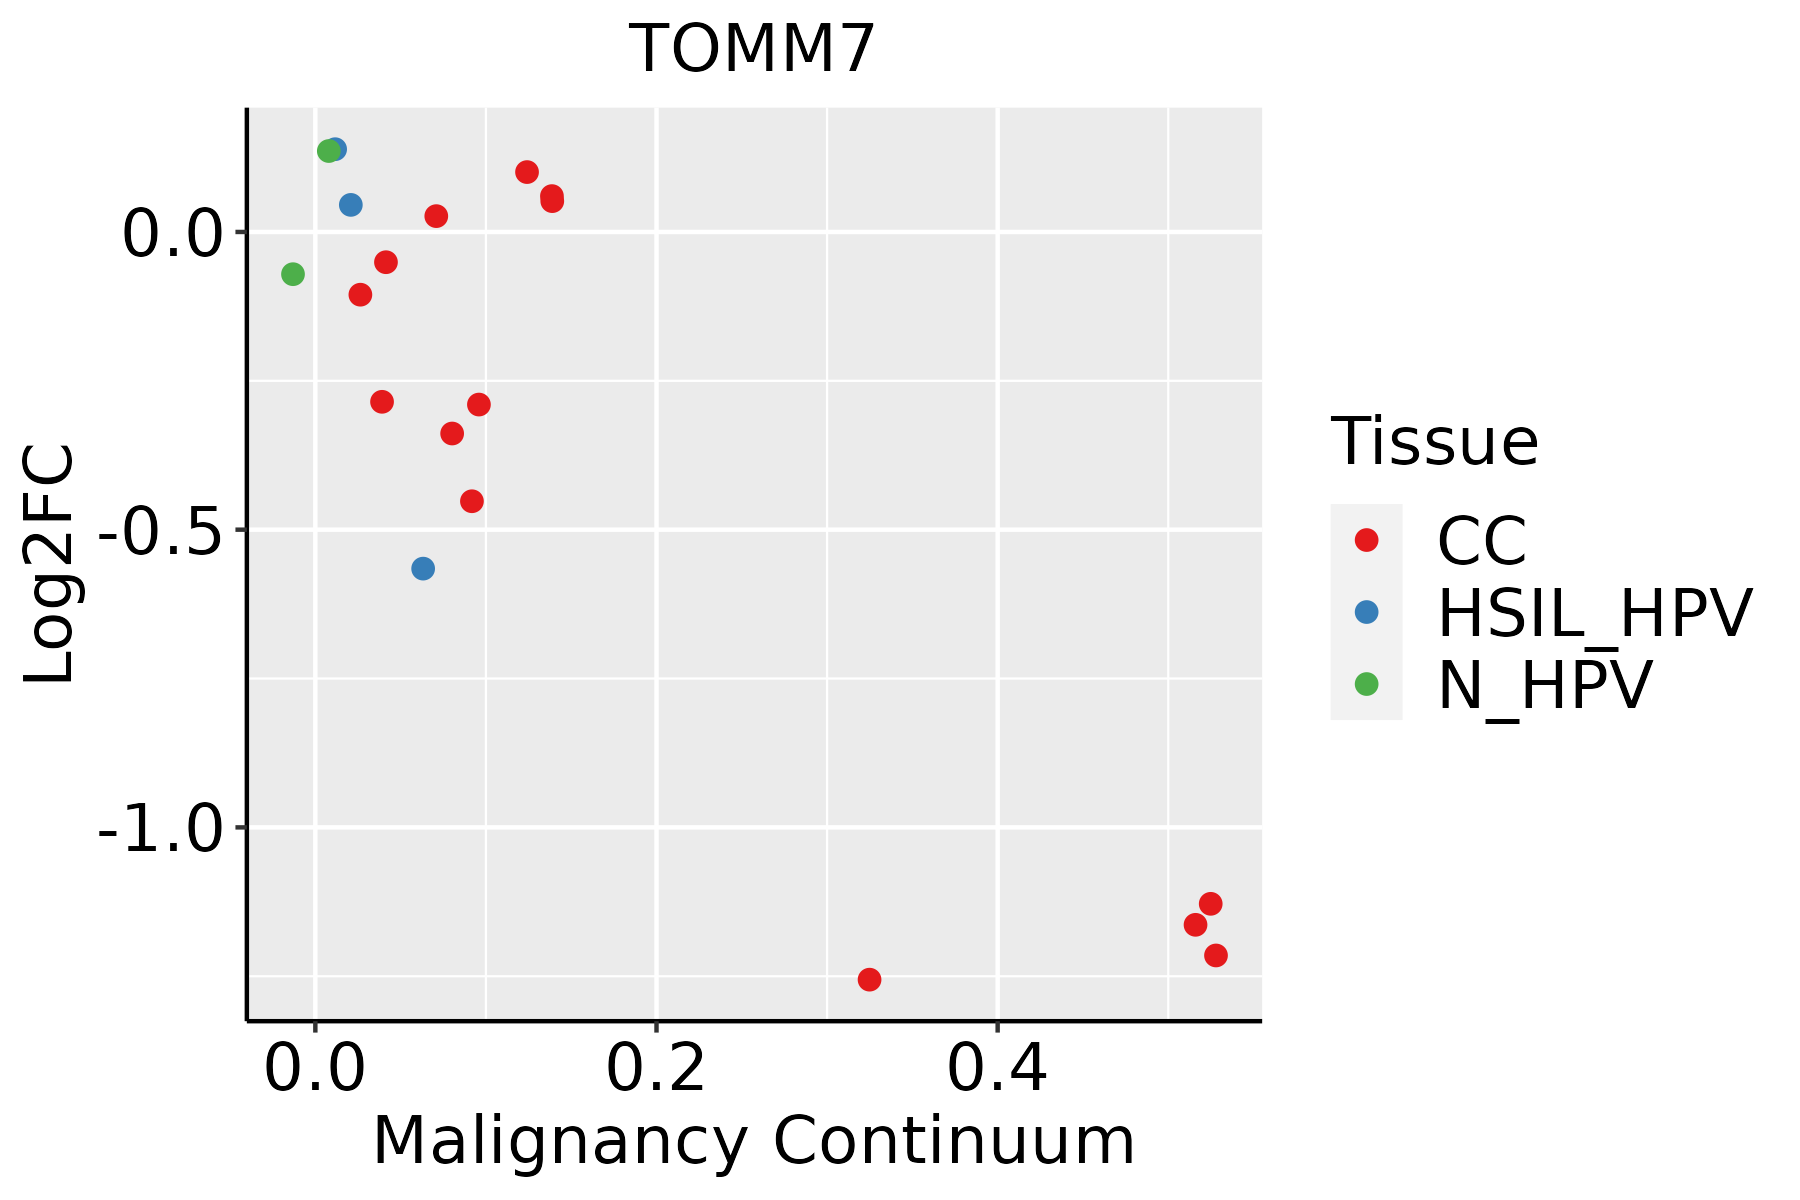 | CC: Cervix cancer |
| HSIL_HPV: HPV-infected high-grade squamous intraepithelial lesions | ||
| N_HPV: HPV-infected normal cervix | ||
| Colorectum (GSE201348) |  | FAP: Familial adenomatous polyposis |
| CRC: Colorectal cancer | ||
| Colorectum (HTA11) |  | AD: Adenomas |
| SER: Sessile serrated lesions | ||
| MSI-H: Microsatellite-high colorectal cancer | ||
| MSS: Microsatellite stable colorectal cancer | ||
| Endometrium | 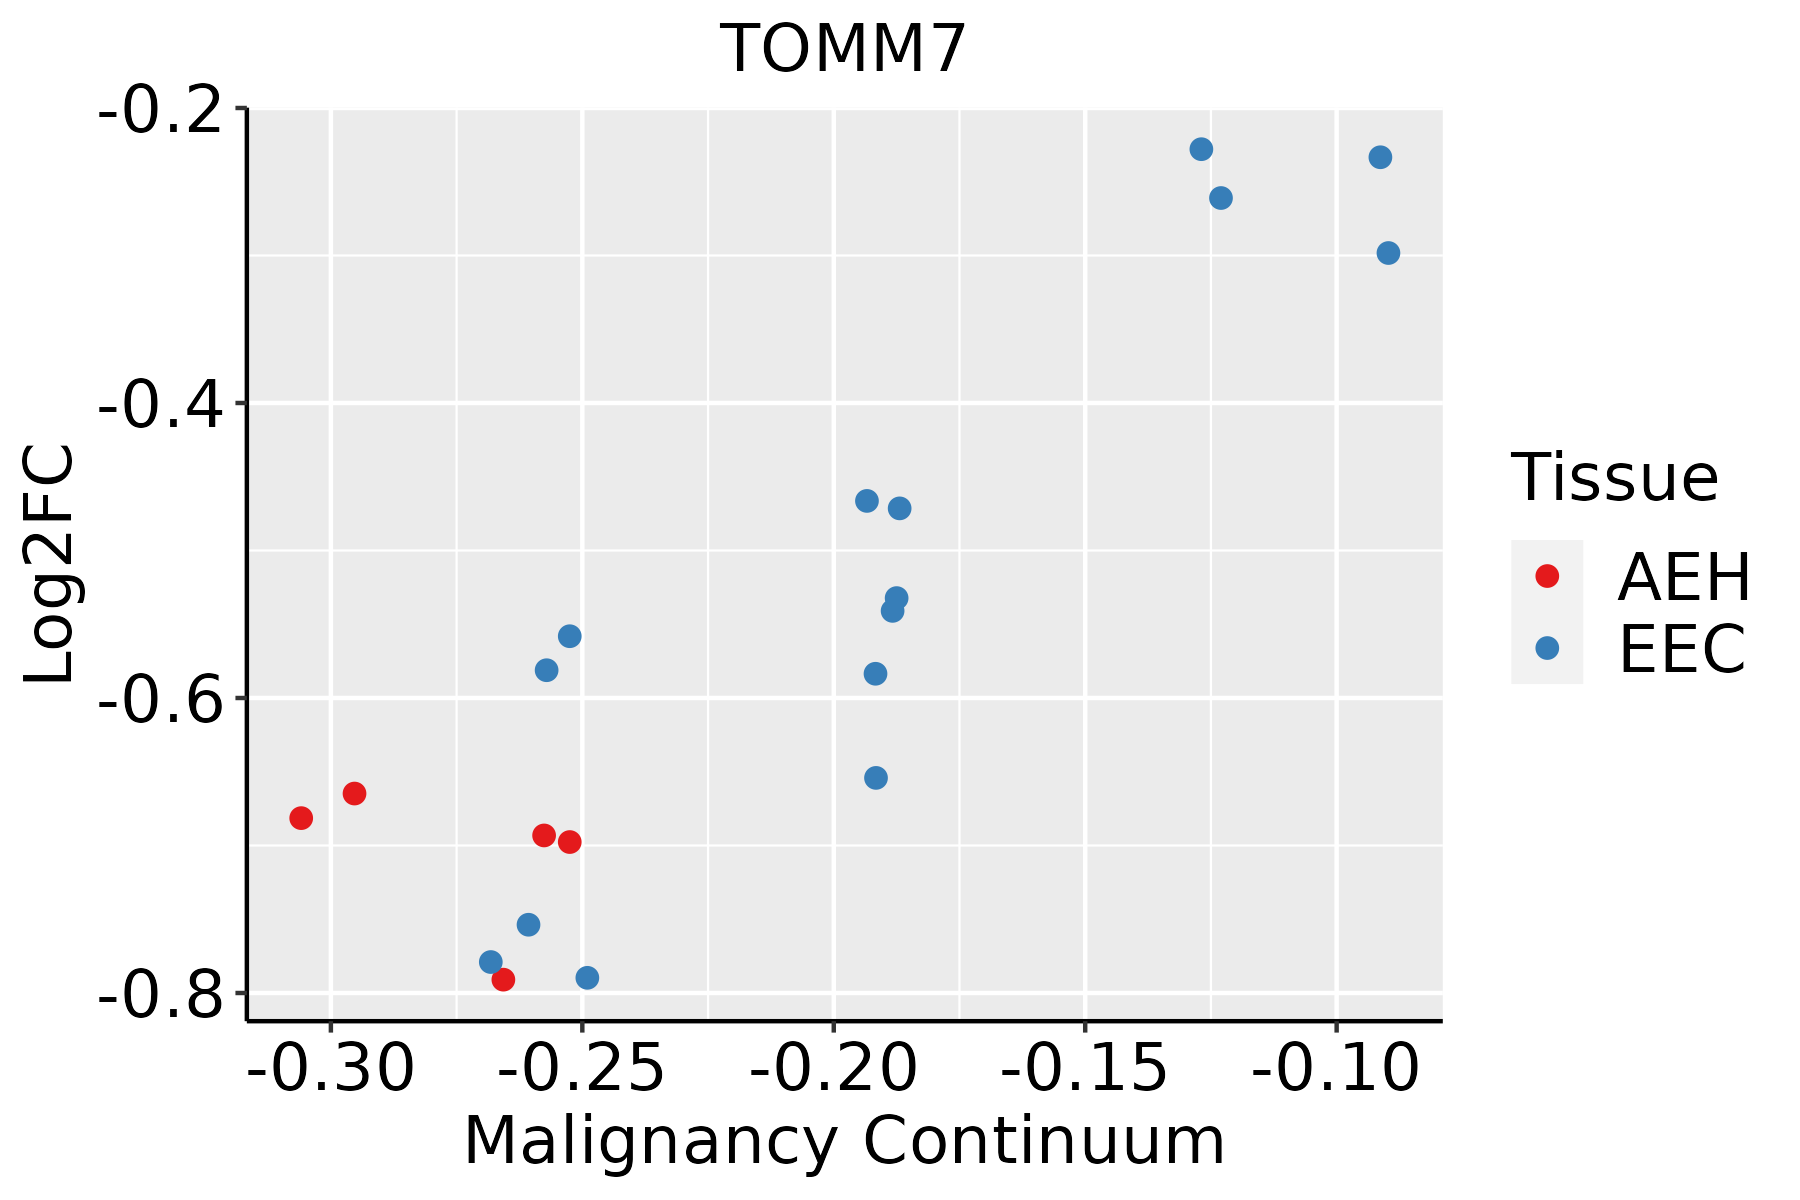 | AEH: Atypical endometrial hyperplasia |
| EEC: Endometrioid Cancer | ||
| Esophagus | 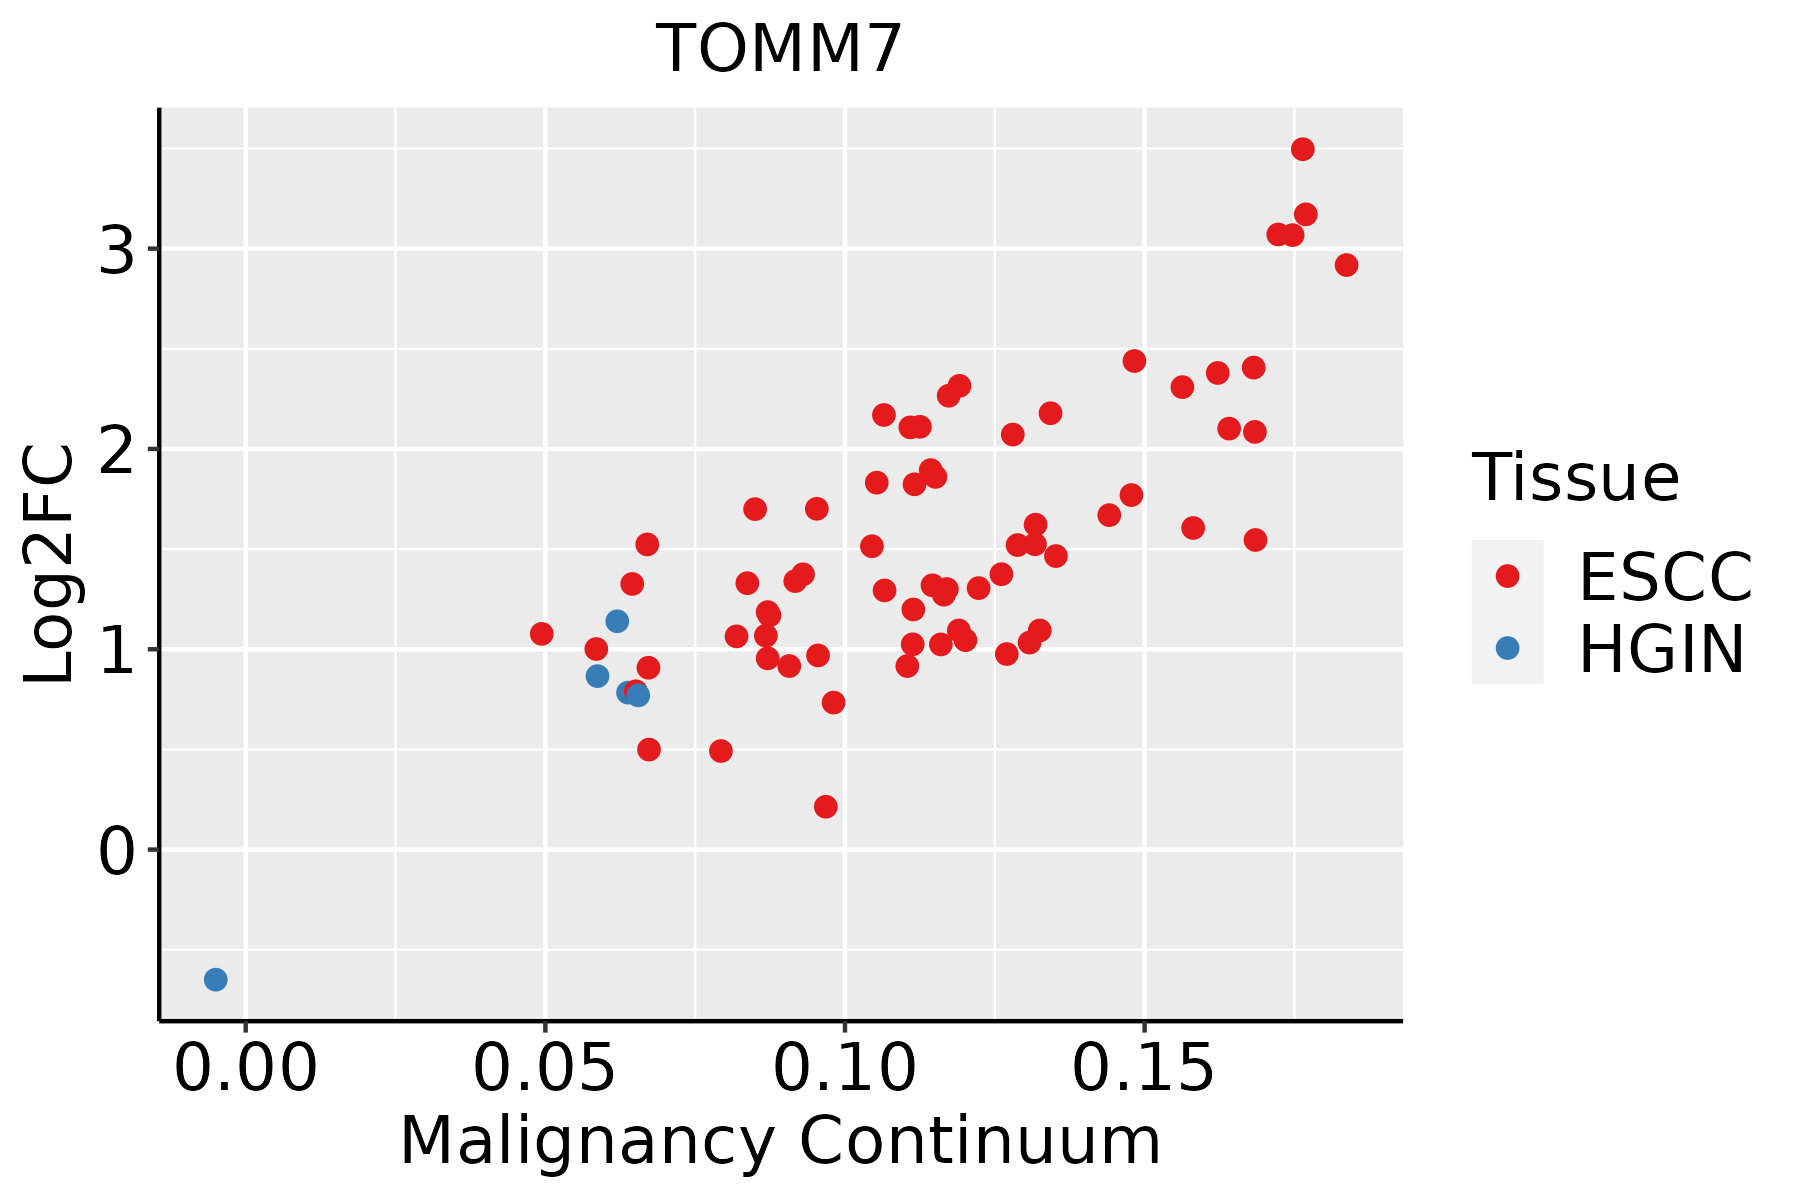 | ESCC: Esophageal squamous cell carcinoma |
| HGIN: High-grade intraepithelial neoplasias | ||
| LGIN: Low-grade intraepithelial neoplasias | ||
| GC | 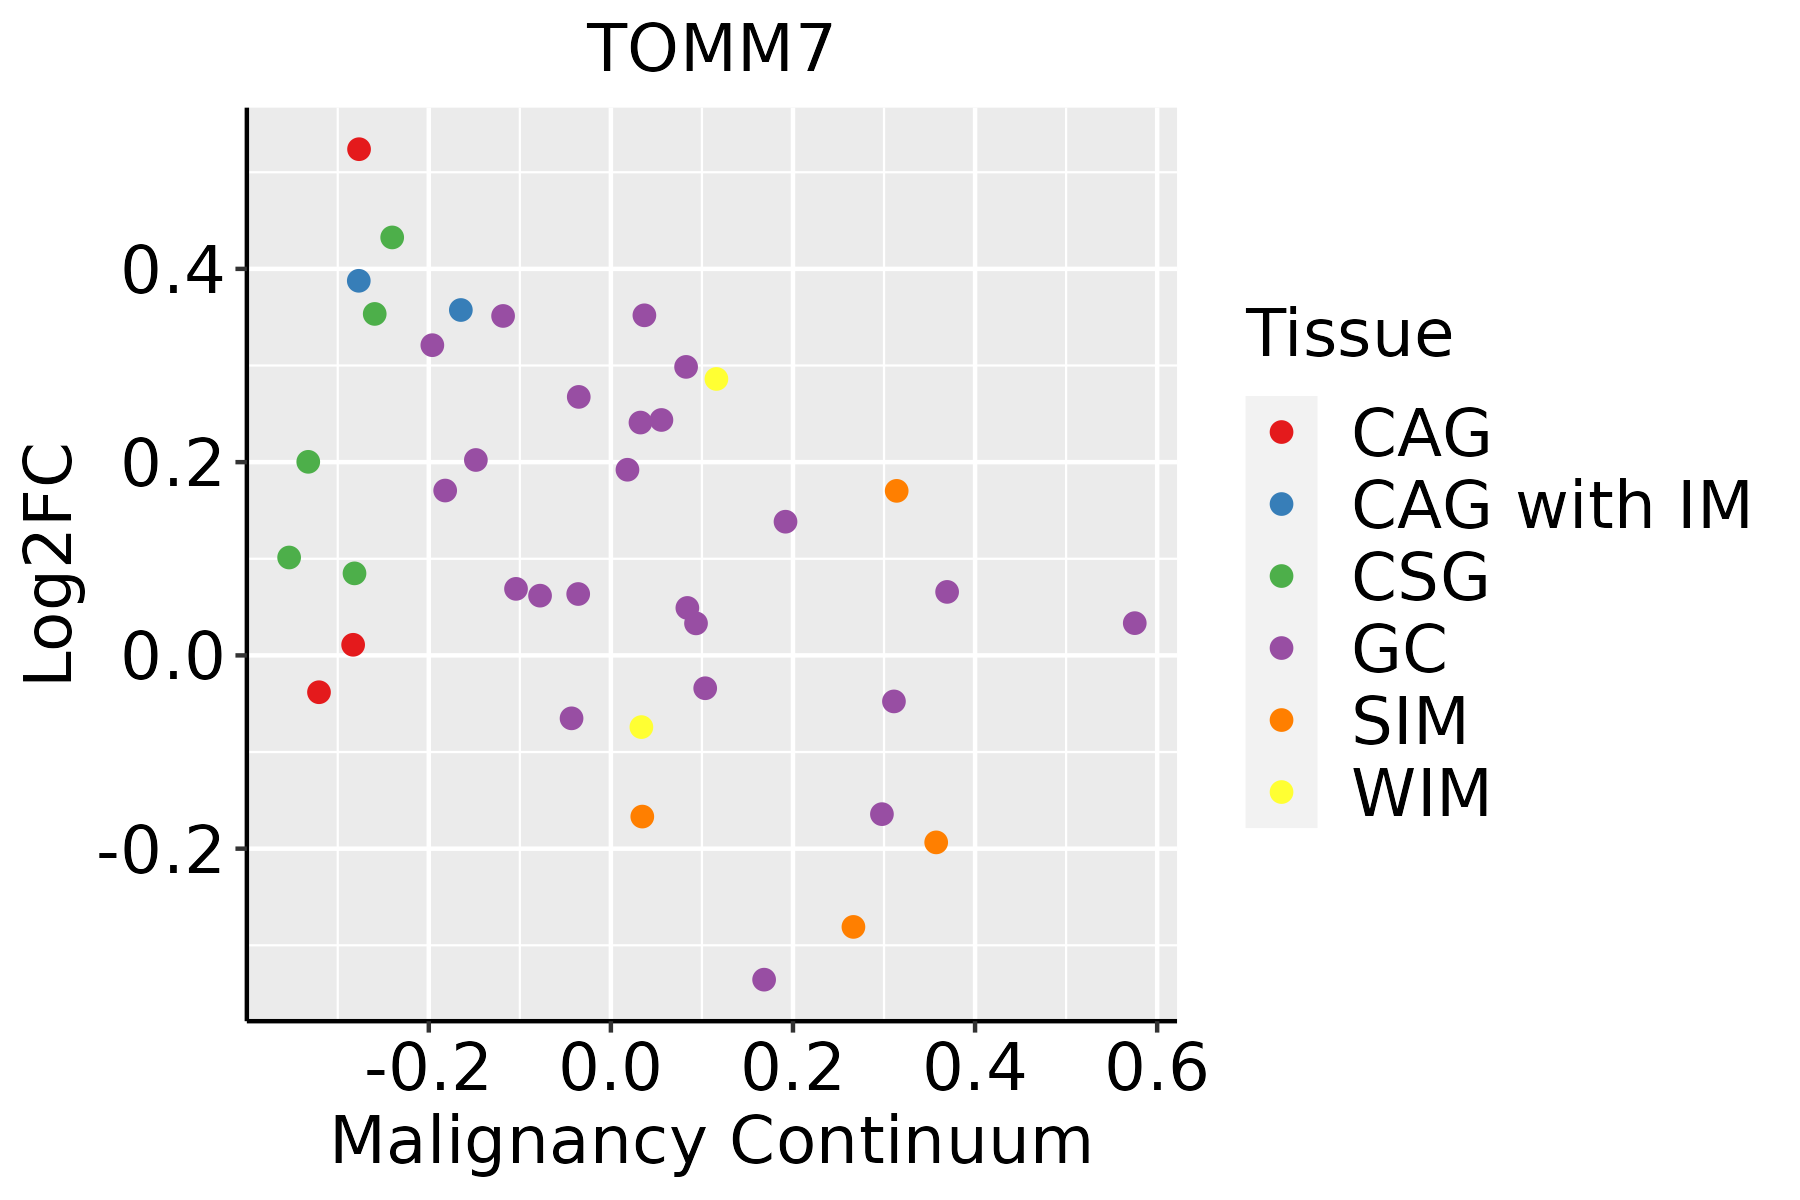 | CAG: Chronic atrophic gastritis |
| CAG with IM: Chronic atrophic gastritis with intestinal metaplasia | ||
| CSG: Chronic superficial gastritis | ||
| GC: Gastric cancer | ||
| SIM: Severe intestinal metaplasia | ||
| WIM: Wild intestinal metaplasia | ||
| Liver | 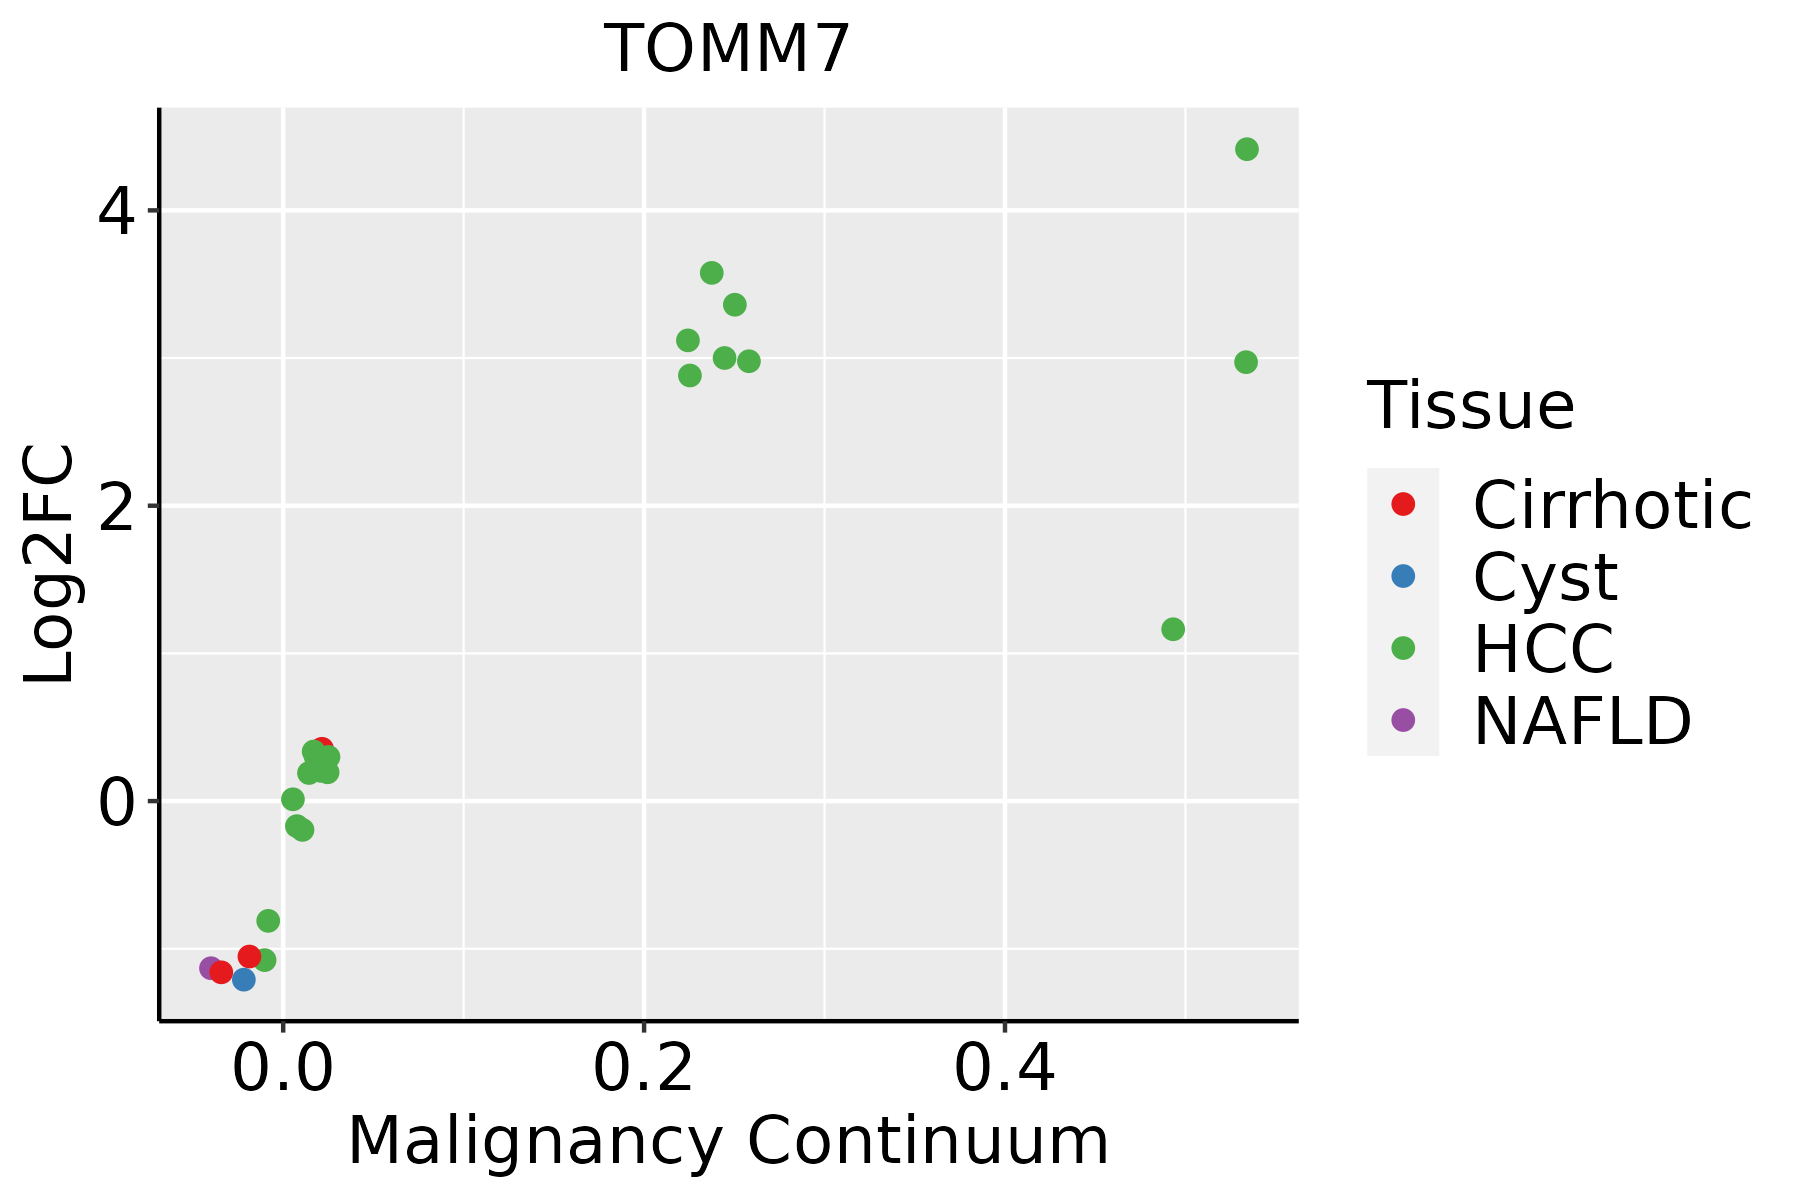 | HCC: Hepatocellular carcinoma |
| NAFLD: Non-alcoholic fatty liver disease | ||
| Lung |  | AAH: Atypical adenomatous hyperplasia |
| AIS: Adenocarcinoma in situ | ||
| IAC: Invasive lung adenocarcinoma | ||
| MIA: Minimally invasive adenocarcinoma | ||
| Oral Cavity |  | EOLP: Erosive Oral lichen planus |
| LP: leukoplakia | ||
| NEOLP: Non-erosive oral lichen planus | ||
| OSCC: Oral squamous cell carcinoma | ||
| Prostate | 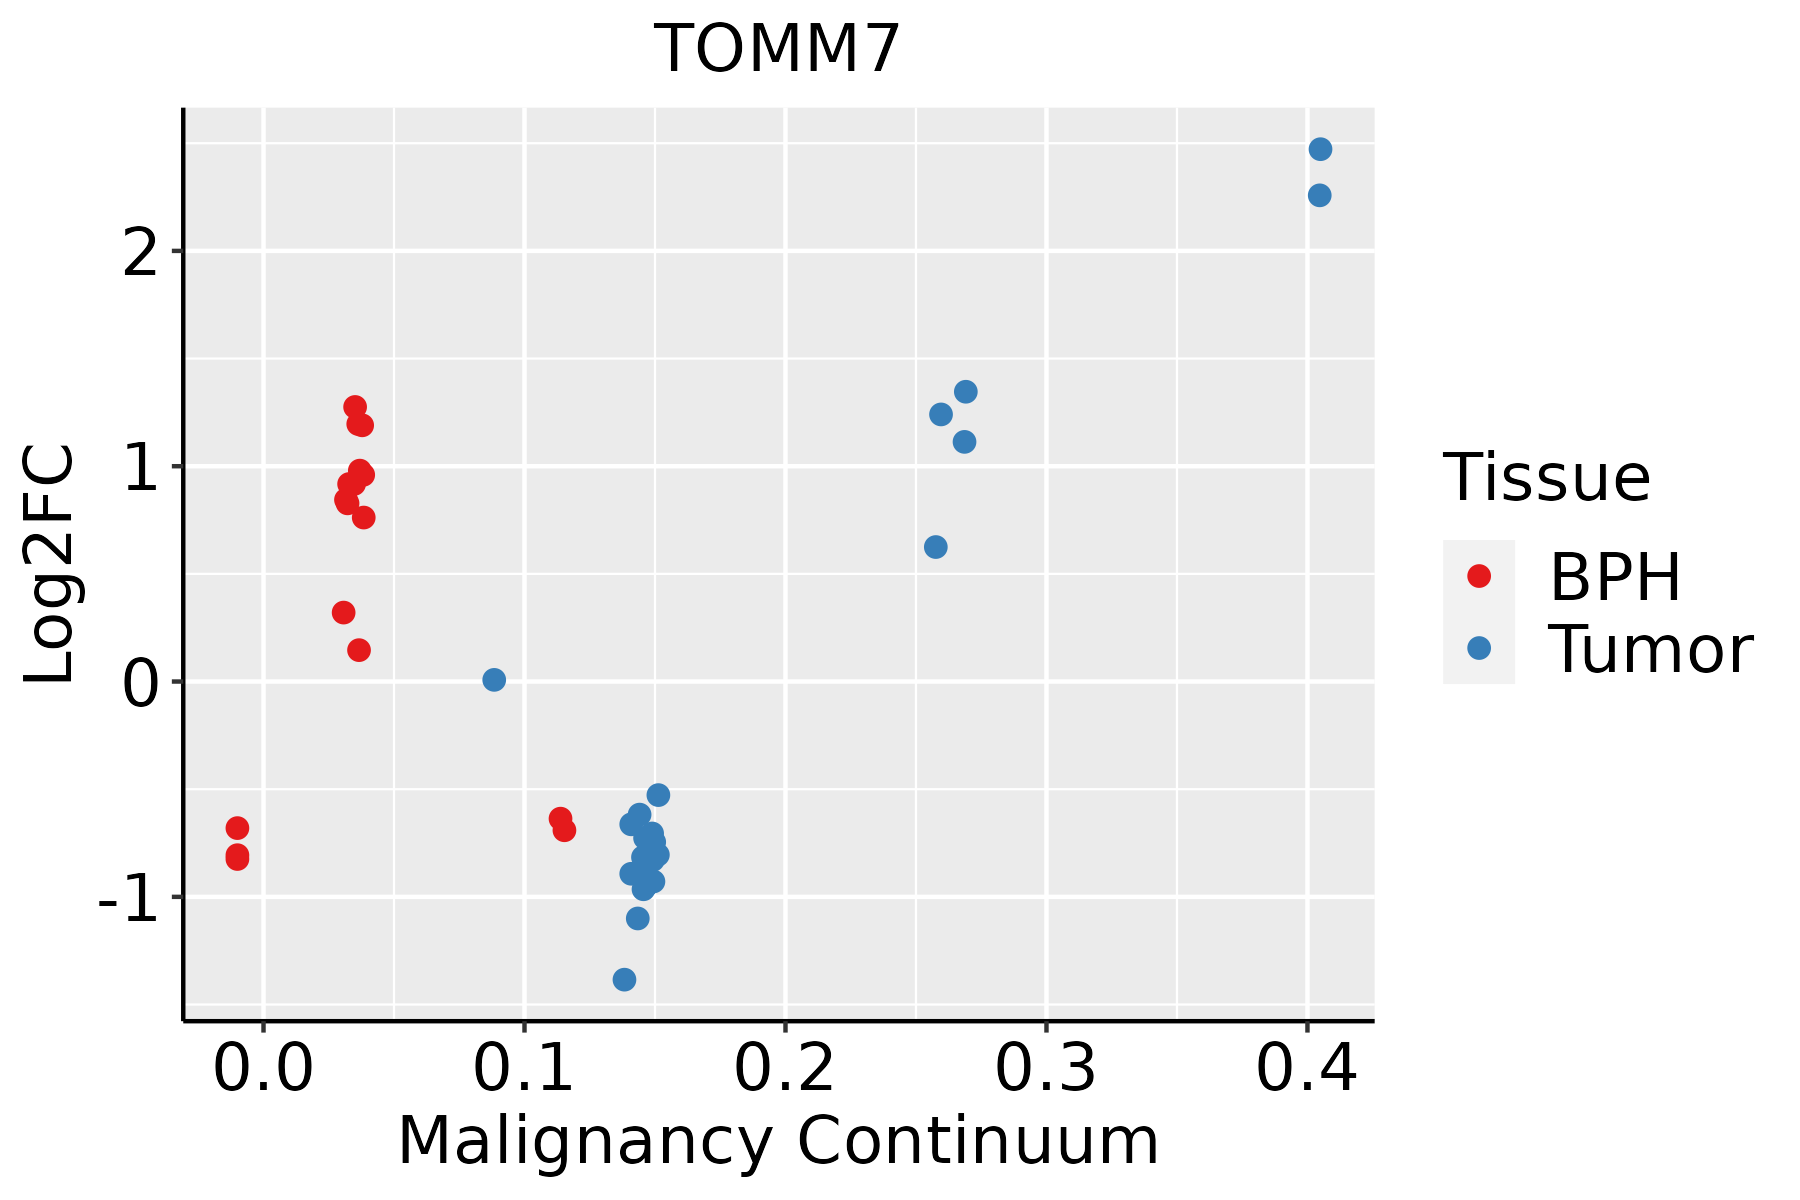 | BPH: Benign Prostatic Hyperplasia |
| Skin | 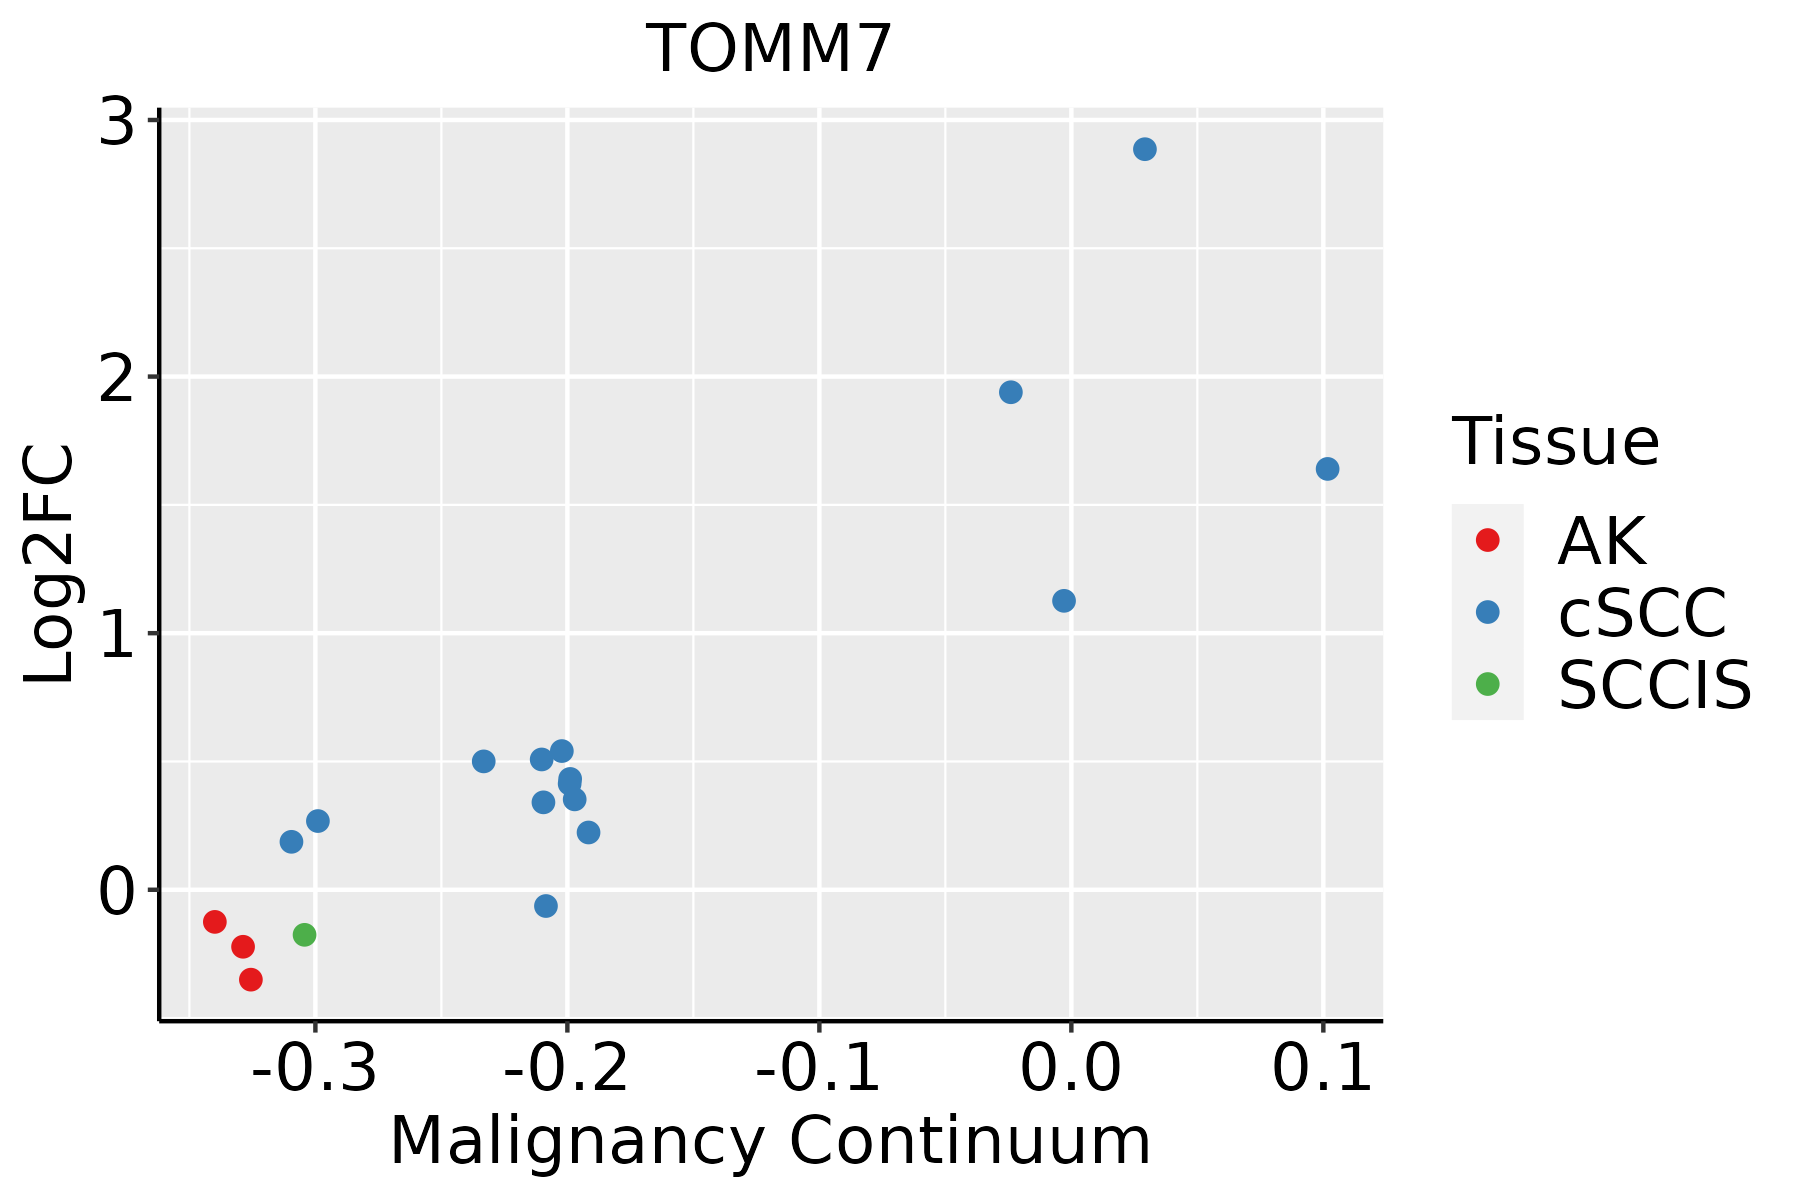 | AK: Actinic keratosis |
| cSCC: Cutaneous squamous cell carcinoma | ||
| SCCIS:squamous cell carcinoma in situ | ||
| Thyroid |  | ATC: Anaplastic thyroid cancer |
| HT: Hashimoto's thyroiditis | ||
| PTC: Papillary thyroid cancer |
| ∗log2FC in expression of this searched gene in stem-like cells from each diseased tissue sample relative to stem-like cells in normal samples in each tissue plotted against the malignancy continuum. Samples are colored based on if they are from different disease stage. |
Top |
Malignant transformation related pathway analysis |
| Find out the enriched GO biological processes and KEGG pathways involved in transition from healthy to precancer to cancer |
| Tissue | Disease Stage | Enriched GO biological Processes |
| Colorectum | AD |  |
| Colorectum | SER |  |
| Colorectum | MSS |  |
| Colorectum | MSI-H |  |
| Colorectum | FAP |  |
| ∗Top 15 enriched GO BP terms are showed in the bar plot of each disease state in each tissue. Each row represents a significant GO biological process which is colored according to the -log10(p.adjust). |
| Page: 1 2 3 4 5 6 7 8 9 |
| GO ID | Tissue | Disease Stage | Description | Gene Ratio | Bg Ratio | pvalue | p.adjust | Count |
| GO:00316471 | Colorectum | SER | regulation of protein stability | 86/2897 | 298/18723 | 2.56e-09 | 2.42e-07 | 86 |
| GO:00725941 | Colorectum | SER | establishment of protein localization to organelle | 111/2897 | 422/18723 | 4.98e-09 | 4.49e-07 | 111 |
| GO:00224111 | Colorectum | SER | cellular component disassembly | 114/2897 | 443/18723 | 1.17e-08 | 9.59e-07 | 114 |
| GO:00512221 | Colorectum | SER | positive regulation of protein transport | 85/2897 | 303/18723 | 1.36e-08 | 1.05e-06 | 85 |
| GO:00331571 | Colorectum | SER | regulation of intracellular protein transport | 68/2897 | 229/18723 | 3.41e-08 | 2.30e-06 | 68 |
| GO:00903161 | Colorectum | SER | positive regulation of intracellular protein transport | 52/2897 | 160/18723 | 5.64e-08 | 3.72e-06 | 52 |
| GO:00323861 | Colorectum | SER | regulation of intracellular transport | 89/2897 | 337/18723 | 1.34e-07 | 7.96e-06 | 89 |
| GO:00162361 | Colorectum | SER | macroautophagy | 79/2897 | 291/18723 | 1.97e-07 | 1.10e-05 | 79 |
| GO:00705851 | Colorectum | SER | protein localization to mitochondrion | 42/2897 | 125/18723 | 3.75e-07 | 1.98e-05 | 42 |
| GO:00323881 | Colorectum | SER | positive regulation of intracellular transport | 59/2897 | 202/18723 | 4.98e-07 | 2.48e-05 | 59 |
| GO:00004221 | Colorectum | SER | autophagy of mitochondrion | 29/2897 | 81/18723 | 5.61e-06 | 2.01e-04 | 29 |
| GO:00617261 | Colorectum | SER | mitochondrion disassembly | 29/2897 | 81/18723 | 5.61e-06 | 2.01e-04 | 29 |
| GO:00726551 | Colorectum | SER | establishment of protein localization to mitochondrion | 38/2897 | 120/18723 | 6.60e-06 | 2.33e-04 | 38 |
| GO:19030081 | Colorectum | SER | organelle disassembly | 36/2897 | 114/18723 | 1.22e-05 | 3.89e-04 | 36 |
| GO:00066051 | Colorectum | SER | protein targeting | 76/2897 | 314/18723 | 3.19e-05 | 8.47e-04 | 76 |
| GO:00619121 | Colorectum | SER | selective autophagy | 24/2897 | 68/18723 | 4.60e-05 | 1.15e-03 | 24 |
| GO:00066261 | Colorectum | SER | protein targeting to mitochondrion | 31/2897 | 100/18723 | 7.09e-05 | 1.61e-03 | 31 |
| GO:19037471 | Colorectum | SER | regulation of establishment of protein localization to mitochondrion | 18/2897 | 50/18723 | 3.00e-04 | 4.90e-03 | 18 |
| GO:00004231 | Colorectum | SER | mitophagy | 12/2897 | 28/18723 | 4.92e-04 | 7.02e-03 | 12 |
| GO:19035331 | Colorectum | SER | regulation of protein targeting | 24/2897 | 81/18723 | 9.20e-04 | 1.11e-02 | 24 |
| Page: 1 2 3 4 5 6 7 8 9 10 11 12 13 14 15 16 17 18 19 20 21 22 23 24 25 26 27 28 29 30 31 32 33 34 35 36 37 38 39 40 41 42 43 |
| Pathway ID | Tissue | Disease Stage | Description | Gene Ratio | Bg Ratio | pvalue | p.adjust | qvalue | Count |
| hsa0413716 | Breast | Precancer | Mitophagy - animal | 15/684 | 72/8465 | 5.22e-04 | 3.93e-03 | 3.01e-03 | 15 |
| hsa0413717 | Breast | Precancer | Mitophagy - animal | 15/684 | 72/8465 | 5.22e-04 | 3.93e-03 | 3.01e-03 | 15 |
| hsa0413723 | Breast | IDC | Mitophagy - animal | 17/867 | 72/8465 | 7.61e-04 | 6.04e-03 | 4.52e-03 | 17 |
| hsa0413733 | Breast | IDC | Mitophagy - animal | 17/867 | 72/8465 | 7.61e-04 | 6.04e-03 | 4.52e-03 | 17 |
| hsa0413742 | Breast | DCIS | Mitophagy - animal | 17/846 | 72/8465 | 5.75e-04 | 4.42e-03 | 3.26e-03 | 17 |
| hsa0413752 | Breast | DCIS | Mitophagy - animal | 17/846 | 72/8465 | 5.75e-04 | 4.42e-03 | 3.26e-03 | 17 |
| hsa0413718 | Cervix | CC | Mitophagy - animal | 22/1267 | 72/8465 | 5.77e-04 | 2.75e-03 | 1.63e-03 | 22 |
| hsa0413719 | Cervix | CC | Mitophagy - animal | 22/1267 | 72/8465 | 5.77e-04 | 2.75e-03 | 1.63e-03 | 22 |
| hsa0413724 | Cervix | N_HPV | Mitophagy - animal | 10/349 | 72/8465 | 6.84e-04 | 5.03e-03 | 3.93e-03 | 10 |
| hsa0413734 | Cervix | N_HPV | Mitophagy - animal | 10/349 | 72/8465 | 6.84e-04 | 5.03e-03 | 3.93e-03 | 10 |
| hsa04137 | Colorectum | AD | Mitophagy - animal | 29/2092 | 72/8465 | 2.49e-03 | 1.35e-02 | 8.59e-03 | 29 |
| hsa041371 | Colorectum | AD | Mitophagy - animal | 29/2092 | 72/8465 | 2.49e-03 | 1.35e-02 | 8.59e-03 | 29 |
| hsa041372 | Colorectum | SER | Mitophagy - animal | 22/1580 | 72/8465 | 9.93e-03 | 4.78e-02 | 3.47e-02 | 22 |
| hsa041373 | Colorectum | SER | Mitophagy - animal | 22/1580 | 72/8465 | 9.93e-03 | 4.78e-02 | 3.47e-02 | 22 |
| hsa041374 | Colorectum | MSS | Mitophagy - animal | 27/1875 | 72/8465 | 2.17e-03 | 1.10e-02 | 6.76e-03 | 27 |
| hsa041375 | Colorectum | MSS | Mitophagy - animal | 27/1875 | 72/8465 | 2.17e-03 | 1.10e-02 | 6.76e-03 | 27 |
| hsa041376 | Colorectum | MSI-H | Mitophagy - animal | 16/797 | 72/8465 | 8.73e-04 | 1.01e-02 | 8.48e-03 | 16 |
| hsa041377 | Colorectum | MSI-H | Mitophagy - animal | 16/797 | 72/8465 | 8.73e-04 | 1.01e-02 | 8.48e-03 | 16 |
| hsa0413720 | Endometrium | AEH | Mitophagy - animal | 21/1197 | 72/8465 | 7.03e-04 | 4.86e-03 | 3.56e-03 | 21 |
| hsa04137110 | Endometrium | AEH | Mitophagy - animal | 21/1197 | 72/8465 | 7.03e-04 | 4.86e-03 | 3.56e-03 | 21 |
| Page: 1 2 3 |
Top |
Cell-cell communication analysis |
| Identification of potential cell-cell interactions between two cell types and their ligand-receptor pairs for different disease states |
| Ligand | Receptor | LRpair | Pathway | Tissue | Disease Stage |
| Page: 1 |
Top |
Single-cell gene regulatory network inference analysis |
| Find out the significant the regulons (TFs) and the target genes of each regulon across cell types for different disease states |
| TF | Cell Type | Tissue | Disease Stage | Target Gene | RSS | Regulon Activity |
| ∗The dot plots of a searched regulon are shown for all cell subpopulations in each disease state of each tissue based on the regulon specific score inferred using pySCENIC and by calculating the average expression. |
| Page: 1 |
Top |
Somatic mutation of malignant transformation related genes |
| Annotation of somatic variants for genes involved in malignant transformation |
| Hugo Symbol | Variant Class | Variant Classification | dbSNP RS | HGVSc | HGVSp | HGVSp Short | SWISSPROT | BIOTYPE | SIFT | PolyPhen | Tumor Sample Barcode | Tissue | Histology | Sex | Age | Stage | Therapy Types | Drugs | Outcome |
| TOMM7 | SNV | Missense_Mutation | novel | c.32N>A | p.Arg11Lys | p.R11K | Q9P0U1 | protein_coding | tolerated(0.17) | possibly_damaging(0.514) | TCGA-EI-6917-01 | Colorectum | rectum adenocarcinoma | Male | <65 | III/IV | Chemotherapy | 5fluorouracil+oxaciplatina+l-folinian | SD |
| TOMM7 | SNV | Missense_Mutation | novel | c.96T>G | p.Ile32Met | p.I32M | Q9P0U1 | protein_coding | deleterious(0.01) | benign(0.424) | TCGA-F5-6814-01 | Colorectum | rectum adenocarcinoma | Male | <65 | I/II | Unknown | Unknown | SD |
| TOMM7 | SNV | Missense_Mutation | novel | c.15N>G | p.Ser5Arg | p.S5R | Q9P0U1 | protein_coding | deleterious(0) | benign(0.014) | TCGA-22-1000-01 | Lung | lung squamous cell carcinoma | Male | >=65 | I/II | Unknown | Unknown | PD |
| TOMM7 | SNV | Missense_Mutation | novel | c.91N>A | p.Val31Met | p.V31M | Q9P0U1 | protein_coding | deleterious(0.04) | benign(0.076) | TCGA-XK-AAIW-01 | Prostate | prostate adenocarcinoma | Male | >=65 | 9 | Unknown | Unknown | PD |
| Page: 1 |
Top |
Related drugs of malignant transformation related genes |
| Identification of chemicals and drugs interact with genes involved in malignant transfromation |
| (DGIdb 4.0) |
| Entrez ID | Symbol | Category | Interaction Types | Drug Claim Name | Drug Name | PMIDs |
| Page: 1 |

Copyright 2023-Present -The University of Texas Health Science Center at Houston |