Schematic overview of the cellular and molecular mechanisms involved in the cancer progression, including the proposed cellular and molecular mechanisms in cancer cells trajectory. AT1: alveolar type 1 cells; AT2: alveolar type 2 cells; AAH: atypical adenomatous hyperplasia; AIS: adenocarcinoma in situ; MIA: minimally invasive adenocarcinoma; IA: invasive adenocarcinoma; EMT: epithelial-mesenchymal transition

Home

Download

Statistics

Help

Contact

Center for Computational Systems Medicine
leaf

Gene summary

leaf

Malignant transformation analysis

leaf

Malignant transformation related pathway analysis

leaf

Cell-cell communication analysis

leaf

Single-cell gene regulatory network inference analysis

leaf

Somatic mutation of malignant transformation related genes

leaf

Related drugs of malignant transformation related genes

Gene: TNKS2

Gene summary for TNKS2

check button Gene summary.

Gene informationSpeciesHuman
Gene symbol

TNKS2

Gene ID

80351

Gene nametankyrase 2
Gene AliasARTD6
Cytomap10q23.32
Gene Typeprotein-coding
GO ID

GO:0000209

UniProtAcc

Q9H2K2


Top

Malignant transformation analysis

check button Identification of the aberrant gene expression in precancerous and cancerous lesions by comparing the gene expression of stem-like cells in diseased tissues with normal stem cells
check button Malignant transformation involving gene list.
Entrez IDSymbolReplicatesSpeciesOrganTissueAdj P-valueLog2FCMalignancy
80351TNKS2LZE4THumanEsophagusESCC7.79e-048.95e-020.0811
80351TNKS2LZE5THumanEsophagusESCC2.26e-023.90e-010.0514
80351TNKS2LZE8THumanEsophagusESCC3.71e-052.89e-020.067
80351TNKS2LZE20THumanEsophagusESCC6.19e-051.10e-010.0662
80351TNKS2LZE22D1HumanEsophagusHGIN4.58e-032.90e-020.0595
80351TNKS2LZE22THumanEsophagusESCC1.05e-022.17e-010.068
80351TNKS2LZE24THumanEsophagusESCC3.18e-267.01e-010.0596
80351TNKS2LZE21THumanEsophagusESCC3.60e-042.78e-010.0655
80351TNKS2P1T-EHumanEsophagusESCC1.52e-126.29e-010.0875
80351TNKS2P2T-EHumanEsophagusESCC1.10e-235.34e-010.1177
80351TNKS2P4T-EHumanEsophagusESCC7.35e-214.87e-010.1323
80351TNKS2P5T-EHumanEsophagusESCC3.17e-171.85e-010.1327
80351TNKS2P8T-EHumanEsophagusESCC1.29e-204.07e-010.0889
80351TNKS2P9T-EHumanEsophagusESCC4.02e-089.39e-020.1131
80351TNKS2P10T-EHumanEsophagusESCC4.92e-131.19e-010.116
80351TNKS2P11T-EHumanEsophagusESCC3.87e-074.13e-010.1426
80351TNKS2P12T-EHumanEsophagusESCC1.11e-214.59e-010.1122
80351TNKS2P15T-EHumanEsophagusESCC3.55e-205.02e-010.1149
80351TNKS2P16T-EHumanEsophagusESCC2.06e-213.75e-010.1153
80351TNKS2P17T-EHumanEsophagusESCC4.07e-072.43e-010.1278
Page: 1 2 3 4 5 6 7 

check button Transcriptomic changes along malignancy continuum.
TissueExpression DynamicsAbbreviation
EsophagusThe image shows the transcriptomic changes along malignancy continuum.log2FC in expression of this searched gene in stem-like cells from each diseased tissue sample relative to stem-like cells in normal samples in each tissue plotted against the malignancy continuum. Samples are colored based on if they are from different disease stage.ESCC: Esophageal squamous cell carcinoma
HGIN: High-grade intraepithelial neoplasias
LGIN: Low-grade intraepithelial neoplasias
LiverThe image shows the transcriptomic changes along malignancy continuum.log2FC in expression of this searched gene in stem-like cells from each diseased tissue sample relative to stem-like cells in normal samples in each tissue plotted against the malignancy continuum. Samples are colored based on if they are from different disease stage.
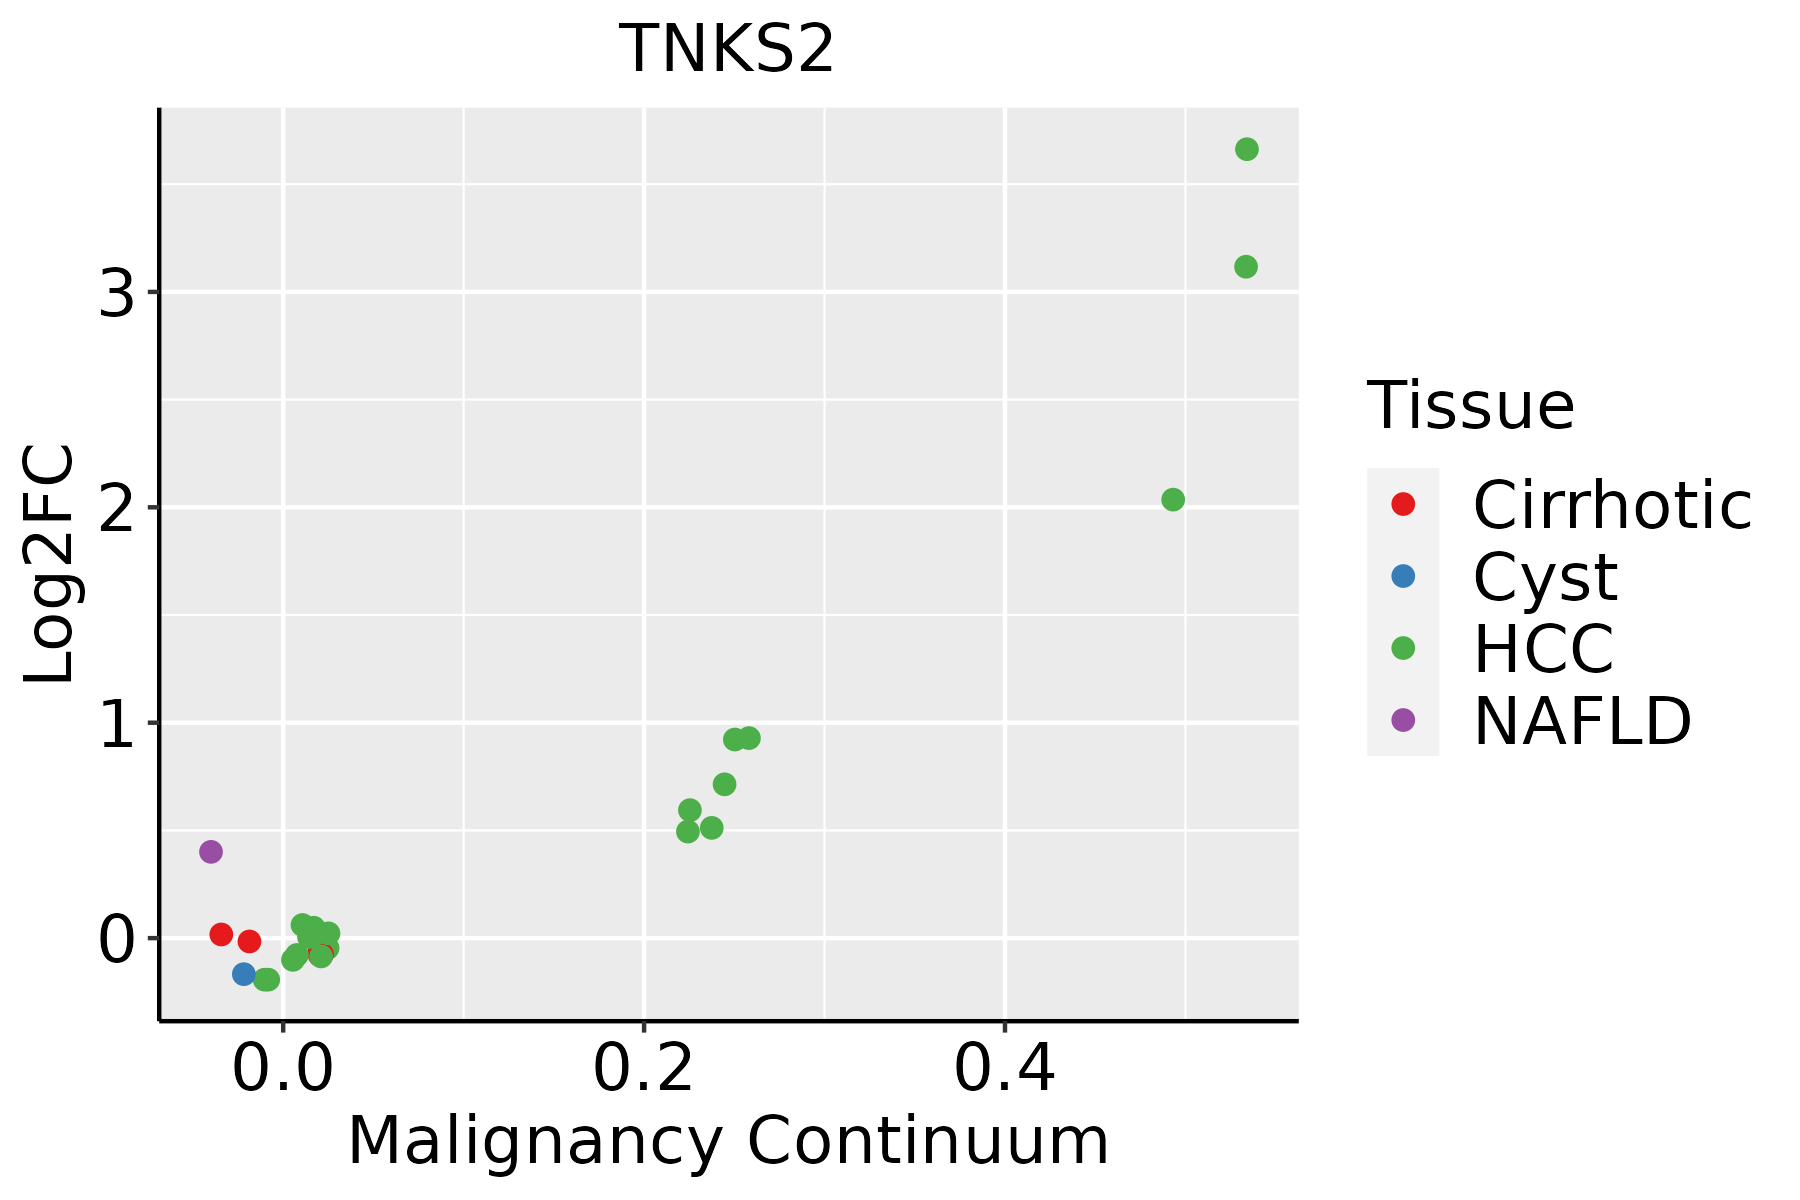
HCC: Hepatocellular carcinoma
NAFLD: Non-alcoholic fatty liver disease
LungThe image shows the transcriptomic changes along malignancy continuum.log2FC in expression of this searched gene in stem-like cells from each diseased tissue sample relative to stem-like cells in normal samples in each tissue plotted against the malignancy continuum. Samples are colored based on if they are from different disease stage.
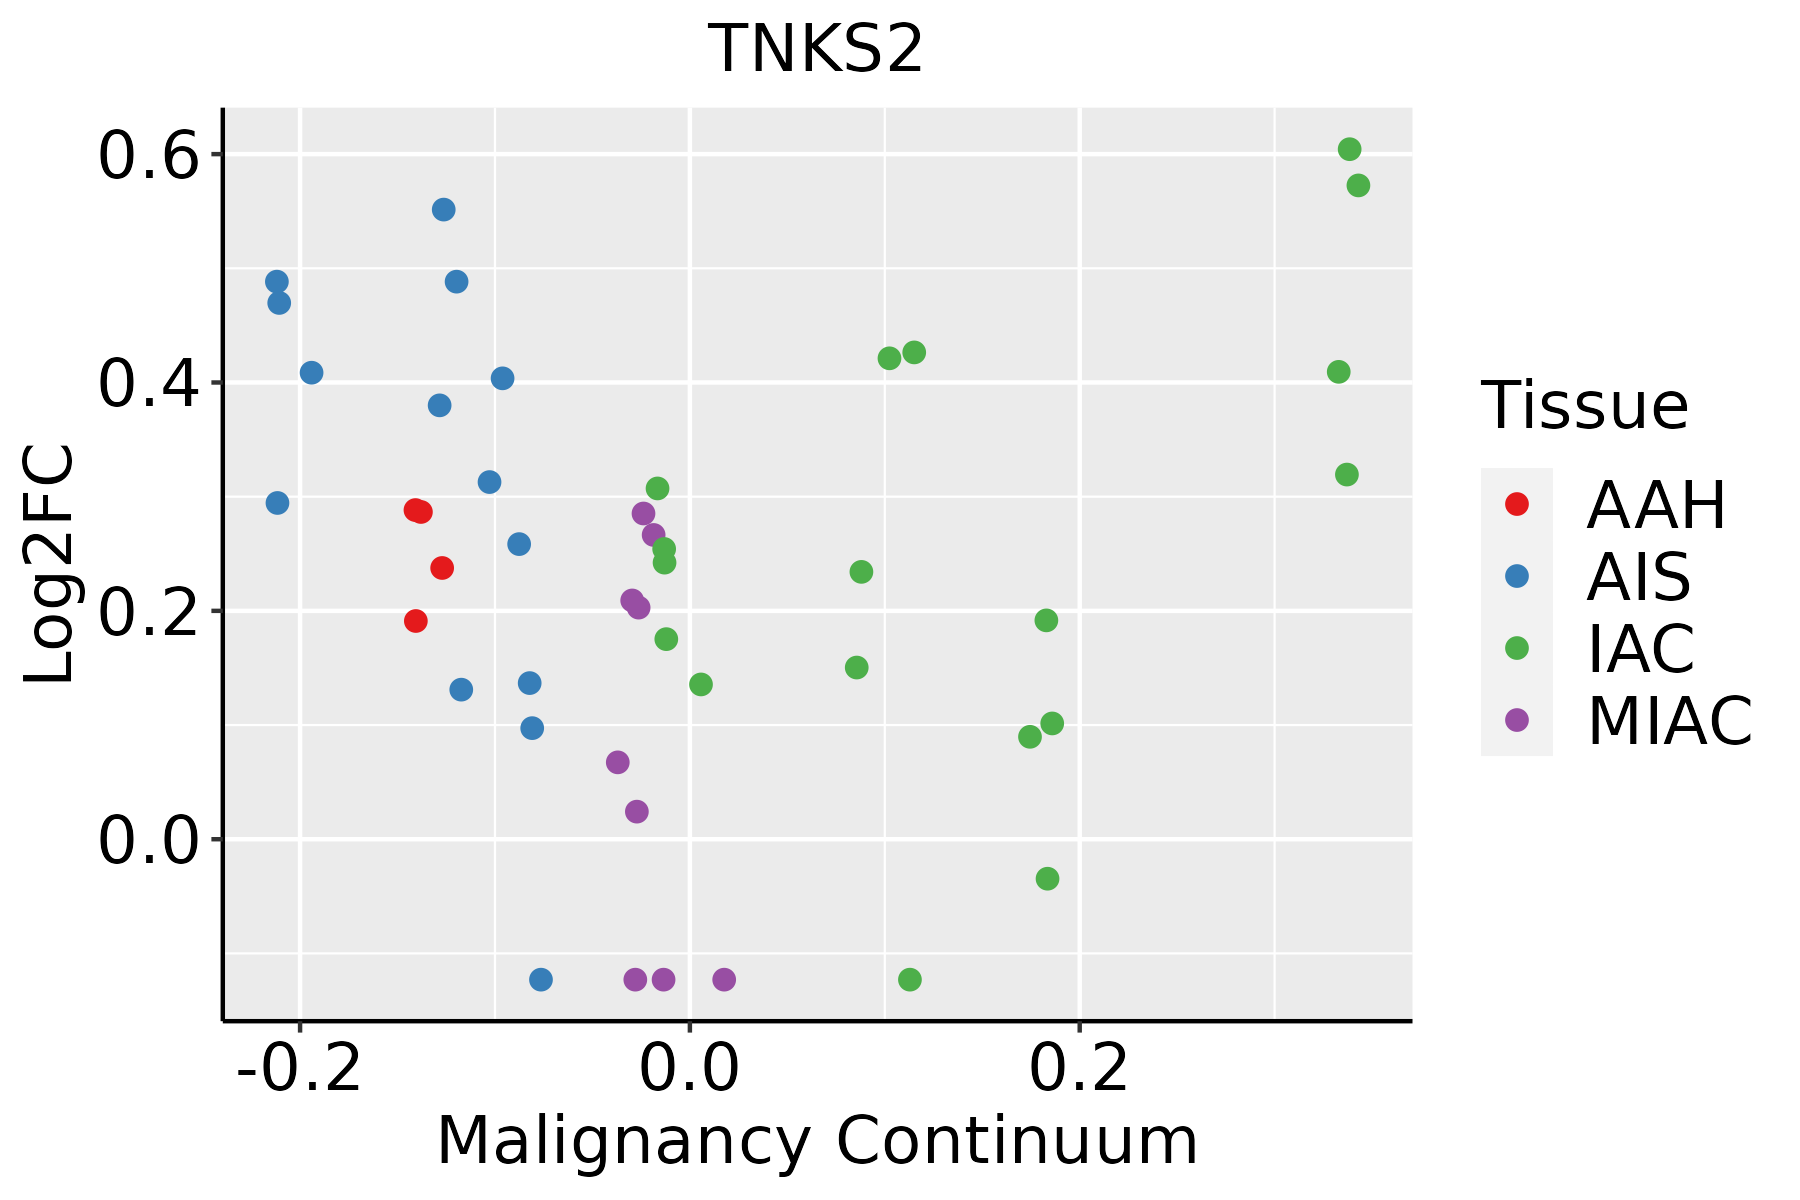
AAH: Atypical adenomatous hyperplasia
AIS: Adenocarcinoma in situ
IAC: Invasive lung adenocarcinoma
MIA: Minimally invasive adenocarcinoma
Oral CavityThe image shows the transcriptomic changes along malignancy continuum.log2FC in expression of this searched gene in stem-like cells from each diseased tissue sample relative to stem-like cells in normal samples in each tissue plotted against the malignancy continuum. Samples are colored based on if they are from different disease stage.
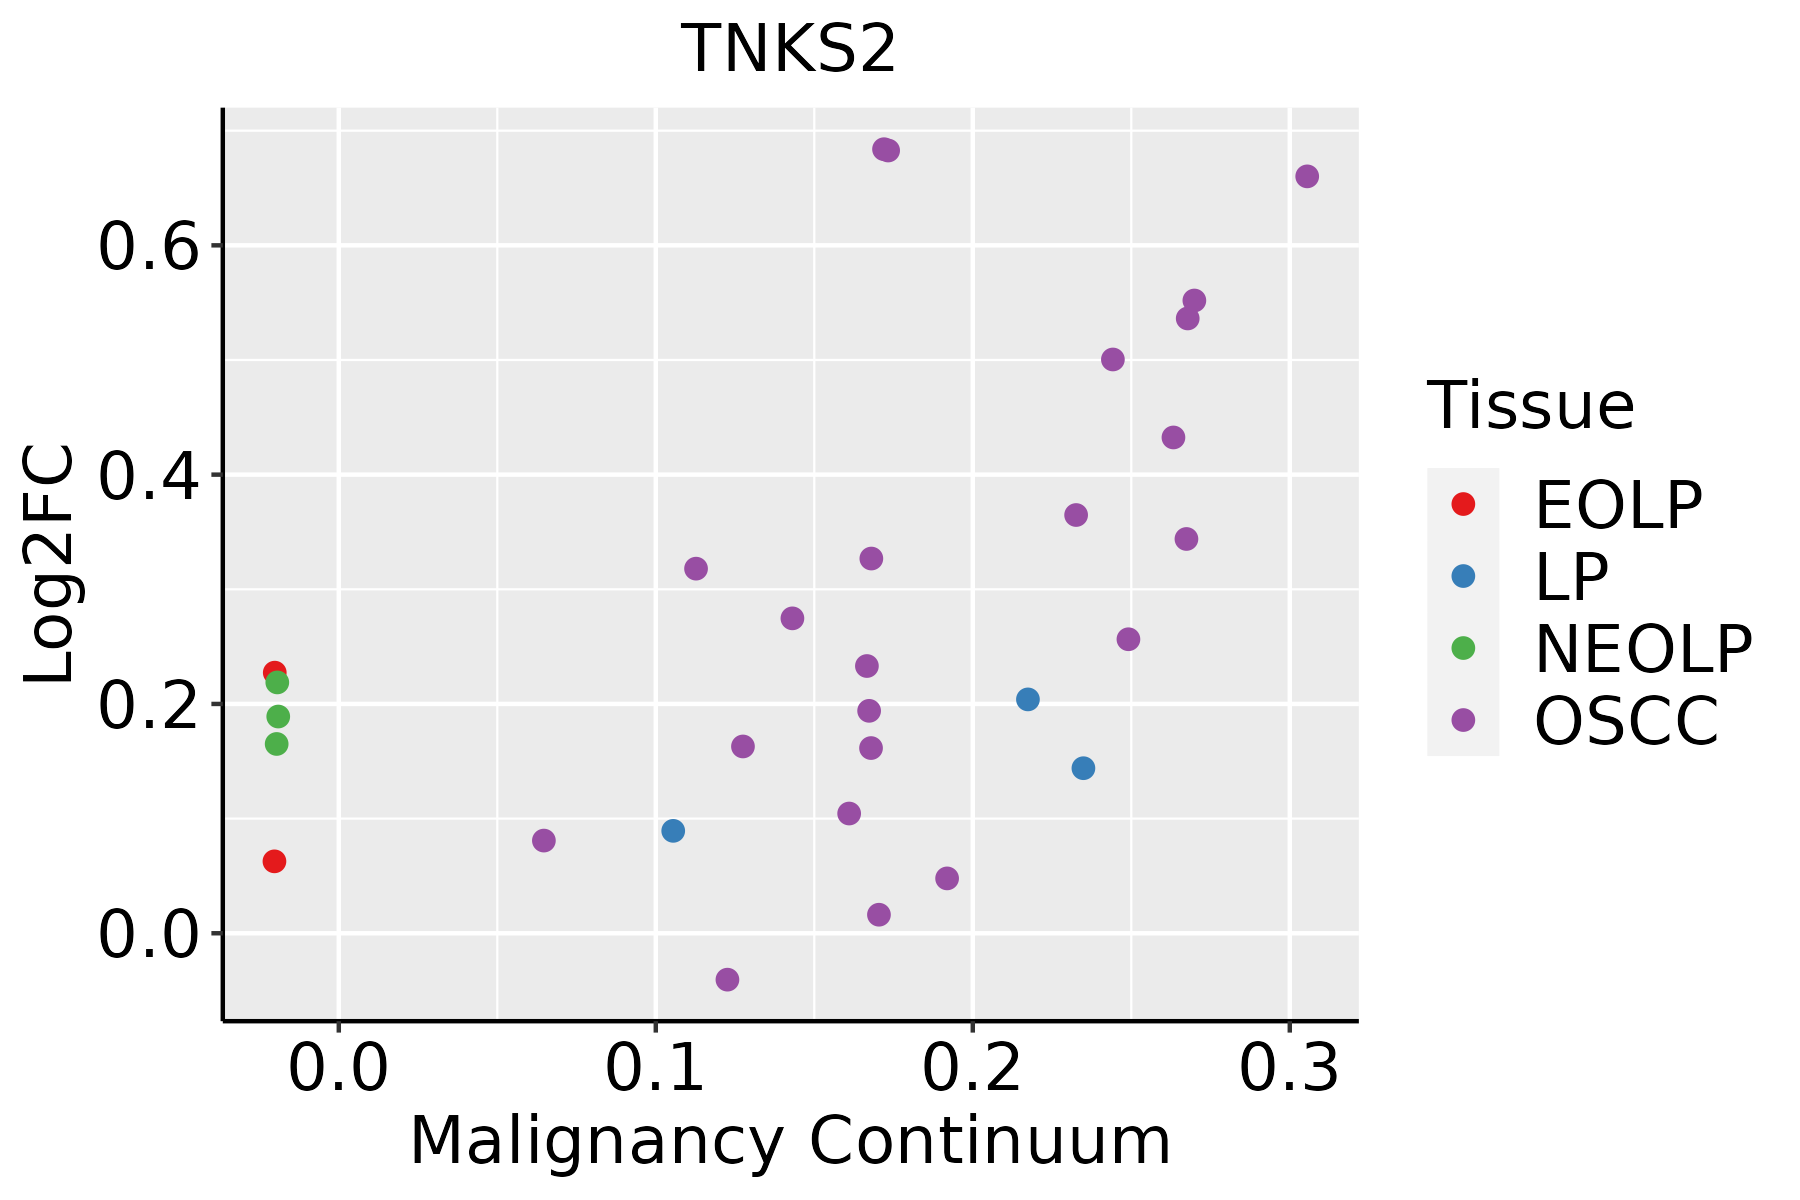
EOLP: Erosive Oral lichen planus
LP: leukoplakia
NEOLP: Non-erosive oral lichen planus
OSCC: Oral squamous cell carcinoma
ProstateThe image shows the transcriptomic changes along malignancy continuum.log2FC in expression of this searched gene in stem-like cells from each diseased tissue sample relative to stem-like cells in normal samples in each tissue plotted against the malignancy continuum. Samples are colored based on if they are from different disease stage.BPH: Benign Prostatic Hyperplasia
ThyroidThe image shows the transcriptomic changes along malignancy continuum.log2FC in expression of this searched gene in stem-like cells from each diseased tissue sample relative to stem-like cells in normal samples in each tissue plotted against the malignancy continuum. Samples are colored based on if they are from different disease stage.ATC: Anaplastic thyroid cancer
HT: Hashimoto's thyroiditis
PTC: Papillary thyroid cancer
∗log2FC in expression of this searched gene in stem-like cells from each diseased tissue sample relative to stem-like cells in normal samples in each tissue plotted against the malignancy continuum. Samples are colored based on if they are from different disease stage.

Top

Malignant transformation related pathway analysis

check buttonFind out the enriched GO biological processes and KEGG pathways involved in transition from healthy to precancer to cancer
check button Figure of enriched GO biological processes.
TissueDisease StageEnriched GO biological Processes
ColorectumADGO analysis - Figure of enriched GO biological processes: Top 15 enriched GO BP terms are showed in the bar plot of each disease state in each tissue. Each row represents a significant GO biological process which is colored according to the -log10(p.adjust).
ColorectumSERGO analysis - Figure of enriched GO biological processes: Top 15 enriched GO BP terms are showed in the bar plot of each disease state in each tissue. Each row represents a significant GO biological process which is colored according to the -log10(p.adjust).
ColorectumMSSGO analysis - Figure of enriched GO biological processes: Top 15 enriched GO BP terms are showed in the bar plot of each disease state in each tissue. Each row represents a significant GO biological process which is colored according to the -log10(p.adjust).
ColorectumMSI-HGO analysis - Figure of enriched GO biological processes: Top 15 enriched GO BP terms are showed in the bar plot of each disease state in each tissue. Each row represents a significant GO biological process which is colored according to the -log10(p.adjust).
ColorectumFAPGO analysis - Figure of enriched GO biological processes: Top 15 enriched GO BP terms are showed in the bar plot of each disease state in each tissue. Each row represents a significant GO biological process which is colored according to the -log10(p.adjust).
∗Top 15 enriched GO BP terms are showed in the bar plot of each disease state in each tissue. Each row represents a significant GO biological process which is colored according to the -log10(p.adjust).
Page: 1 2 3 4 5 6 7 8 9 

check button Enriched GO biological processes.
GO IDTissueDisease StageDescriptionGene RatioBg Ratiopvaluep.adjustCount
GO:003220615Oral cavityOSCCpositive regulation of telomere maintenance34/730552/187231.05e-047.81e-0434
GO:006082810Oral cavityOSCCregulation of canonical Wnt signaling pathway128/7305253/187231.11e-048.16e-04128
GO:00322006Oral cavityOSCCtelomere organization85/7305159/187231.47e-041.04e-0385
GO:00322107Oral cavityOSCCregulation of telomere maintenance via telomerase34/730553/187231.84e-041.25e-0334
GO:006007010Oral cavityOSCCcanonical Wnt signaling pathway148/7305303/187232.89e-041.82e-03148
GO:190435610Oral cavityOSCCregulation of telomere maintenance via telomere lengthening37/730561/187235.02e-042.95e-0337
GO:00701986Oral cavityOSCCprotein localization to chromosome, telomeric region20/730529/187231.05e-035.39e-0320
GO:00301779Oral cavityOSCCpositive regulation of Wnt signaling pathway73/7305140/187231.06e-035.46e-0373
GO:190435816Oral cavityOSCCpositive regulation of telomere maintenance via telomere lengthening24/730537/187231.29e-036.44e-0324
GO:00322129Oral cavityOSCCpositive regulation of telomere maintenance via telomerase22/730534/187232.14e-039.81e-0322
GO:00352646Oral cavityOSCCmulticellular organism growth65/7305132/187231.06e-023.60e-0265
GO:000020923Oral cavityEOLPprotein polyubiquitination62/2218236/187237.88e-105.90e-0862
GO:003304422Oral cavityEOLPregulation of chromosome organization50/2218187/187231.80e-087.94e-0750
GO:001605523Oral cavityEOLPWnt signaling pathway89/2218444/187233.66e-071.06e-0589
GO:019873823Oral cavityEOLPcell-cell signaling by wnt89/2218446/187234.49e-071.25e-0589
GO:005105222Oral cavityEOLPregulation of DNA metabolic process75/2218359/187235.81e-071.53e-0575
GO:000072322Oral cavityEOLPtelomere maintenance36/2218131/187238.39e-072.10e-0536
GO:003011123Oral cavityEOLPregulation of Wnt signaling pathway67/2218328/187235.11e-061.04e-0467
GO:009026323Oral cavityEOLPpositive regulation of canonical Wnt signaling pathway29/2218106/187231.04e-051.86e-0429
GO:003220422Oral cavityEOLPregulation of telomere maintenance24/221880/187231.09e-051.93e-0424
Page: 1 2 3 4 5 6 7 8 9 10 11 12 13 14 15 16 

check button Enriched KEGG pathways.
Pathway IDTissueDisease StageDescriptionGene RatioBg Ratiopvaluep.adjustqvalueCount
Page: 1 

Top

Cell-cell communication analysis

check buttonIdentification of potential cell-cell interactions between two cell types and their ligand-receptor pairs for different disease states
LigandReceptorLRpairPathwayTissueDisease Stage
Page: 1 

Top

Single-cell gene regulatory network inference analysis

check buttonFind out the significant the regulons (TFs) and the target genes of each regulon across cell types for different disease states
TFCell TypeTissueDisease StageTarget GeneRSSRegulon Activity
∗The dot plots of a searched regulon are shown for all cell subpopulations in each disease state of each tissue based on the regulon specific score inferred using pySCENIC and by calculating the average expression.
Page: 1 

Top

Somatic mutation of malignant transformation related genes

check buttonAnnotation of somatic variants for genes involved in malignant transformation
Hugo SymbolVariant ClassVariant ClassificationdbSNP RSHGVScHGVSpHGVSp ShortSWISSPROTBIOTYPESIFTPolyPhenTumor Sample BarcodeTissueHistologySexAgeStageTherapy TypesDrugsOutcome
TNKS2SNVMissense_Mutationnovelc.2611G>Tp.Val871Phep.V871FQ9H2K2protein_codingtolerated(0.44)benign(0.003)TCGA-A2-A04Y-01Breastbreast invasive carcinomaFemale<65I/IIChemotherapycytoxanSD
TNKS2SNVMissense_Mutationnovelc.536N>Tp.Asp179Valp.D179VQ9H2K2protein_codingdeleterious(0)probably_damaging(0.939)TCGA-A8-A06X-01Breastbreast invasive carcinomaFemale>=65I/IIUnknownUnknownSD
TNKS2SNVMissense_Mutationnovelc.1169N>Ap.Gly390Glup.G390EQ9H2K2protein_codingdeleterious(0)probably_damaging(0.997)TCGA-A8-A08P-01Breastbreast invasive carcinomaFemale>=65III/IVChemotherapy5-fluorouracilCR
TNKS2SNVMissense_Mutationc.2342N>Tp.Pro781Leup.P781LQ9H2K2protein_codingdeleterious(0)possibly_damaging(0.687)TCGA-A8-A09Z-01Breastbreast invasive carcinomaFemale>=65I/IIUnknownUnknownSD
TNKS2SNVMissense_Mutationnovelc.3187N>Ap.Glu1063Lysp.E1063KQ9H2K2protein_codingdeleterious(0)probably_damaging(0.997)TCGA-AO-A0JC-01Breastbreast invasive carcinomaFemale<65I/IIChemotherapyfluorouracilSD
TNKS2SNVMissense_Mutationnovelc.2855N>Tp.Gly952Valp.G952VQ9H2K2protein_codingdeleterious(0)probably_damaging(0.984)TCGA-BH-A0H5-01Breastbreast invasive carcinomaFemale<65I/IIChemotherapycytoxanCR
TNKS2SNVMissense_Mutationrs758437700c.2251G>Ap.Glu751Lysp.E751KQ9H2K2protein_codingtolerated(0.06)probably_damaging(1)TCGA-BH-A18G-01Breastbreast invasive carcinomaFemale>=65I/IIUnknownUnknownSD
TNKS2SNVMissense_Mutationc.1225N>Cp.Glu409Glnp.E409QQ9H2K2protein_codingtolerated(0.11)benign(0.038)TCGA-D8-A1JA-01Breastbreast invasive carcinomaFemale<65III/IVChemotherapyadriamycinPD
TNKS2SNVMissense_Mutationc.265G>Ap.Asp89Asnp.D89NQ9H2K2protein_codingtolerated(0.14)probably_damaging(0.992)TCGA-E2-A159-01Breastbreast invasive carcinomaFemale<65I/IIChemotherapycyclophosphamideSD
TNKS2insertionFrame_Shift_Insnovelc.1377_1378insATGGAAGAATTGGGTTTCAGCTTATTAAGGATCTCAAp.Asn460MetfsTer28p.N460Mfs*28Q9H2K2protein_codingTCGA-AN-A04C-01Breastbreast invasive carcinomaFemale<65I/IIUnknownUnknownSD
Page: 1 2 3 4 5 6 7 8 9 10 11 12 

Top

Related drugs of malignant transformation related genes

check buttonIdentification of chemicals and drugs interact with genes involved in malignant transfromation
(DGIdb 4.0)
Entrez IDSymbolCategoryInteraction TypesDrug Claim NameDrug NamePMIDs
80351TNKS2DRUGGABLE GENOME, ENZYMEinhibitor404859121
80351TNKS2DRUGGABLE GENOME, ENZYMEinhibitor404859119
80351TNKS2DRUGGABLE GENOME, ENZYMEinhibitor404859123
80351TNKS2DRUGGABLE GENOME, ENZYMEPMID27841036-Compound-37
80351TNKS2DRUGGABLE GENOME, ENZYMEinhibitor404859118
80351TNKS2DRUGGABLE GENOME, ENZYMEinhibitor404859120
Page: 1