
|
|||||
|
 | |
| |
| |
| |
| |
| |
|
Gene: TFG |
Gene summary for TFG |
| Gene information | Species | Human | Gene symbol | TFG | Gene ID | 10342 |
| Gene name | trafficking from ER to golgi regulator | |
| Gene Alias | HMSNP | |
| Cytomap | 3q12.2 | |
| Gene Type | protein-coding | GO ID | GO:0006810 | UniProtAcc | Q92734 |
Top |
Malignant transformation analysis |
| Identification of the aberrant gene expression in precancerous and cancerous lesions by comparing the gene expression of stem-like cells in diseased tissues with normal stem cells |
| Entrez ID | Symbol | Replicates | Species | Organ | Tissue | Adj P-value | Log2FC | Malignancy |
| 10342 | TFG | CA_HPV_1 | Human | Cervix | CC | 5.70e-04 | -1.66e-01 | 0.0264 |
| 10342 | TFG | CCI_3 | Human | Cervix | CC | 3.61e-08 | 7.88e-01 | 0.516 |
| 10342 | TFG | Tumor | Human | Cervix | CC | 7.35e-16 | 4.70e-01 | 0.1241 |
| 10342 | TFG | sample3 | Human | Cervix | CC | 8.23e-28 | 5.45e-01 | 0.1387 |
| 10342 | TFG | L1 | Human | Cervix | CC | 8.83e-08 | 1.78e-01 | 0.0802 |
| 10342 | TFG | T3 | Human | Cervix | CC | 4.93e-30 | 5.75e-01 | 0.1389 |
| 10342 | TFG | HTA11_3410_2000001011 | Human | Colorectum | AD | 1.69e-03 | -3.13e-01 | 0.0155 |
| 10342 | TFG | HTA11_347_2000001011 | Human | Colorectum | AD | 1.45e-07 | 4.52e-01 | -0.1954 |
| 10342 | TFG | HTA11_99999974143_84620 | Human | Colorectum | MSS | 1.30e-03 | -3.05e-01 | 0.3005 |
| 10342 | TFG | A002-C-010 | Human | Colorectum | FAP | 2.50e-04 | -2.04e-01 | 0.242 |
| 10342 | TFG | A015-C-203 | Human | Colorectum | FAP | 4.54e-25 | -5.02e-01 | -0.1294 |
| 10342 | TFG | A015-C-204 | Human | Colorectum | FAP | 2.06e-08 | -4.35e-01 | -0.0228 |
| 10342 | TFG | A014-C-040 | Human | Colorectum | FAP | 1.40e-02 | -4.12e-01 | -0.1184 |
| 10342 | TFG | A002-C-201 | Human | Colorectum | FAP | 8.44e-11 | -3.75e-01 | 0.0324 |
| 10342 | TFG | A002-C-203 | Human | Colorectum | FAP | 2.66e-05 | -2.25e-01 | 0.2786 |
| 10342 | TFG | A001-C-119 | Human | Colorectum | FAP | 8.46e-10 | -4.69e-01 | -0.1557 |
| 10342 | TFG | A001-C-108 | Human | Colorectum | FAP | 6.51e-17 | -3.94e-01 | -0.0272 |
| 10342 | TFG | A002-C-205 | Human | Colorectum | FAP | 7.65e-19 | -5.25e-01 | -0.1236 |
| 10342 | TFG | A001-C-104 | Human | Colorectum | FAP | 3.02e-08 | -3.38e-01 | 0.0184 |
| 10342 | TFG | A015-C-005 | Human | Colorectum | FAP | 7.68e-04 | -3.30e-01 | -0.0336 |
| Page: 1 2 3 4 5 6 7 8 9 10 11 |
| Tissue | Expression Dynamics | Abbreviation |
| Cervix | 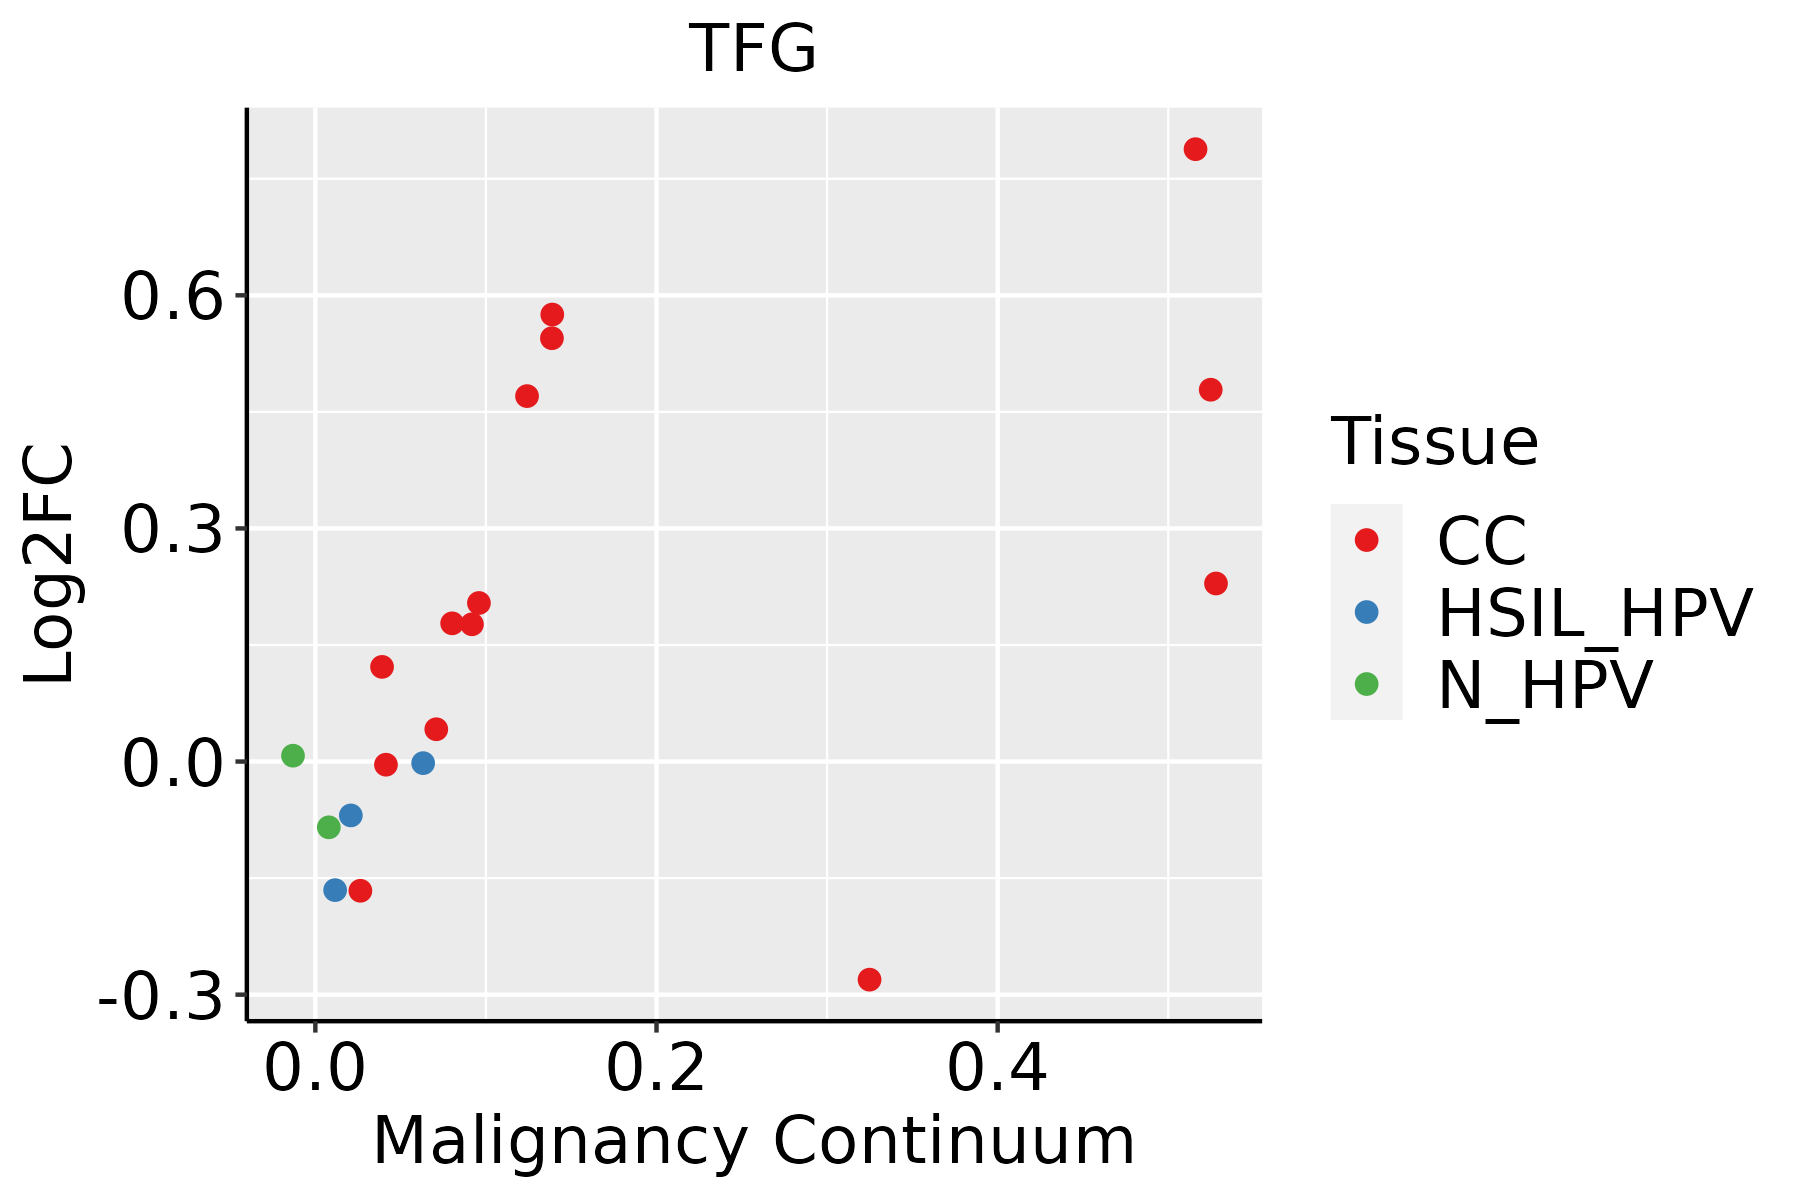 | CC: Cervix cancer |
| HSIL_HPV: HPV-infected high-grade squamous intraepithelial lesions | ||
| N_HPV: HPV-infected normal cervix | ||
| Colorectum (GSE201348) |  | FAP: Familial adenomatous polyposis |
| CRC: Colorectal cancer | ||
| Colorectum (HTA11) |  | AD: Adenomas |
| SER: Sessile serrated lesions | ||
| MSI-H: Microsatellite-high colorectal cancer | ||
| MSS: Microsatellite stable colorectal cancer | ||
| Endometrium | 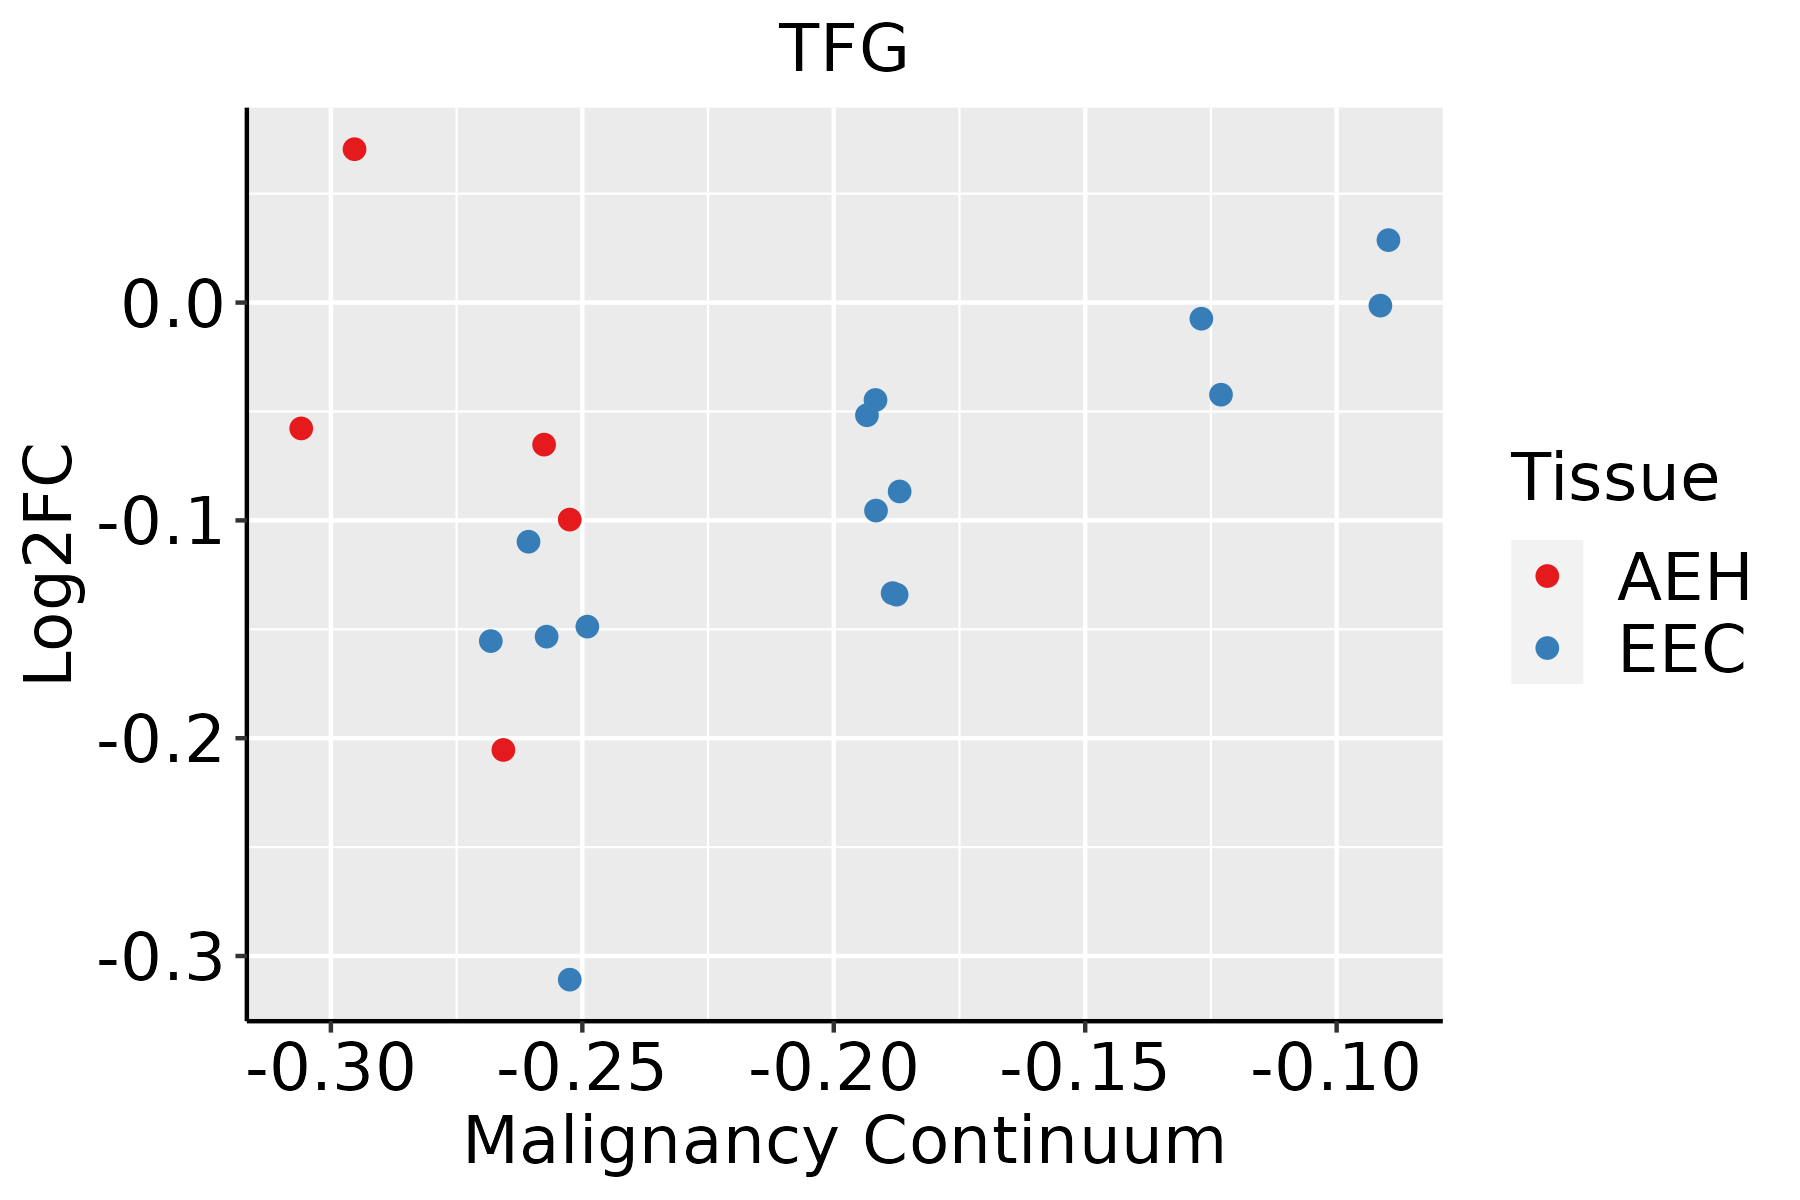 | AEH: Atypical endometrial hyperplasia |
| EEC: Endometrioid Cancer | ||
| Esophagus | 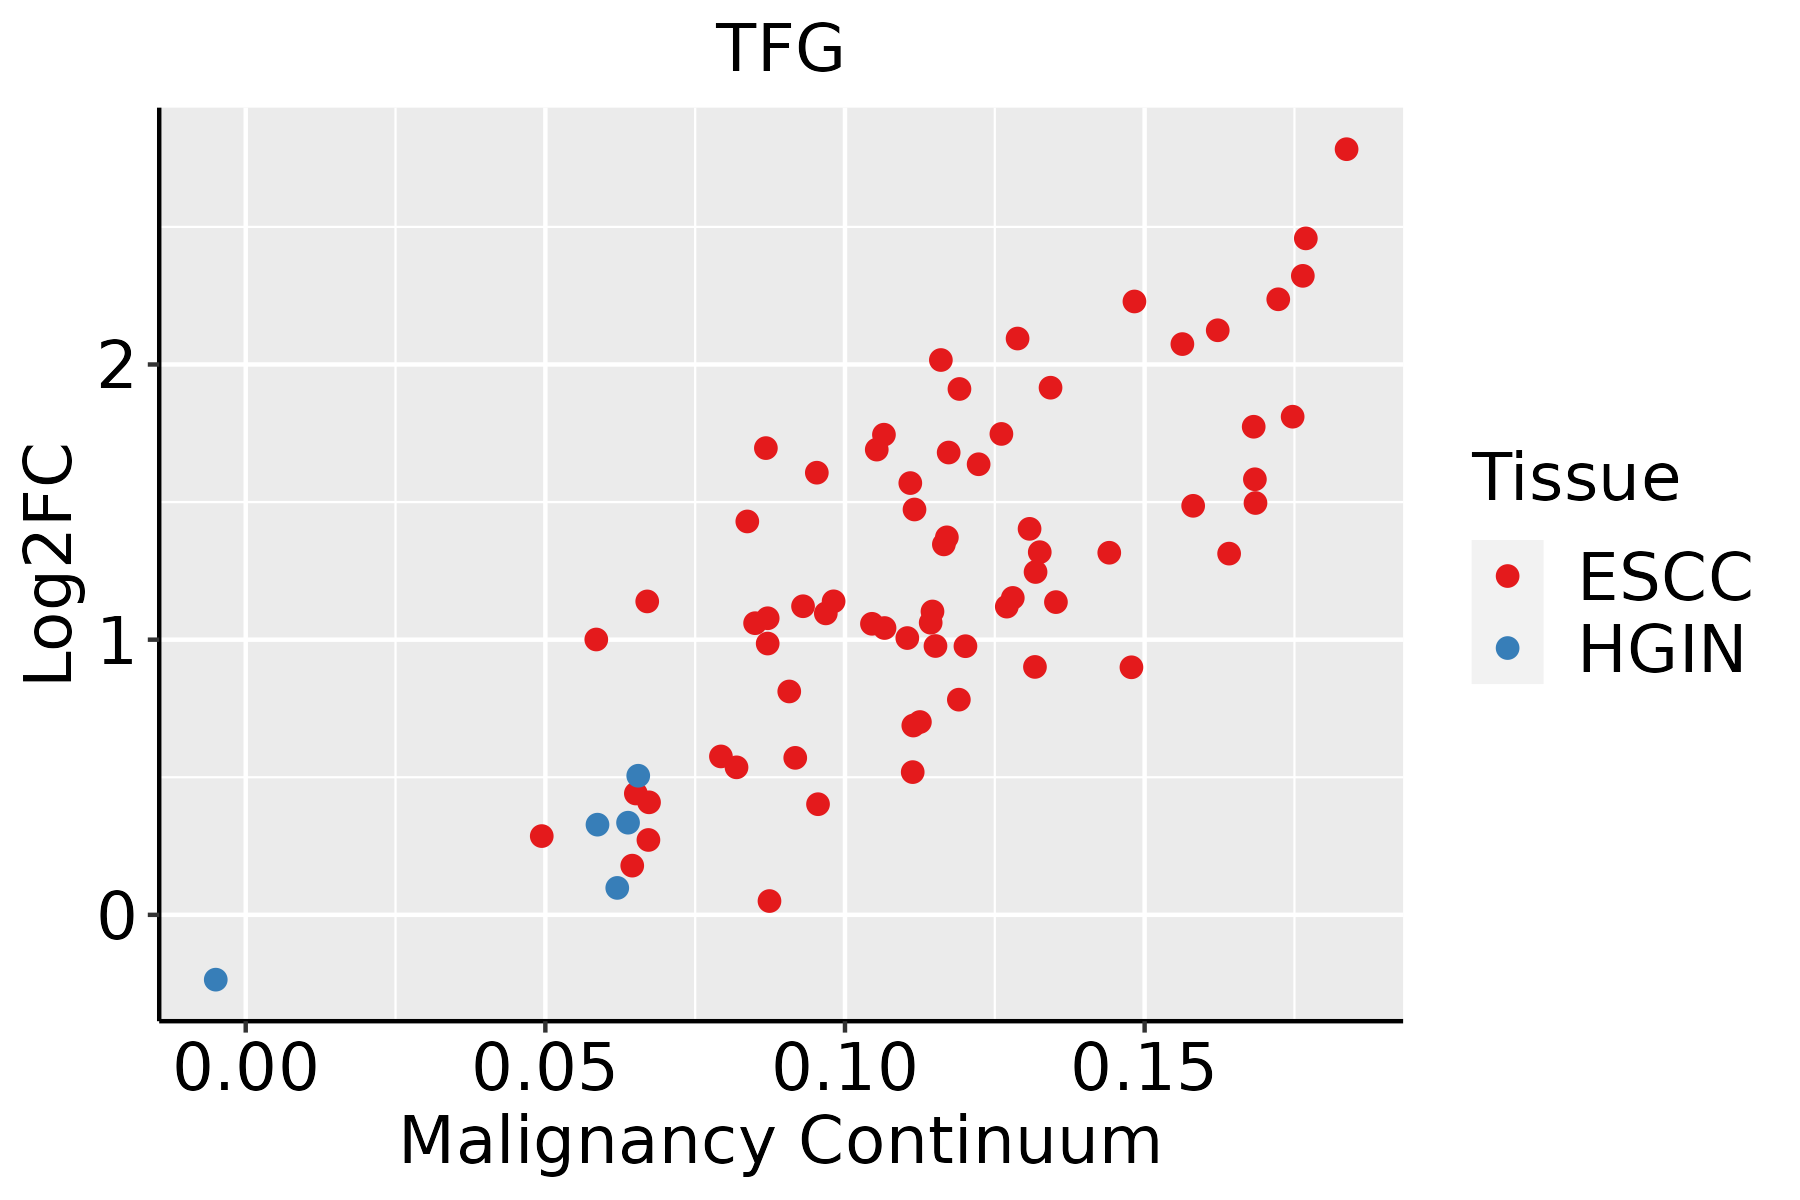 | ESCC: Esophageal squamous cell carcinoma |
| HGIN: High-grade intraepithelial neoplasias | ||
| LGIN: Low-grade intraepithelial neoplasias | ||
| Liver |  | HCC: Hepatocellular carcinoma |
| NAFLD: Non-alcoholic fatty liver disease | ||
| Oral Cavity | 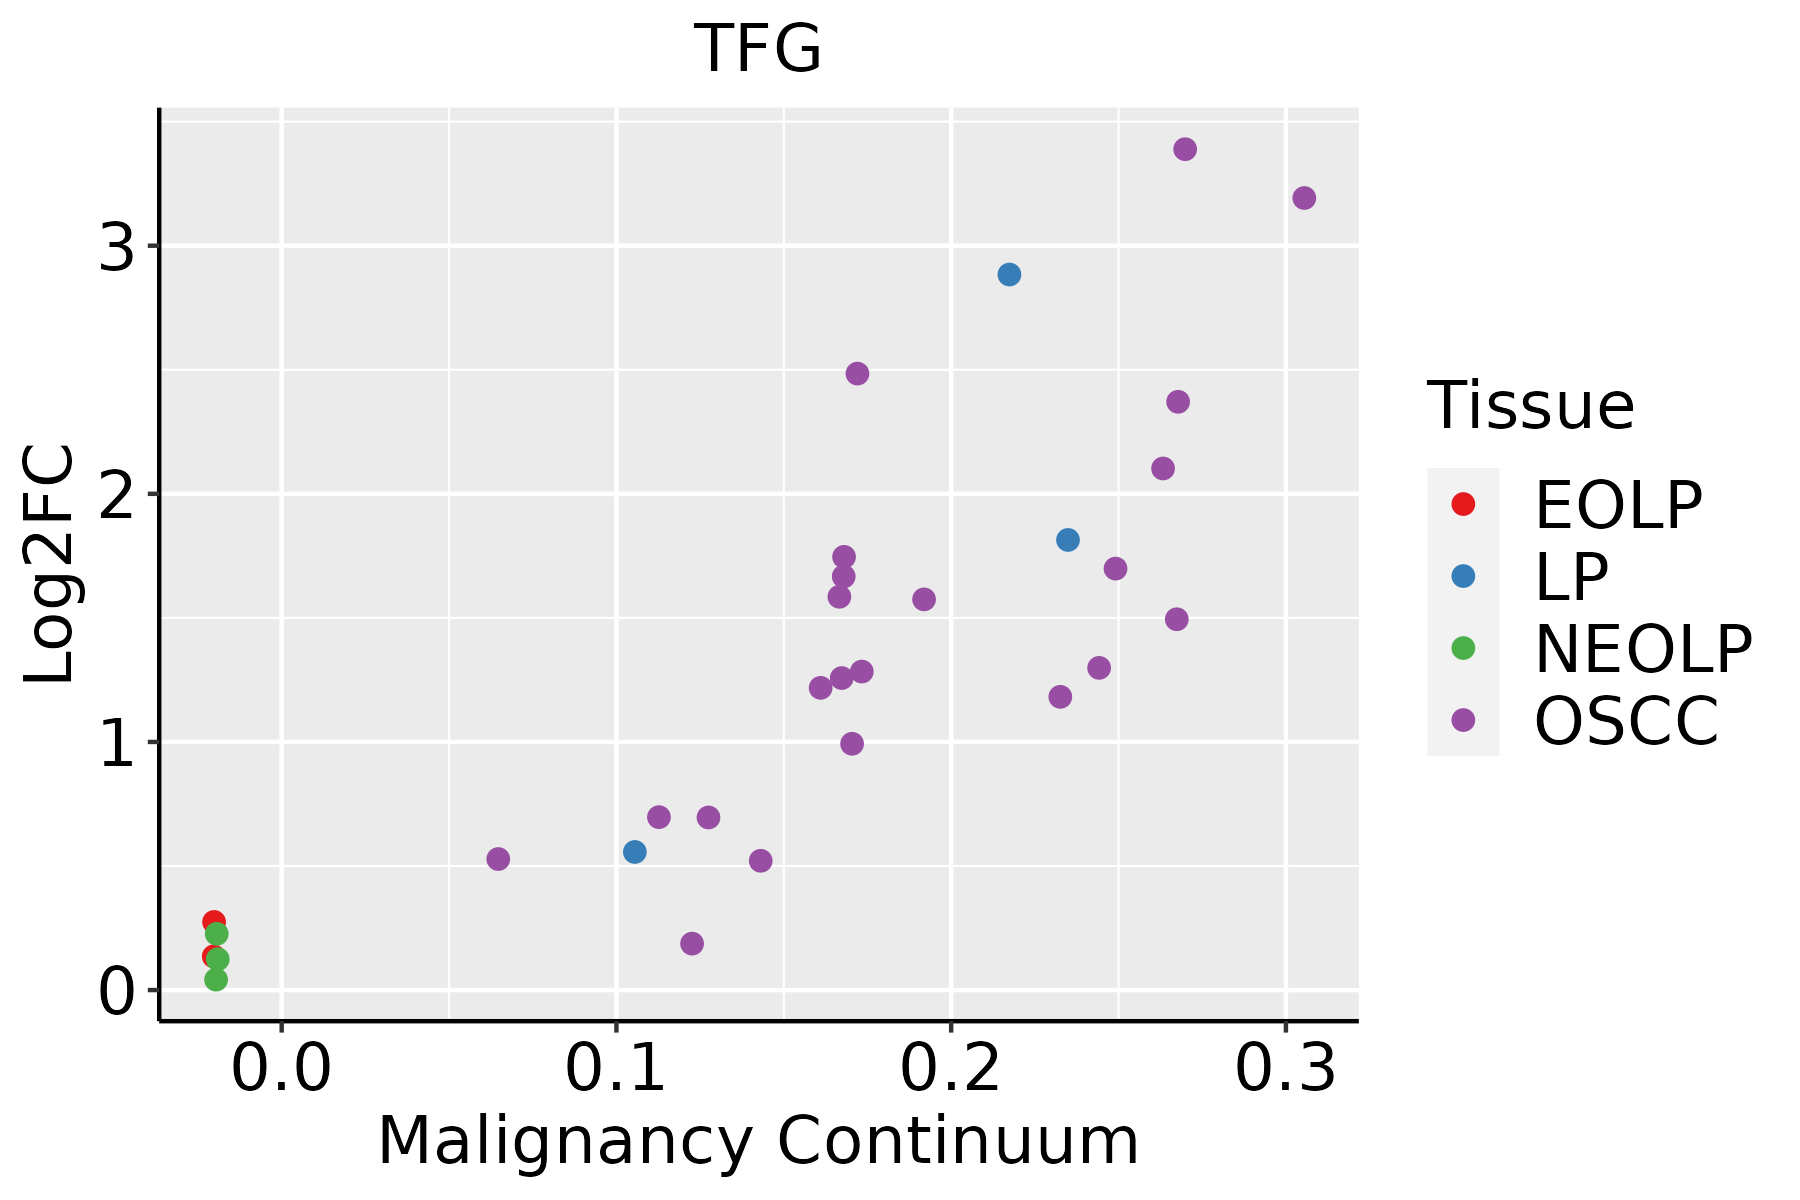 | EOLP: Erosive Oral lichen planus |
| LP: leukoplakia | ||
| NEOLP: Non-erosive oral lichen planus | ||
| OSCC: Oral squamous cell carcinoma | ||
| Prostate |  | BPH: Benign Prostatic Hyperplasia |
| Skin | 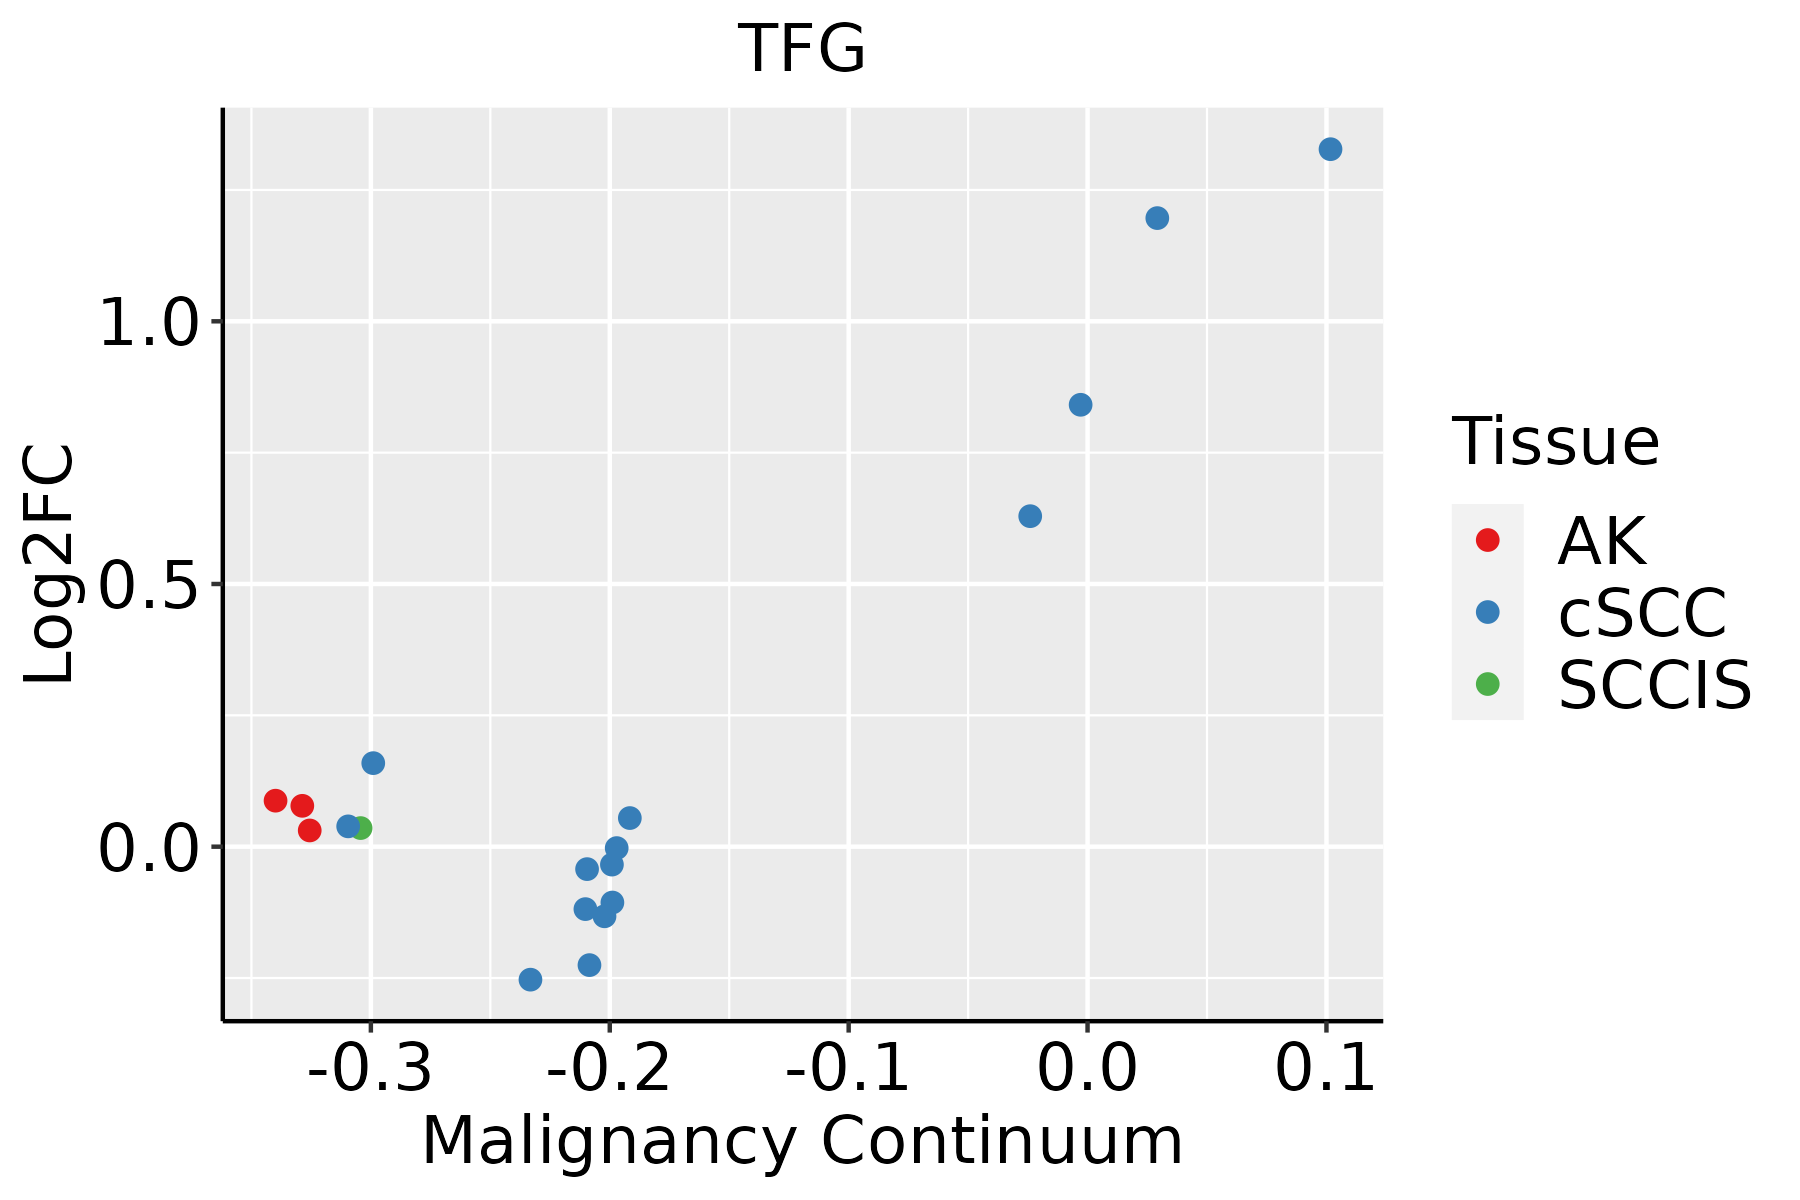 | AK: Actinic keratosis |
| cSCC: Cutaneous squamous cell carcinoma | ||
| SCCIS:squamous cell carcinoma in situ | ||
| Thyroid |  | ATC: Anaplastic thyroid cancer |
| HT: Hashimoto's thyroiditis | ||
| PTC: Papillary thyroid cancer |
| ∗log2FC in expression of this searched gene in stem-like cells from each diseased tissue sample relative to stem-like cells in normal samples in each tissue plotted against the malignancy continuum. Samples are colored based on if they are from different disease stage. |
Top |
Malignant transformation related pathway analysis |
| Find out the enriched GO biological processes and KEGG pathways involved in transition from healthy to precancer to cancer |
| Tissue | Disease Stage | Enriched GO biological Processes |
| Colorectum | AD |  |
| Colorectum | SER |  |
| Colorectum | MSS |  |
| Colorectum | MSI-H |  |
| Colorectum | FAP |  |
| ∗Top 15 enriched GO BP terms are showed in the bar plot of each disease state in each tissue. Each row represents a significant GO biological process which is colored according to the -log10(p.adjust). |
| Page: 1 2 3 4 5 6 7 8 9 |
| GO ID | Tissue | Disease Stage | Description | Gene Ratio | Bg Ratio | pvalue | p.adjust | Count |
| GO:00069013 | Liver | Cirrhotic | vesicle coating | 13/4634 | 17/18723 | 1.09e-05 | 1.56e-04 | 13 |
| GO:00431234 | Liver | Cirrhotic | positive regulation of I-kappaB kinase/NF-kappaB signaling | 71/4634 | 186/18723 | 3.20e-05 | 3.97e-04 | 71 |
| GO:0048207 | Liver | Cirrhotic | vesicle targeting, rough ER to cis-Golgi | 10/4634 | 13/18723 | 1.14e-04 | 1.14e-03 | 10 |
| GO:0048208 | Liver | Cirrhotic | COPII vesicle coating | 10/4634 | 13/18723 | 1.14e-04 | 1.14e-03 | 10 |
| GO:005165611 | Liver | Cirrhotic | establishment of organelle localization | 128/4634 | 390/18723 | 1.78e-04 | 1.67e-03 | 128 |
| GO:00069034 | Liver | Cirrhotic | vesicle targeting | 22/4634 | 45/18723 | 3.90e-04 | 3.23e-03 | 22 |
| GO:005165011 | Liver | Cirrhotic | establishment of vesicle localization | 58/4634 | 161/18723 | 8.98e-04 | 6.44e-03 | 58 |
| GO:005164811 | Liver | Cirrhotic | vesicle localization | 62/4634 | 177/18723 | 1.37e-03 | 9.18e-03 | 62 |
| GO:004819321 | Liver | HCC | Golgi vesicle transport | 217/7958 | 296/18723 | 2.58e-27 | 1.02e-24 | 217 |
| GO:000688821 | Liver | HCC | endoplasmic reticulum to Golgi vesicle-mediated transport | 100/7958 | 130/18723 | 1.15e-15 | 8.67e-14 | 100 |
| GO:001605021 | Liver | HCC | vesicle organization | 194/7958 | 300/18723 | 5.58e-15 | 3.97e-13 | 194 |
| GO:000690021 | Liver | HCC | vesicle budding from membrane | 53/7958 | 61/18723 | 7.38e-13 | 3.80e-11 | 53 |
| GO:005165621 | Liver | HCC | establishment of organelle localization | 226/7958 | 390/18723 | 4.15e-10 | 1.34e-08 | 226 |
| GO:00901142 | Liver | HCC | COPII-coated vesicle budding | 27/7958 | 29/18723 | 1.28e-08 | 3.14e-07 | 27 |
| GO:005165021 | Liver | HCC | establishment of vesicle localization | 103/7958 | 161/18723 | 2.94e-08 | 6.69e-07 | 103 |
| GO:00481991 | Liver | HCC | vesicle targeting, to, from or within Golgi | 20/7958 | 21/18723 | 4.57e-07 | 7.50e-06 | 20 |
| GO:005164821 | Liver | HCC | vesicle localization | 107/7958 | 177/18723 | 1.05e-06 | 1.57e-05 | 107 |
| GO:000724912 | Liver | HCC | I-kappaB kinase/NF-kappaB signaling | 156/7958 | 281/18723 | 6.66e-06 | 8.00e-05 | 156 |
| GO:000690311 | Liver | HCC | vesicle targeting | 34/7958 | 45/18723 | 6.75e-06 | 8.08e-05 | 34 |
| GO:000690111 | Liver | HCC | vesicle coating | 16/7958 | 17/18723 | 1.15e-05 | 1.31e-04 | 16 |
| Page: 1 2 3 4 5 6 7 8 9 10 11 12 13 14 15 16 17 |
| Pathway ID | Tissue | Disease Stage | Description | Gene Ratio | Bg Ratio | pvalue | p.adjust | qvalue | Count |
| hsa05216 | Colorectum | AD | Thyroid cancer | 21/2092 | 37/8465 | 3.05e-05 | 2.76e-04 | 1.76e-04 | 21 |
| hsa052161 | Colorectum | AD | Thyroid cancer | 21/2092 | 37/8465 | 3.05e-05 | 2.76e-04 | 1.76e-04 | 21 |
| hsa052164 | Colorectum | FAP | Thyroid cancer | 12/1404 | 37/8465 | 1.33e-02 | 4.46e-02 | 2.71e-02 | 12 |
| hsa052165 | Colorectum | FAP | Thyroid cancer | 12/1404 | 37/8465 | 1.33e-02 | 4.46e-02 | 2.71e-02 | 12 |
| hsa0521610 | Endometrium | AEH | Thyroid cancer | 12/1197 | 37/8465 | 3.68e-03 | 2.14e-02 | 1.56e-02 | 12 |
| hsa0521615 | Endometrium | AEH | Thyroid cancer | 12/1197 | 37/8465 | 3.68e-03 | 2.14e-02 | 1.56e-02 | 12 |
| hsa0521625 | Endometrium | EEC | Thyroid cancer | 13/1237 | 37/8465 | 1.51e-03 | 9.55e-03 | 7.12e-03 | 13 |
| hsa0521635 | Endometrium | EEC | Thyroid cancer | 13/1237 | 37/8465 | 1.51e-03 | 9.55e-03 | 7.12e-03 | 13 |
| hsa0521620 | Esophagus | HGIN | Thyroid cancer | 13/1383 | 37/8465 | 4.20e-03 | 3.04e-02 | 2.41e-02 | 13 |
| hsa05216110 | Esophagus | HGIN | Thyroid cancer | 13/1383 | 37/8465 | 4.20e-03 | 3.04e-02 | 2.41e-02 | 13 |
| hsa0521628 | Esophagus | ESCC | Thyroid cancer | 32/4205 | 37/8465 | 2.98e-06 | 1.72e-05 | 8.81e-06 | 32 |
| hsa0521638 | Esophagus | ESCC | Thyroid cancer | 32/4205 | 37/8465 | 2.98e-06 | 1.72e-05 | 8.81e-06 | 32 |
| hsa052167 | Liver | Cirrhotic | Thyroid cancer | 23/2530 | 37/8465 | 4.63e-05 | 3.28e-04 | 2.02e-04 | 23 |
| hsa0521612 | Liver | Cirrhotic | Thyroid cancer | 23/2530 | 37/8465 | 4.63e-05 | 3.28e-04 | 2.02e-04 | 23 |
| hsa0521622 | Liver | HCC | Thyroid cancer | 29/4020 | 37/8465 | 1.18e-04 | 5.88e-04 | 3.27e-04 | 29 |
| hsa0521632 | Liver | HCC | Thyroid cancer | 29/4020 | 37/8465 | 1.18e-04 | 5.88e-04 | 3.27e-04 | 29 |
| hsa0521618 | Oral cavity | OSCC | Thyroid cancer | 27/3704 | 37/8465 | 2.97e-04 | 9.39e-04 | 4.78e-04 | 27 |
| hsa0521619 | Oral cavity | OSCC | Thyroid cancer | 27/3704 | 37/8465 | 2.97e-04 | 9.39e-04 | 4.78e-04 | 27 |
| hsa0521627 | Oral cavity | LP | Thyroid cancer | 21/2418 | 37/8465 | 2.98e-04 | 1.60e-03 | 1.03e-03 | 21 |
| hsa0521637 | Oral cavity | LP | Thyroid cancer | 21/2418 | 37/8465 | 2.98e-04 | 1.60e-03 | 1.03e-03 | 21 |
| Page: 1 2 |
Top |
Cell-cell communication analysis |
| Identification of potential cell-cell interactions between two cell types and their ligand-receptor pairs for different disease states |
| Ligand | Receptor | LRpair | Pathway | Tissue | Disease Stage |
| Page: 1 |
Top |
Single-cell gene regulatory network inference analysis |
| Find out the significant the regulons (TFs) and the target genes of each regulon across cell types for different disease states |
| TF | Cell Type | Tissue | Disease Stage | Target Gene | RSS | Regulon Activity |
| ∗The dot plots of a searched regulon are shown for all cell subpopulations in each disease state of each tissue based on the regulon specific score inferred using pySCENIC and by calculating the average expression. |
| Page: 1 |
Top |
Somatic mutation of malignant transformation related genes |
| Annotation of somatic variants for genes involved in malignant transformation |
| Hugo Symbol | Variant Class | Variant Classification | dbSNP RS | HGVSc | HGVSp | HGVSp Short | SWISSPROT | BIOTYPE | SIFT | PolyPhen | Tumor Sample Barcode | Tissue | Histology | Sex | Age | Stage | Therapy Types | Drugs | Outcome |
| TFG | SNV | Missense_Mutation | c.455C>T | p.Ser152Phe | p.S152F | Q92734 | protein_coding | tolerated(0.07) | benign(0.1) | TCGA-5L-AAT1-01 | Breast | breast invasive carcinoma | Female | <65 | III/IV | Hormone Therapy | letrozol | SD | |
| TFG | SNV | Missense_Mutation | novel | c.513A>T | p.Leu171Phe | p.L171F | Q92734 | protein_coding | tolerated(0.05) | probably_damaging(0.991) | TCGA-AQ-A1H3-01 | Breast | breast invasive carcinoma | Female | <65 | III/IV | Chemotherapy | adriamycin | SD |
| TFG | SNV | Missense_Mutation | c.1165N>T | p.Gly389Cys | p.G389C | Q92734 | protein_coding | tolerated_low_confidence(0.08) | benign(0.334) | TCGA-E9-A1R2-01 | Breast | breast invasive carcinoma | Female | <65 | III/IV | Chemotherapy | taxotere | CR | |
| TFG | SNV | Missense_Mutation | novel | c.658C>T | p.Pro220Ser | p.P220S | Q92734 | protein_coding | tolerated(0.08) | benign(0.057) | TCGA-2W-A8YY-01 | Cervix | cervical & endocervical cancer | Female | <65 | I/II | Chemotherapy | cisplatin | CR |
| TFG | SNV | Missense_Mutation | c.455N>T | p.Ser152Phe | p.S152F | Q92734 | protein_coding | tolerated(0.07) | benign(0.1) | TCGA-JW-A5VL-01 | Cervix | cervical & endocervical cancer | Female | <65 | I/II | Unknown | Unknown | SD | |
| TFG | SNV | Missense_Mutation | rs146078119 | c.1147N>T | p.Arg383Cys | p.R383C | Q92734 | protein_coding | tolerated_low_confidence(0.05) | benign(0.005) | TCGA-AA-3715-01 | Colorectum | colon adenocarcinoma | Male | >=65 | I/II | Unknown | Unknown | PD |
| TFG | SNV | Missense_Mutation | novel | c.519N>A | p.Asn173Lys | p.N173K | Q92734 | protein_coding | tolerated(0.06) | probably_damaging(0.979) | TCGA-AA-3984-01 | Colorectum | colon adenocarcinoma | Female | <65 | I/II | Unknown | Unknown | SD |
| TFG | SNV | Missense_Mutation | novel | c.519C>A | p.Asn173Lys | p.N173K | Q92734 | protein_coding | tolerated(0.06) | probably_damaging(0.979) | TCGA-AA-A010-01 | Colorectum | colon adenocarcinoma | Female | <65 | I/II | Chemotherapy | folinic | CR |
| TFG | SNV | Missense_Mutation | rs373719892 | c.1154G>A | p.Arg385His | p.R385H | Q92734 | protein_coding | deleterious_low_confidence(0.01) | probably_damaging(0.987) | TCGA-AA-A010-01 | Colorectum | colon adenocarcinoma | Female | <65 | I/II | Chemotherapy | folinic | CR |
| TFG | SNV | Missense_Mutation | rs774808090 | c.68N>A | p.Arg23Gln | p.R23Q | Q92734 | protein_coding | deleterious(0) | possibly_damaging(0.552) | TCGA-AZ-4315-01 | Colorectum | colon adenocarcinoma | Male | <65 | I/II | Unknown | Unknown | SD |
| Page: 1 2 3 4 |
Top |
Related drugs of malignant transformation related genes |
| Identification of chemicals and drugs interact with genes involved in malignant transfromation |
| (DGIdb 4.0) |
| Entrez ID | Symbol | Category | Interaction Types | Drug Claim Name | Drug Name | PMIDs |
| Page: 1 |

Copyright 2023-Present -The University of Texas Health Science Center at Houston |