| Tissue | Expression Dynamics | Abbreviation |
| Cervix | 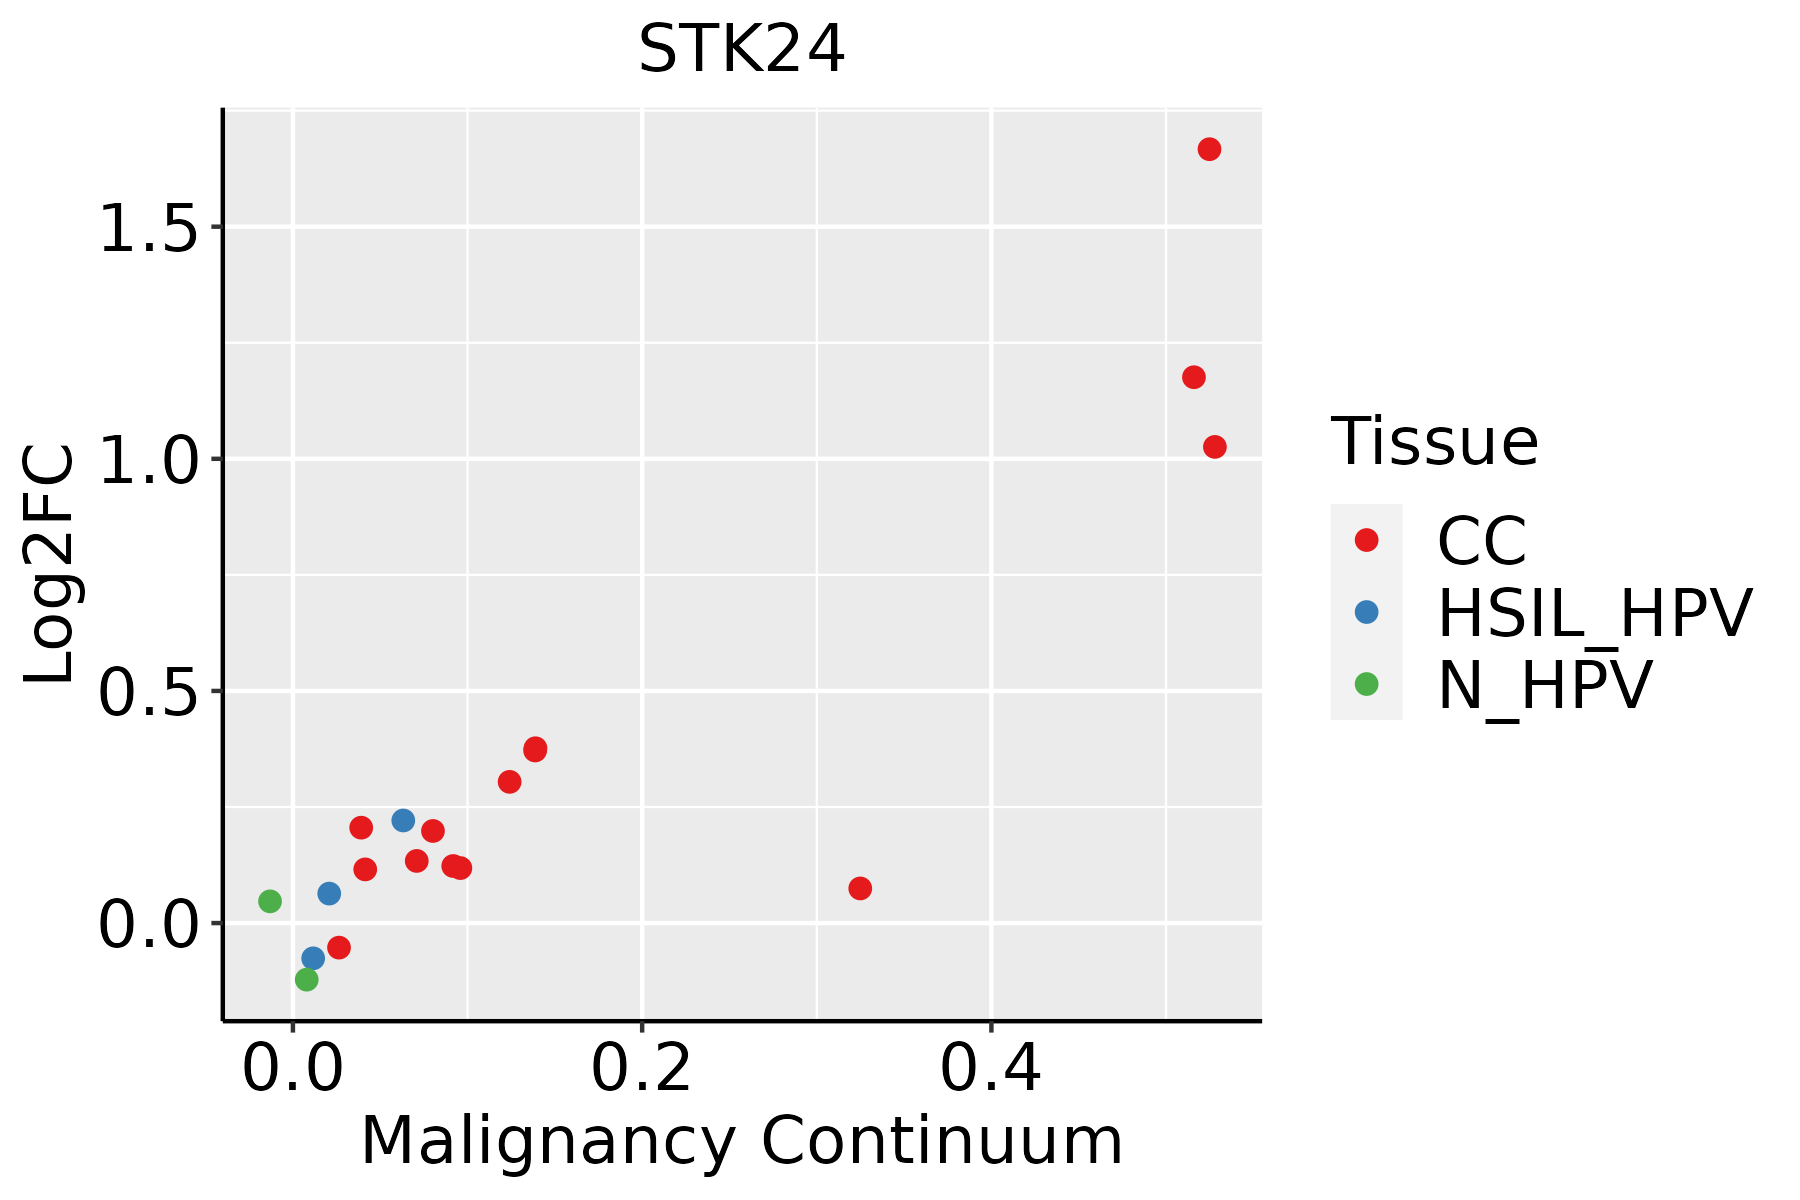 | CC: Cervix cancer |
| HSIL_HPV: HPV-infected high-grade squamous intraepithelial lesions |
| N_HPV: HPV-infected normal cervix |
| Colorectum (GSE201348) |  | FAP: Familial adenomatous polyposis |
| CRC: Colorectal cancer |
| Colorectum (HTA11) |  | AD: Adenomas |
| SER: Sessile serrated lesions |
| MSI-H: Microsatellite-high colorectal cancer |
| MSS: Microsatellite stable colorectal cancer |
| Esophagus | 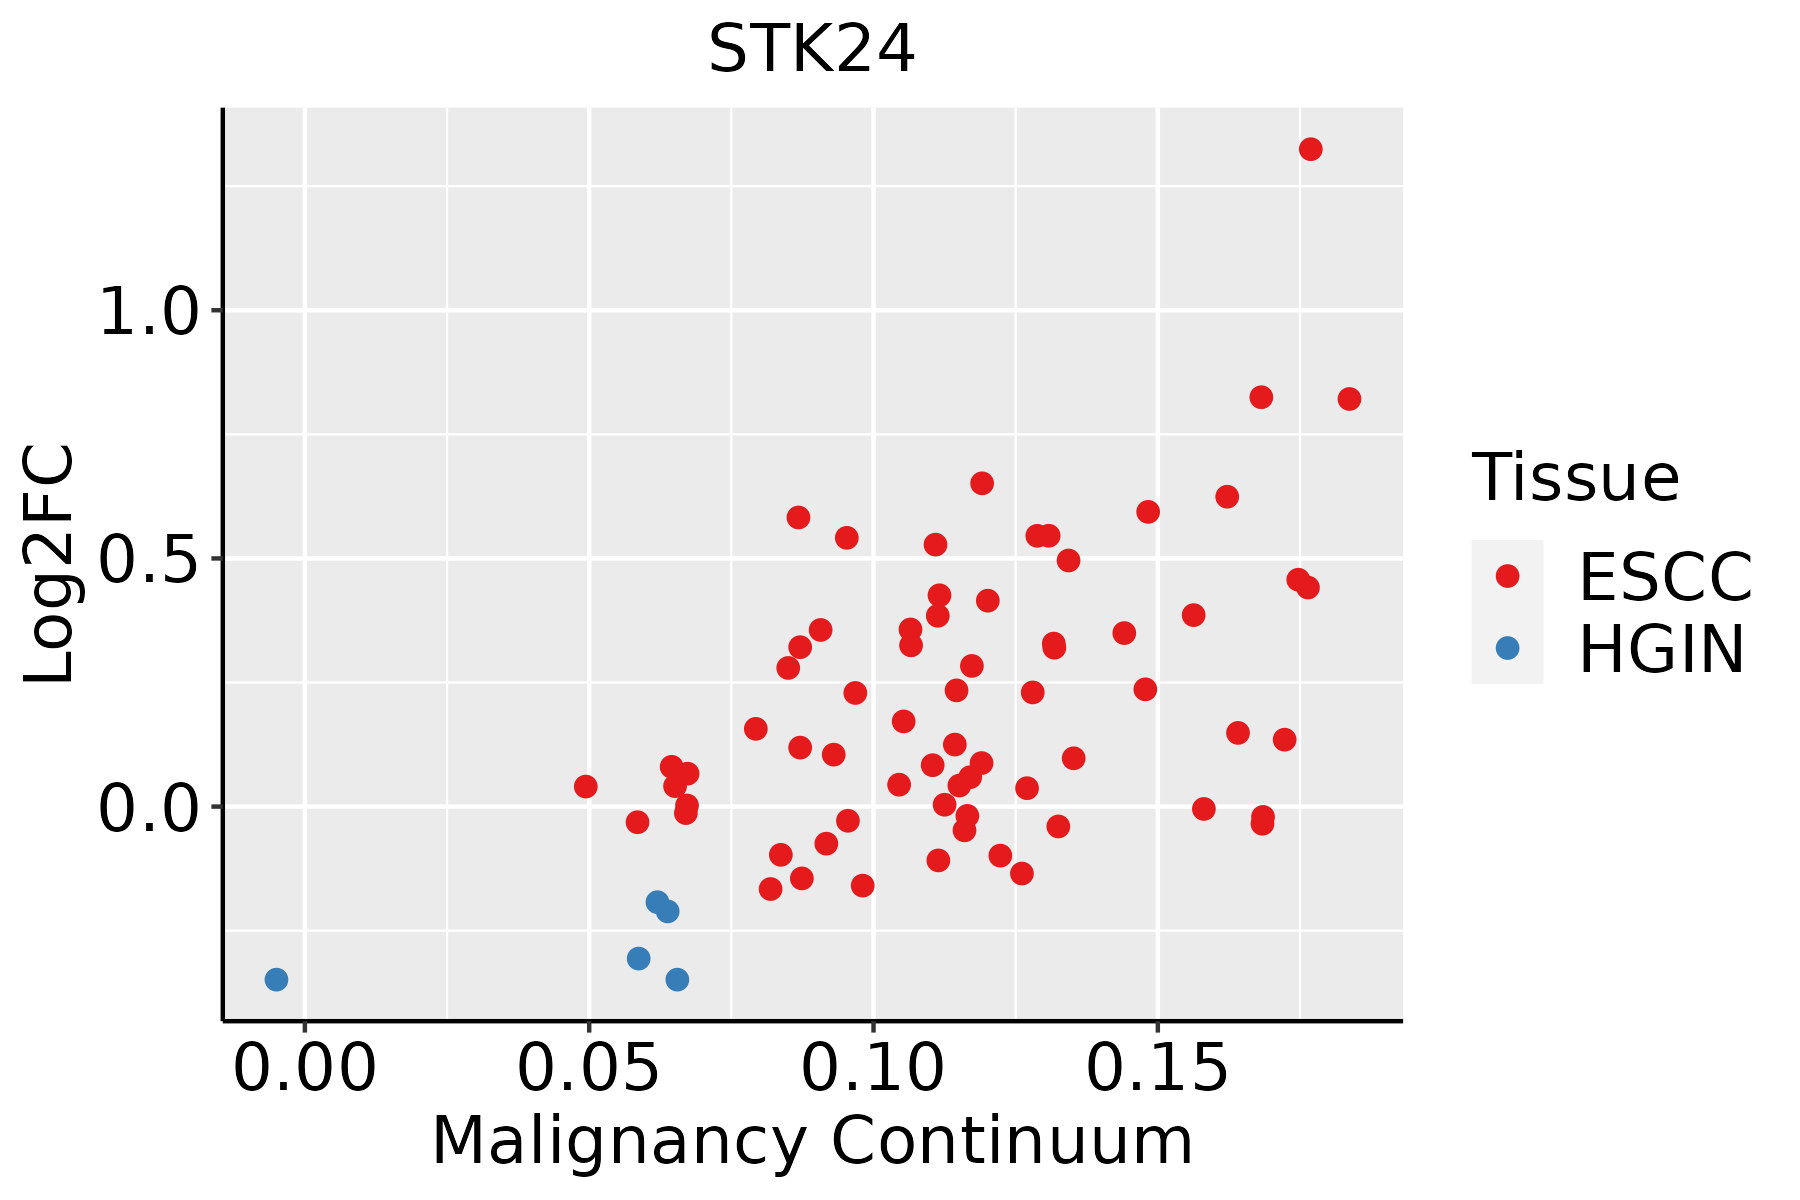 | ESCC: Esophageal squamous cell carcinoma |
| HGIN: High-grade intraepithelial neoplasias |
| LGIN: Low-grade intraepithelial neoplasias |
| GC |  | CAG: Chronic atrophic gastritis |
| CAG with IM: Chronic atrophic gastritis with intestinal metaplasia |
| CSG: Chronic superficial gastritis |
| GC: Gastric cancer |
| SIM: Severe intestinal metaplasia |
| WIM: Wild intestinal metaplasia |
| Liver |  | HCC: Hepatocellular carcinoma |
| NAFLD: Non-alcoholic fatty liver disease |
| Lung | 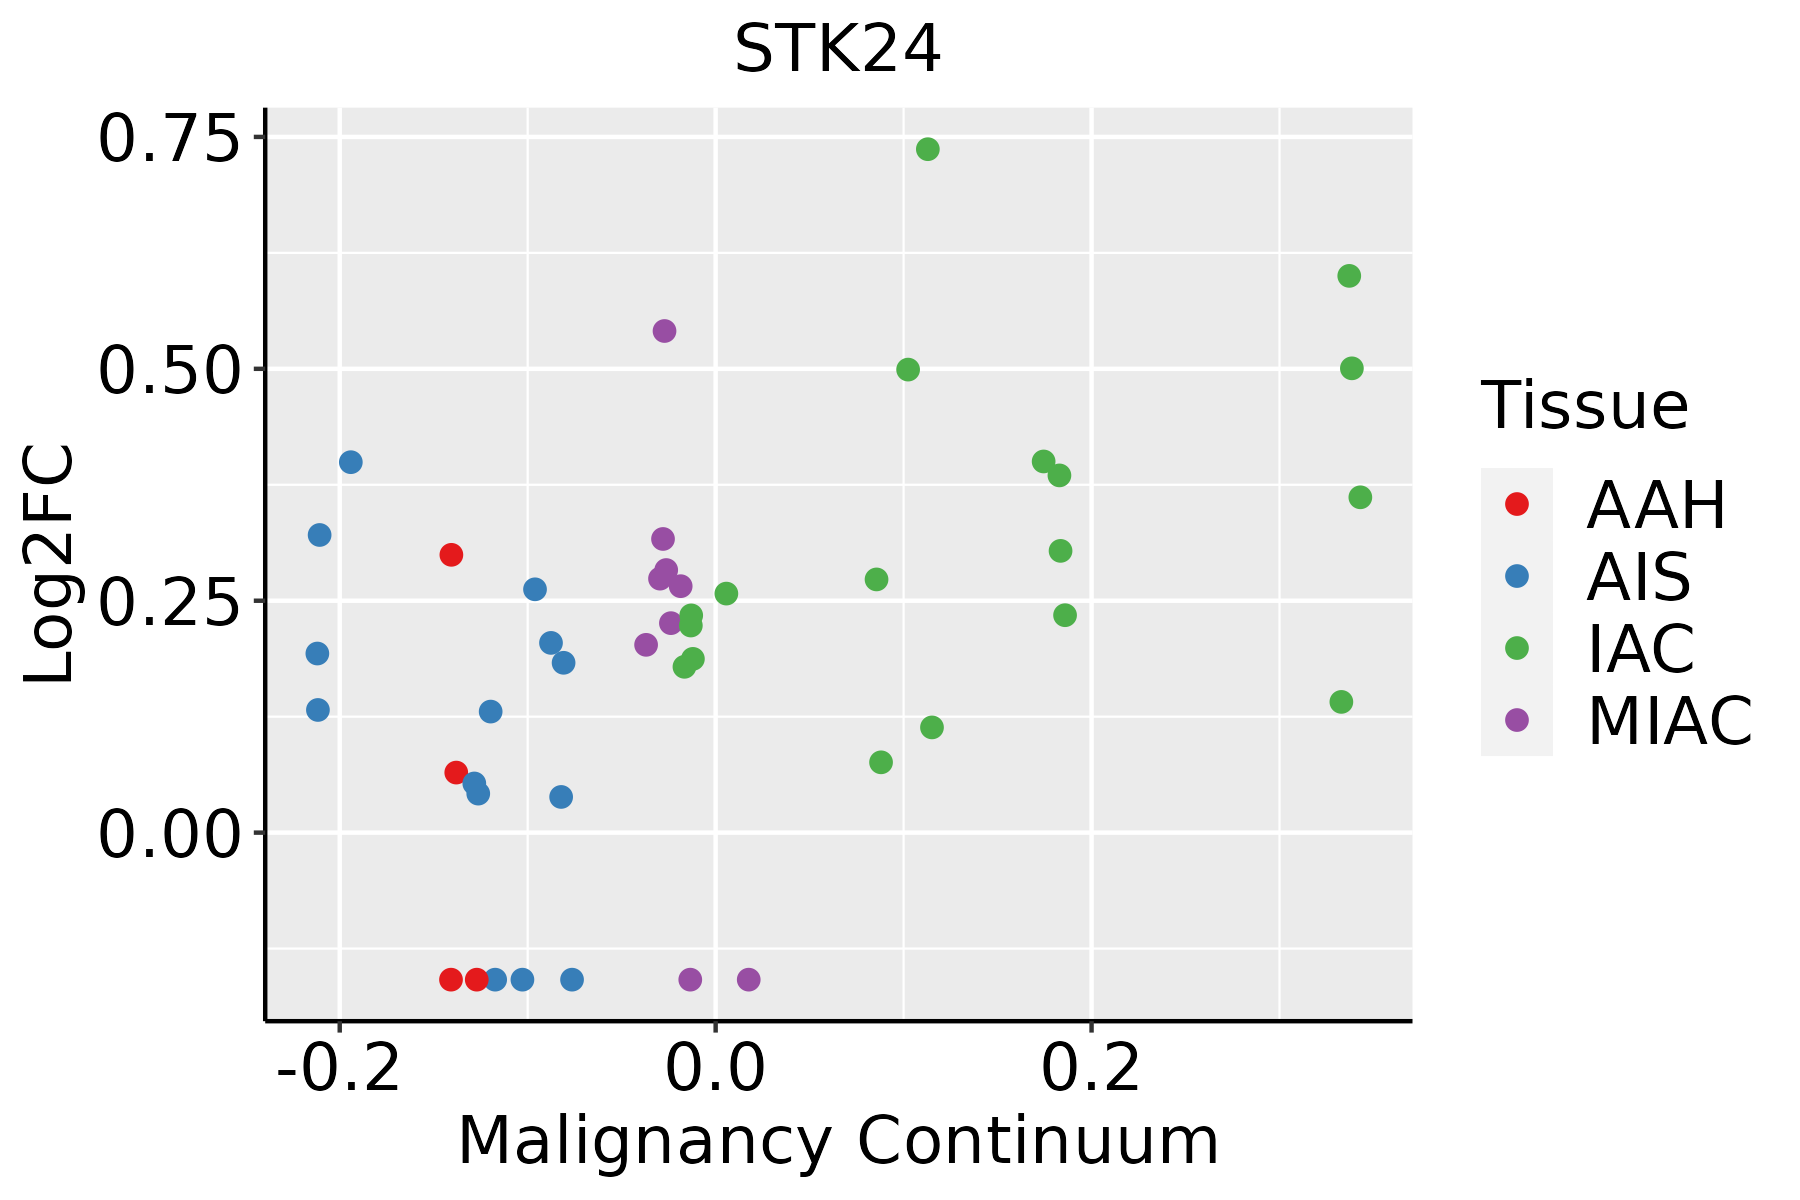 | AAH: Atypical adenomatous hyperplasia |
| AIS: Adenocarcinoma in situ |
| IAC: Invasive lung adenocarcinoma |
| MIA: Minimally invasive adenocarcinoma |
| Oral Cavity |  | EOLP: Erosive Oral lichen planus |
| LP: leukoplakia |
| NEOLP: Non-erosive oral lichen planus |
| OSCC: Oral squamous cell carcinoma |
| Skin |  | AK: Actinic keratosis |
| cSCC: Cutaneous squamous cell carcinoma |
| SCCIS:squamous cell carcinoma in situ |
| Thyroid | 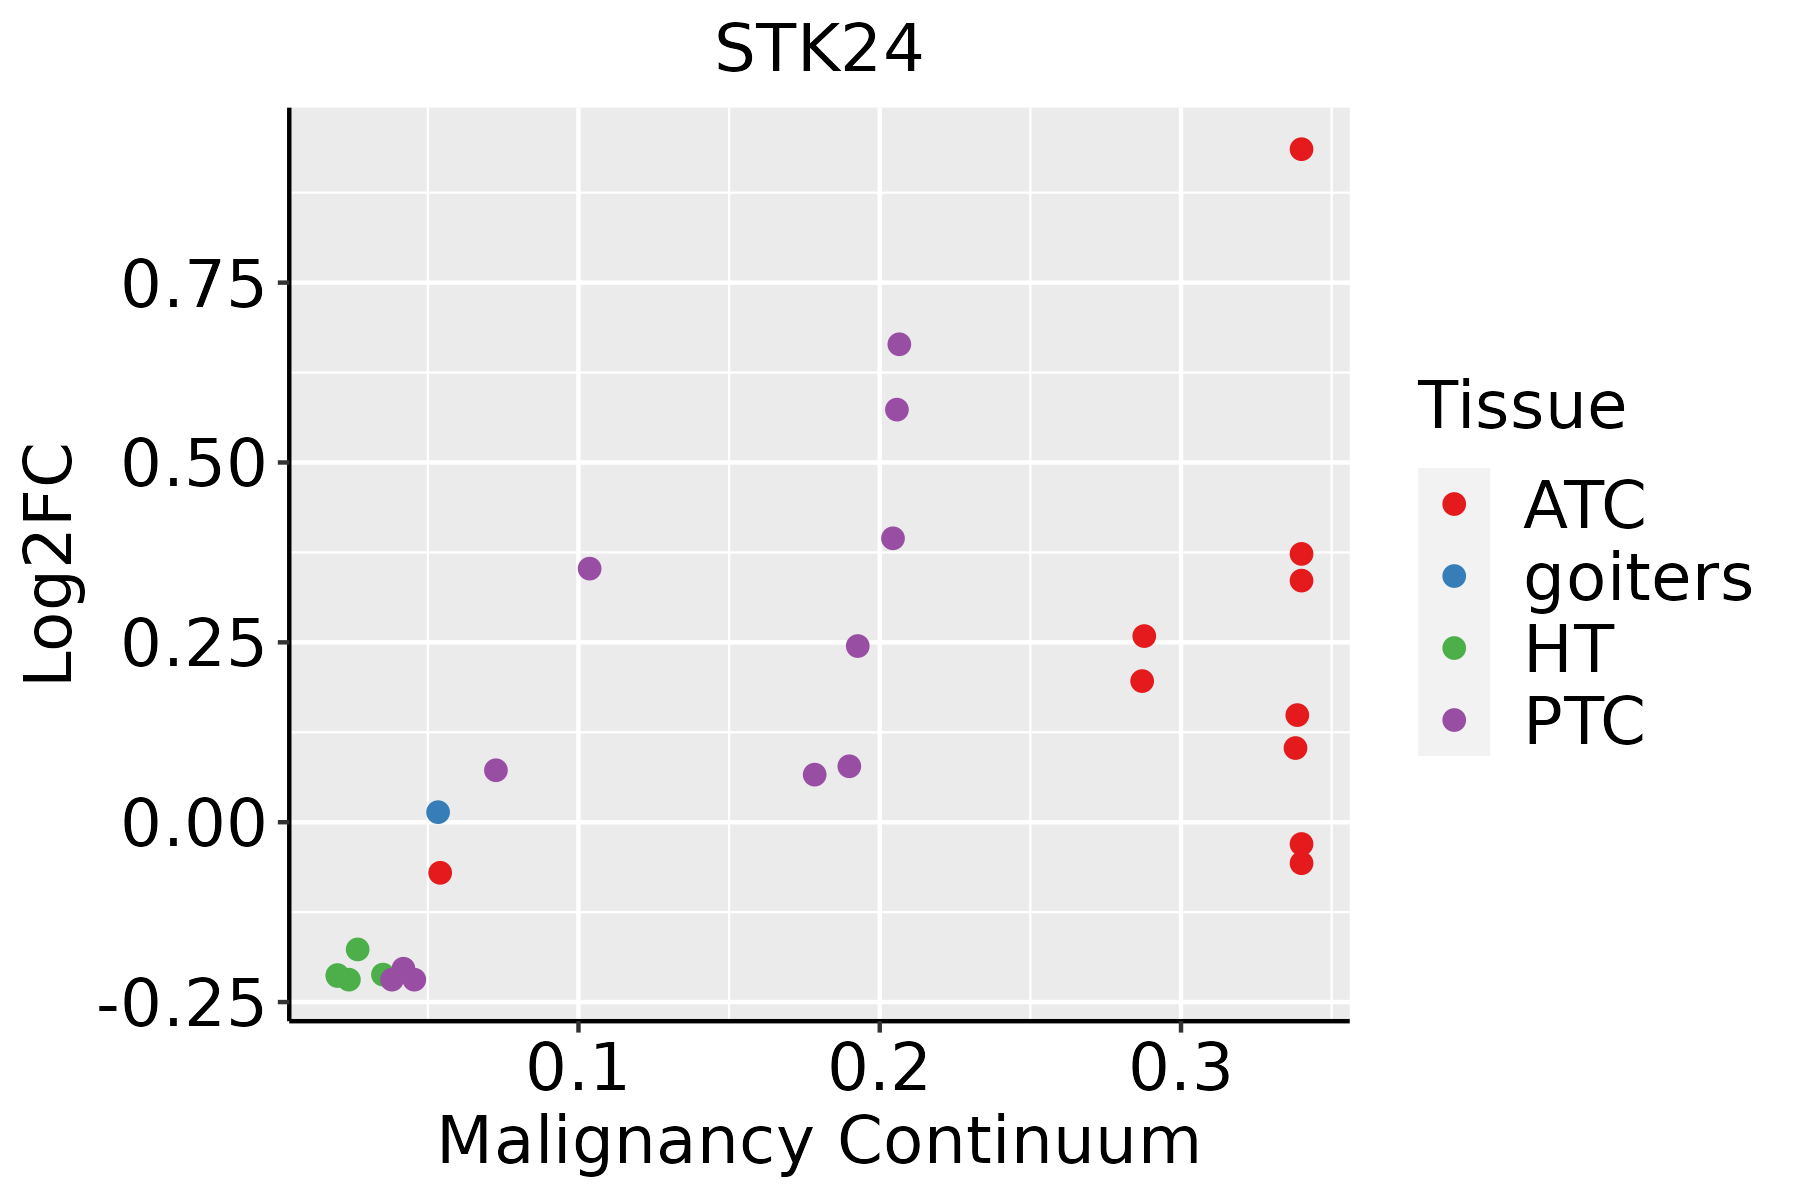 | ATC: Anaplastic thyroid cancer |
| HT: Hashimoto's thyroiditis |
| PTC: Papillary thyroid cancer |
| GO ID | Tissue | Disease Stage | Description | Gene Ratio | Bg Ratio | pvalue | p.adjust | Count |
| GO:00310992 | Liver | HCC | regeneration | 107/7958 | 198/18723 | 6.67e-04 | 4.12e-03 | 107 |
| GO:001097511 | Liver | HCC | regulation of neuron projection development | 220/7958 | 445/18723 | 1.68e-03 | 8.78e-03 | 220 |
| GO:003647312 | Liver | HCC | cell death in response to oxidative stress | 55/7958 | 95/18723 | 1.76e-03 | 9.12e-03 | 55 |
| GO:0097194 | Liver | HCC | execution phase of apoptosis | 48/7958 | 85/18723 | 6.47e-03 | 2.63e-02 | 48 |
| GO:00971938 | Lung | IAC | intrinsic apoptotic signaling pathway | 72/2061 | 288/18723 | 1.36e-11 | 4.83e-09 | 72 |
| GO:00467776 | Lung | IAC | protein autophosphorylation | 51/2061 | 227/18723 | 4.85e-07 | 3.10e-05 | 51 |
| GO:00109756 | Lung | IAC | regulation of neuron projection development | 82/2061 | 445/18723 | 1.82e-06 | 8.78e-05 | 82 |
| GO:00069798 | Lung | IAC | response to oxidative stress | 82/2061 | 446/18723 | 1.99e-06 | 9.18e-05 | 82 |
| GO:00621978 | Lung | IAC | cellular response to chemical stress | 64/2061 | 337/18723 | 8.92e-06 | 3.01e-04 | 64 |
| GO:00714968 | Lung | IAC | cellular response to external stimulus | 60/2061 | 320/18723 | 2.50e-05 | 6.76e-04 | 60 |
| GO:00316687 | Lung | IAC | cellular response to extracellular stimulus | 48/2061 | 246/18723 | 5.62e-05 | 1.24e-03 | 48 |
| GO:00345998 | Lung | IAC | cellular response to oxidative stress | 54/2061 | 288/18723 | 6.20e-05 | 1.35e-03 | 54 |
| GO:00003028 | Lung | IAC | response to reactive oxygen species | 44/2061 | 222/18723 | 7.69e-05 | 1.59e-03 | 44 |
| GO:00615646 | Lung | IAC | axon development | 78/2061 | 467/18723 | 1.12e-04 | 2.15e-03 | 78 |
| GO:00316696 | Lung | IAC | cellular response to nutrient levels | 41/2061 | 215/18723 | 3.13e-04 | 4.98e-03 | 41 |
| GO:00316678 | Lung | IAC | response to nutrient levels | 76/2061 | 474/18723 | 4.87e-04 | 7.08e-03 | 76 |
| GO:00425428 | Lung | IAC | response to hydrogen peroxide | 28/2061 | 146/18723 | 2.39e-03 | 2.31e-02 | 28 |
| GO:00364738 | Lung | IAC | cell death in response to oxidative stress | 20/2061 | 95/18723 | 3.15e-03 | 2.75e-02 | 20 |
| GO:00092676 | Lung | IAC | cellular response to starvation | 29/2061 | 156/18723 | 3.26e-03 | 2.80e-02 | 29 |
| GO:2000146 | Lung | IAC | negative regulation of cell motility | 56/2061 | 359/18723 | 4.58e-03 | 3.62e-02 | 56 |
| Hugo Symbol | Variant Class | Variant Classification | dbSNP RS | HGVSc | HGVSp | HGVSp Short | SWISSPROT | BIOTYPE | SIFT | PolyPhen | Tumor Sample Barcode | Tissue | Histology | Sex | Age | Stage | Therapy Types | Drugs | Outcome |
| STK24 | SNV | Missense_Mutation | novel | c.1008N>G | p.Asp336Glu | p.D336E | Q9Y6E0 | protein_coding | tolerated(0.65) | benign(0) | TCGA-AC-A3W5-01 | Breast | breast invasive carcinoma | Female | >=65 | I/II | Chemotherapy | docetaxel | CR |
| STK24 | SNV | Missense_Mutation | novel | c.225N>T | p.Glu75Asp | p.E75D | Q9Y6E0 | protein_coding | tolerated(0.13) | benign(0.125) | TCGA-AN-A046-01 | Breast | breast invasive carcinoma | Female | >=65 | I/II | Unknown | Unknown | SD |
| STK24 | SNV | Missense_Mutation | novel | c.1153G>A | p.Ala385Thr | p.A385T | Q9Y6E0 | protein_coding | tolerated_low_confidence(0.21) | benign(0.003) | TCGA-EW-A6SB-01 | Breast | breast invasive carcinoma | Female | <65 | I/II | Unknown | Unknown | SD |
| STK24 | SNV | Missense_Mutation | rs748012213 | c.952G>A | p.Glu318Lys | p.E318K | Q9Y6E0 | protein_coding | tolerated(0.11) | benign(0.251) | TCGA-2W-A8YY-01 | Cervix | cervical & endocervical cancer | Female | <65 | I/II | Chemotherapy | cisplatin | CR |
| STK24 | SNV | Missense_Mutation | novel | c.1254N>G | p.Ile418Met | p.I418M | Q9Y6E0 | protein_coding | deleterious_low_confidence(0) | possibly_damaging(0.861) | TCGA-VS-A8EL-01 | Cervix | cervical & endocervical cancer | Female | <65 | I/II | Chemotherapy | cisplatin | CR |
| STK24 | SNV | Missense_Mutation | rs200464604 | c.1214N>A | p.Arg405Gln | p.R405Q | Q9Y6E0 | protein_coding | tolerated_low_confidence(0.15) | benign(0.001) | TCGA-VS-A9V2-01 | Cervix | cervical & endocervical cancer | Female | <65 | I/II | Unknown | Unknown | SD |
| STK24 | SNV | Missense_Mutation | | c.113A>C | p.Lys38Thr | p.K38T | Q9Y6E0 | protein_coding | deleterious(0.04) | possibly_damaging(0.74) | TCGA-A6-6141-01 | Colorectum | colon adenocarcinoma | Male | <65 | I/II | Chemotherapy | 5-fu | SD |
| STK24 | SNV | Missense_Mutation | | c.493N>C | p.Ser165Pro | p.S165P | Q9Y6E0 | protein_coding | deleterious(0) | probably_damaging(0.997) | TCGA-AA-3663-01 | Colorectum | colon adenocarcinoma | Male | <65 | I/II | Unknown | Unknown | SD |
| STK24 | SNV | Missense_Mutation | rs367740523 | c.355G>A | p.Ala119Thr | p.A119T | Q9Y6E0 | protein_coding | deleterious(0) | probably_damaging(0.963) | TCGA-AA-3864-01 | Colorectum | colon adenocarcinoma | Male | >=65 | I/II | Unknown | Unknown | SD |
| STK24 | SNV | Missense_Mutation | novel | c.892G>A | p.Glu298Lys | p.E298K | Q9Y6E0 | protein_coding | deleterious(0) | possibly_damaging(0.588) | TCGA-AA-3984-01 | Colorectum | colon adenocarcinoma | Female | <65 | I/II | Unknown | Unknown | SD |


