
|
|||||
|
 | |
| |
| |
| |
| |
| |
|
Gene: STAU1 |
Gene summary for STAU1 |
| Gene information | Species | Human | Gene symbol | STAU1 | Gene ID | 6780 |
| Gene name | staufen double-stranded RNA binding protein 1 | |
| Gene Alias | PPP1R150 | |
| Cytomap | 20q13.13 | |
| Gene Type | protein-coding | GO ID | GO:0006950 | UniProtAcc | B3KRE0 |
Top |
Malignant transformation analysis |
| Identification of the aberrant gene expression in precancerous and cancerous lesions by comparing the gene expression of stem-like cells in diseased tissues with normal stem cells |
| Entrez ID | Symbol | Replicates | Species | Organ | Tissue | Adj P-value | Log2FC | Malignancy |
| 6780 | STAU1 | HTA11_3410_2000001011 | Human | Colorectum | AD | 8.89e-03 | -3.32e-01 | 0.0155 |
| 6780 | STAU1 | HTA11_347_2000001011 | Human | Colorectum | AD | 2.07e-06 | 3.82e-01 | -0.1954 |
| 6780 | STAU1 | HTA11_99999965062_69753 | Human | Colorectum | MSI-H | 1.18e-06 | 1.21e+00 | 0.3487 |
| 6780 | STAU1 | HTA11_99999965104_69814 | Human | Colorectum | MSS | 9.55e-06 | 6.01e-01 | 0.281 |
| 6780 | STAU1 | HTA11_99999971662_82457 | Human | Colorectum | MSS | 2.16e-10 | 9.52e-01 | 0.3859 |
| 6780 | STAU1 | A015-C-203 | Human | Colorectum | FAP | 8.16e-20 | -1.54e-01 | -0.1294 |
| 6780 | STAU1 | A015-C-204 | Human | Colorectum | FAP | 4.50e-02 | -2.01e-01 | -0.0228 |
| 6780 | STAU1 | A014-C-040 | Human | Colorectum | FAP | 4.82e-03 | -4.14e-01 | -0.1184 |
| 6780 | STAU1 | A002-C-201 | Human | Colorectum | FAP | 3.21e-05 | -9.57e-02 | 0.0324 |
| 6780 | STAU1 | A002-C-203 | Human | Colorectum | FAP | 3.51e-03 | -1.03e-01 | 0.2786 |
| 6780 | STAU1 | A001-C-119 | Human | Colorectum | FAP | 3.79e-03 | 1.63e-01 | -0.1557 |
| 6780 | STAU1 | A001-C-108 | Human | Colorectum | FAP | 3.64e-11 | -1.84e-01 | -0.0272 |
| 6780 | STAU1 | A002-C-205 | Human | Colorectum | FAP | 3.43e-12 | -1.54e-01 | -0.1236 |
| 6780 | STAU1 | A015-C-006 | Human | Colorectum | FAP | 1.07e-09 | -3.08e-01 | -0.0994 |
| 6780 | STAU1 | A015-C-106 | Human | Colorectum | FAP | 4.69e-08 | -1.46e-01 | -0.0511 |
| 6780 | STAU1 | A002-C-114 | Human | Colorectum | FAP | 1.10e-10 | -2.75e-01 | -0.1561 |
| 6780 | STAU1 | A015-C-104 | Human | Colorectum | FAP | 1.53e-22 | -3.74e-01 | -0.1899 |
| 6780 | STAU1 | A001-C-014 | Human | Colorectum | FAP | 8.29e-09 | -1.64e-01 | 0.0135 |
| 6780 | STAU1 | A002-C-016 | Human | Colorectum | FAP | 1.07e-16 | -2.12e-01 | 0.0521 |
| 6780 | STAU1 | A015-C-002 | Human | Colorectum | FAP | 4.01e-06 | -2.44e-01 | -0.0763 |
| Page: 1 2 3 4 5 6 7 8 |
| Tissue | Expression Dynamics | Abbreviation |
| Colorectum (GSE201348) |  | FAP: Familial adenomatous polyposis |
| CRC: Colorectal cancer | ||
| Colorectum (HTA11) |  | AD: Adenomas |
| SER: Sessile serrated lesions | ||
| MSI-H: Microsatellite-high colorectal cancer | ||
| MSS: Microsatellite stable colorectal cancer | ||
| Esophagus |  | ESCC: Esophageal squamous cell carcinoma |
| HGIN: High-grade intraepithelial neoplasias | ||
| LGIN: Low-grade intraepithelial neoplasias | ||
| Liver | 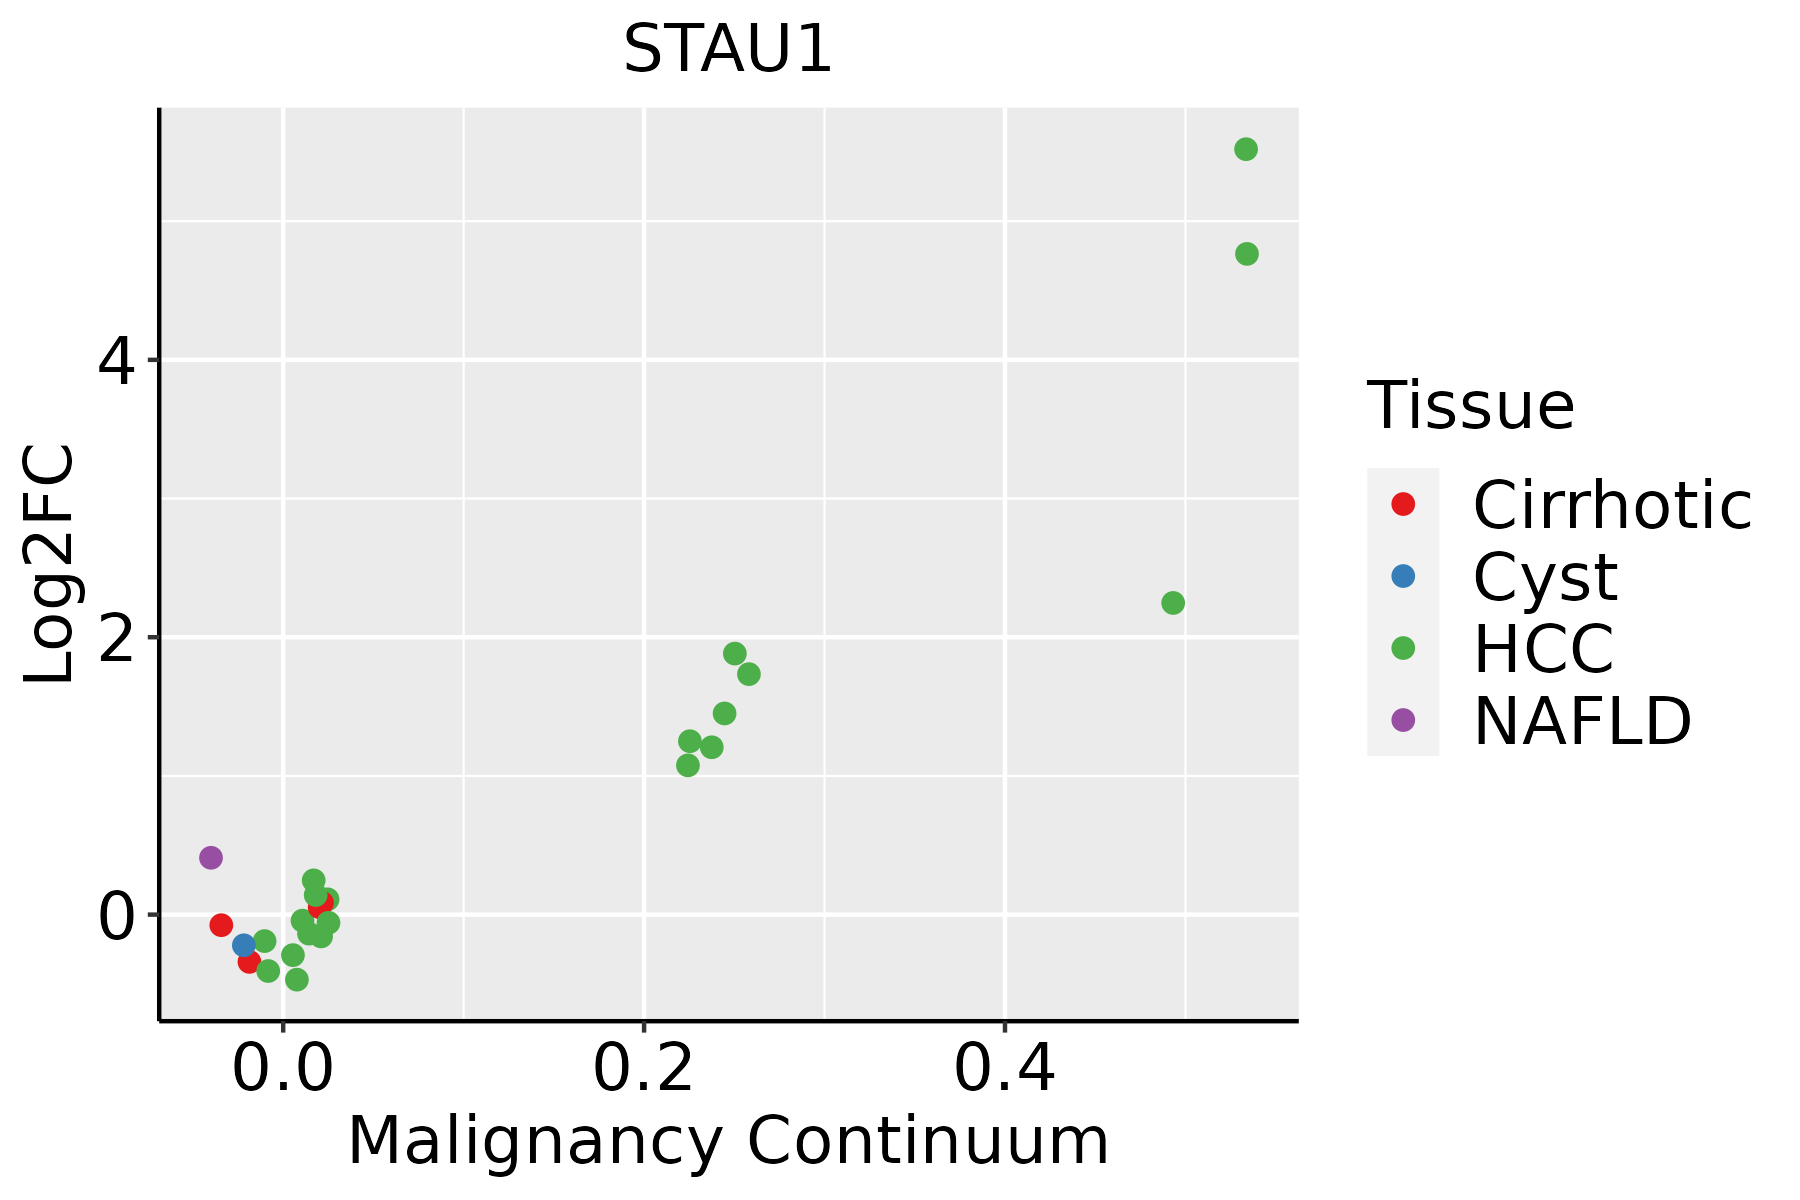 | HCC: Hepatocellular carcinoma |
| NAFLD: Non-alcoholic fatty liver disease | ||
| Oral Cavity |  | EOLP: Erosive Oral lichen planus |
| LP: leukoplakia | ||
| NEOLP: Non-erosive oral lichen planus | ||
| OSCC: Oral squamous cell carcinoma | ||
| Skin | 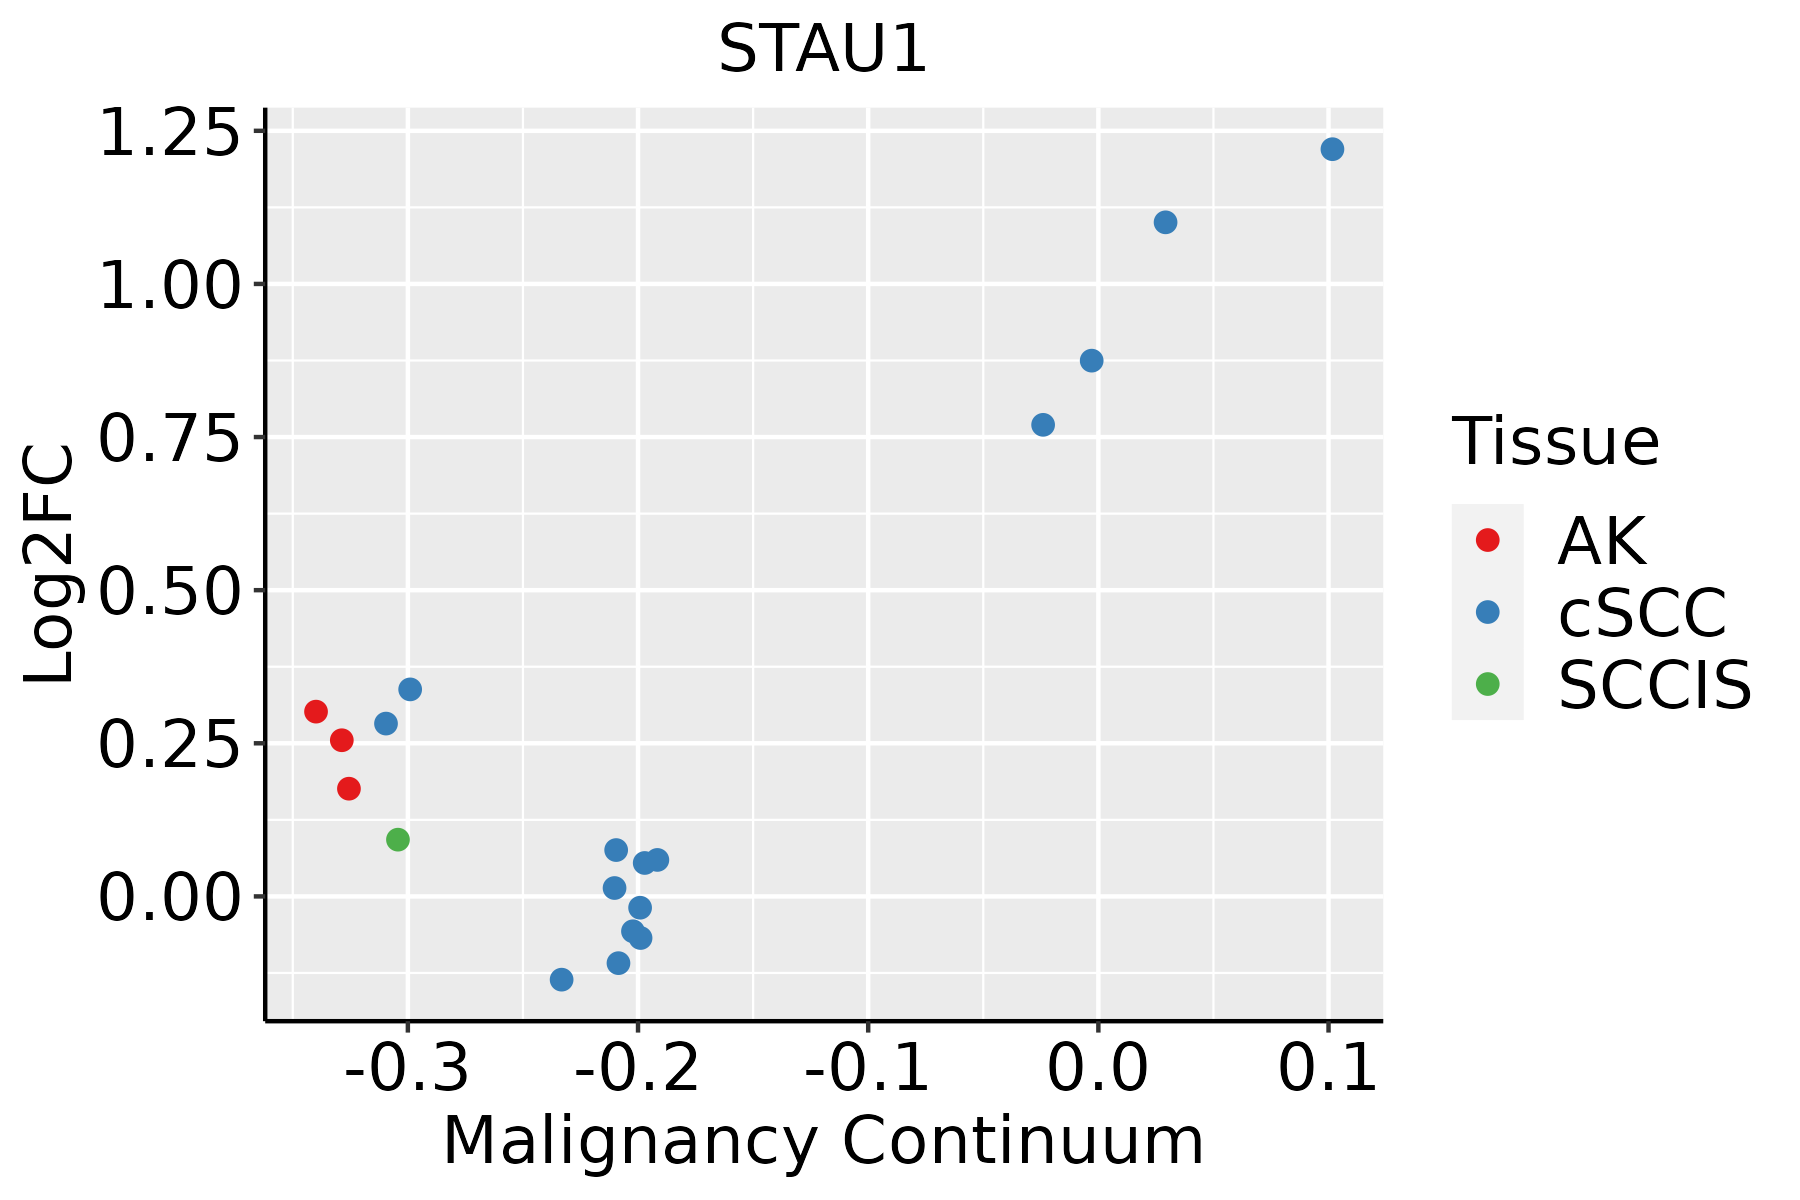 | AK: Actinic keratosis |
| cSCC: Cutaneous squamous cell carcinoma | ||
| SCCIS:squamous cell carcinoma in situ | ||
| Thyroid | 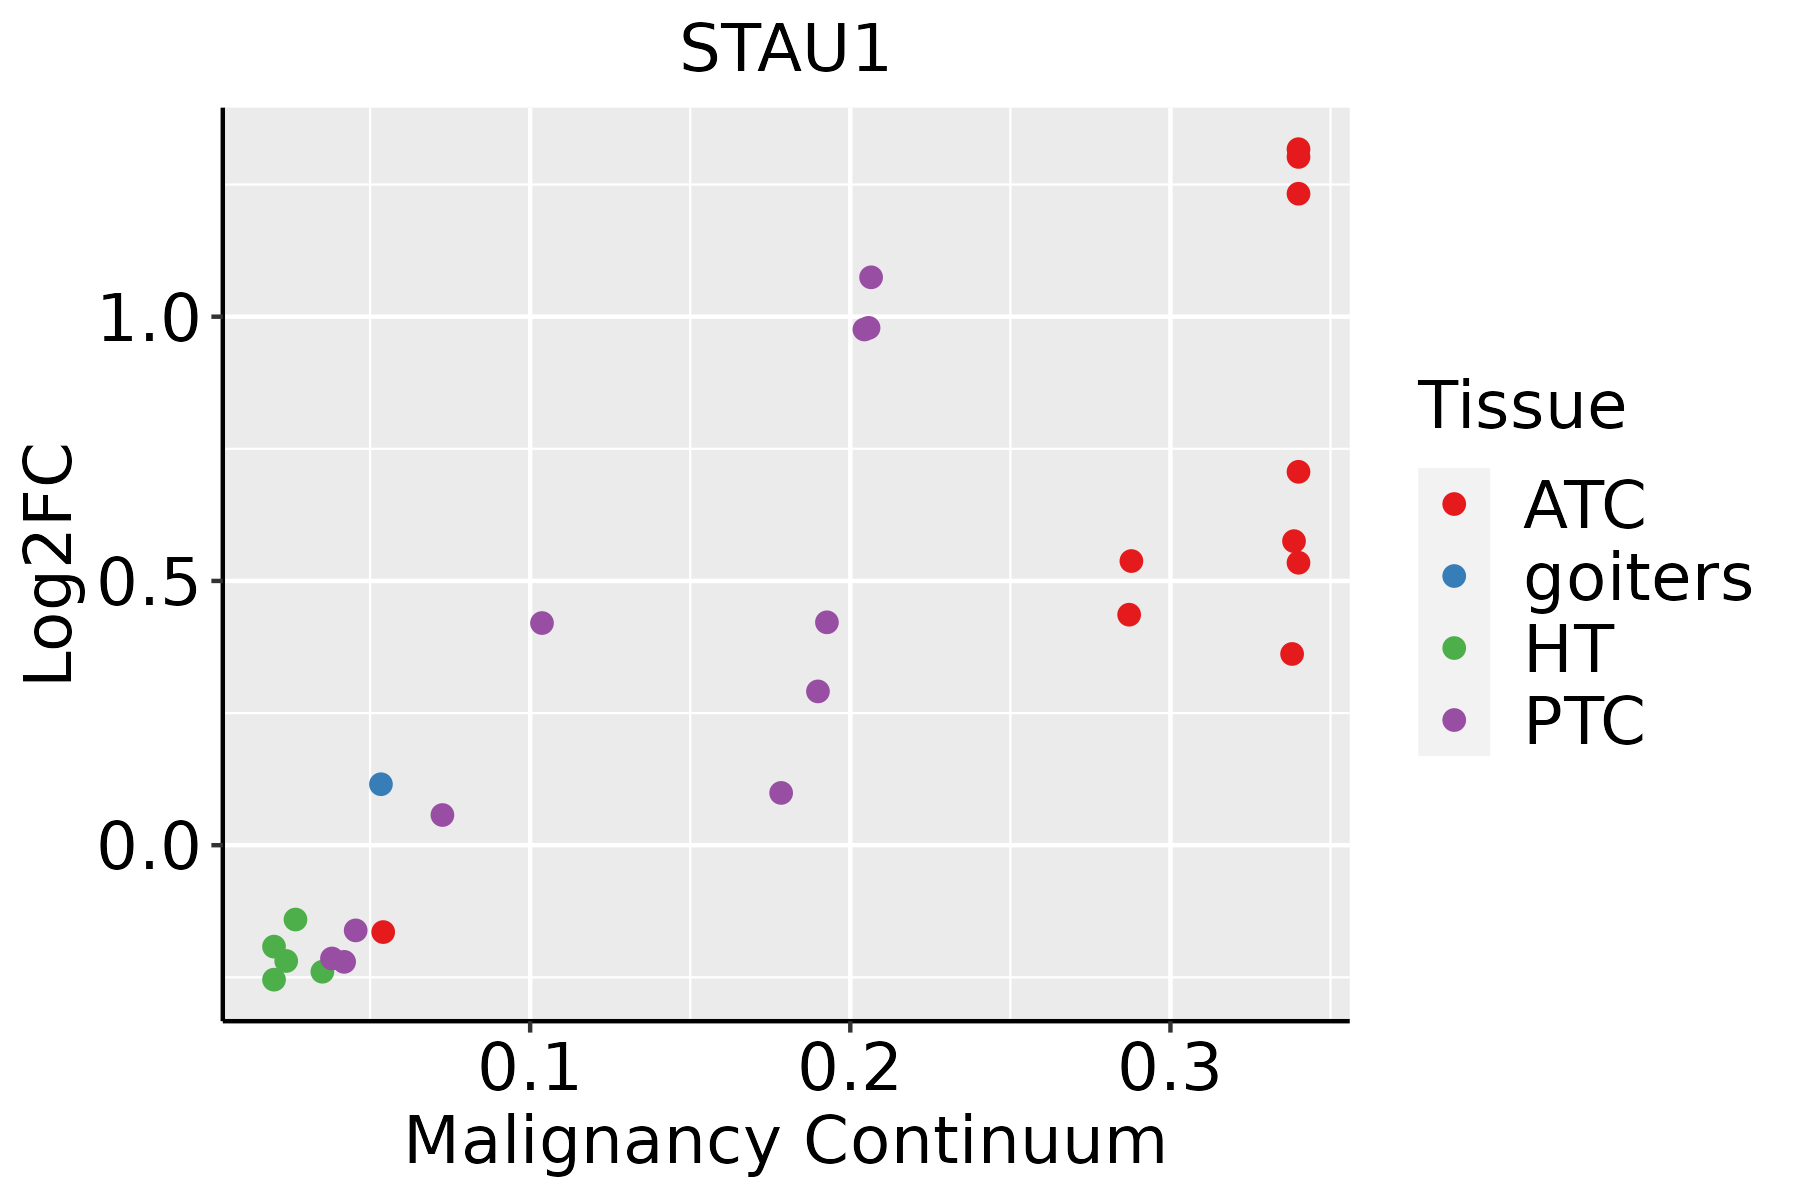 | ATC: Anaplastic thyroid cancer |
| HT: Hashimoto's thyroiditis | ||
| PTC: Papillary thyroid cancer |
| ∗log2FC in expression of this searched gene in stem-like cells from each diseased tissue sample relative to stem-like cells in normal samples in each tissue plotted against the malignancy continuum. Samples are colored based on if they are from different disease stage. |
Top |
Malignant transformation related pathway analysis |
| Find out the enriched GO biological processes and KEGG pathways involved in transition from healthy to precancer to cancer |
| Tissue | Disease Stage | Enriched GO biological Processes |
| Colorectum | AD |  |
| Colorectum | SER |  |
| Colorectum | MSS |  |
| Colorectum | MSI-H |  |
| Colorectum | FAP |  |
| ∗Top 15 enriched GO BP terms are showed in the bar plot of each disease state in each tissue. Each row represents a significant GO biological process which is colored according to the -log10(p.adjust). |
| Page: 1 2 3 4 5 6 7 8 9 |
| GO ID | Tissue | Disease Stage | Description | Gene Ratio | Bg Ratio | pvalue | p.adjust | Count |
| GO:001907927 | Skin | AK | viral genome replication | 36/1910 | 131/18723 | 1.99e-08 | 1.17e-06 | 36 |
| GO:006219728 | Skin | AK | cellular response to chemical stress | 66/1910 | 337/18723 | 1.46e-07 | 6.32e-06 | 66 |
| GO:004852420 | Skin | AK | positive regulation of viral process | 20/1910 | 65/18723 | 4.16e-06 | 1.02e-04 | 20 |
| GO:003459927 | Skin | AK | cellular response to oxidative stress | 53/1910 | 288/18723 | 1.56e-05 | 3.05e-04 | 53 |
| GO:00508088 | Skin | AK | synapse organization | 71/1910 | 426/18723 | 2.21e-05 | 4.07e-04 | 71 |
| GO:005079226 | Skin | AK | regulation of viral process | 34/1910 | 164/18723 | 4.45e-05 | 7.03e-04 | 34 |
| GO:004507010 | Skin | AK | positive regulation of viral genome replication | 11/1910 | 30/18723 | 1.05e-04 | 1.38e-03 | 11 |
| GO:190390026 | Skin | AK | regulation of viral life cycle | 30/1910 | 148/18723 | 1.85e-04 | 2.12e-03 | 30 |
| GO:00990105 | Skin | AK | modification of postsynaptic structure | 7/1910 | 16/18723 | 5.66e-04 | 5.06e-03 | 7 |
| GO:004506920 | Skin | AK | regulation of viral genome replication | 19/1910 | 85/18723 | 7.79e-04 | 6.50e-03 | 19 |
| GO:00995636 | Skin | AK | modification of synaptic structure | 8/1910 | 22/18723 | 9.95e-04 | 7.87e-03 | 8 |
| GO:001603229 | Skin | cSCC | viral process | 211/4864 | 415/18723 | 7.04e-28 | 2.76e-25 | 211 |
| GO:001905829 | Skin | cSCC | viral life cycle | 157/4864 | 317/18723 | 1.29e-19 | 1.88e-17 | 157 |
| GO:0019079112 | Skin | cSCC | viral genome replication | 76/4864 | 131/18723 | 7.80e-15 | 5.76e-13 | 76 |
| GO:000697929 | Skin | cSCC | response to oxidative stress | 184/4864 | 446/18723 | 8.57e-13 | 4.89e-11 | 184 |
| GO:006219729 | Skin | cSCC | cellular response to chemical stress | 138/4864 | 337/18723 | 1.10e-09 | 4.23e-08 | 138 |
| GO:0048524111 | Skin | cSCC | positive regulation of viral process | 40/4864 | 65/18723 | 1.60e-09 | 5.97e-08 | 40 |
| GO:0050792112 | Skin | cSCC | regulation of viral process | 77/4864 | 164/18723 | 5.38e-09 | 1.78e-07 | 77 |
| GO:0045069111 | Skin | cSCC | regulation of viral genome replication | 46/4864 | 85/18723 | 3.08e-08 | 8.30e-07 | 46 |
| GO:003459928 | Skin | cSCC | cellular response to oxidative stress | 117/4864 | 288/18723 | 3.37e-08 | 8.95e-07 | 117 |
| Page: 1 2 3 4 5 6 7 8 9 10 |
| Pathway ID | Tissue | Disease Stage | Description | Gene Ratio | Bg Ratio | pvalue | p.adjust | qvalue | Count |
| Page: 1 |
Top |
Cell-cell communication analysis |
| Identification of potential cell-cell interactions between two cell types and their ligand-receptor pairs for different disease states |
| Ligand | Receptor | LRpair | Pathway | Tissue | Disease Stage |
| Page: 1 |
Top |
Single-cell gene regulatory network inference analysis |
| Find out the significant the regulons (TFs) and the target genes of each regulon across cell types for different disease states |
| TF | Cell Type | Tissue | Disease Stage | Target Gene | RSS | Regulon Activity |
| ∗The dot plots of a searched regulon are shown for all cell subpopulations in each disease state of each tissue based on the regulon specific score inferred using pySCENIC and by calculating the average expression. |
| Page: 1 |
Top |
Somatic mutation of malignant transformation related genes |
| Annotation of somatic variants for genes involved in malignant transformation |
| Hugo Symbol | Variant Class | Variant Classification | dbSNP RS | HGVSc | HGVSp | HGVSp Short | SWISSPROT | BIOTYPE | SIFT | PolyPhen | Tumor Sample Barcode | Tissue | Histology | Sex | Age | Stage | Therapy Types | Drugs | Outcome |
| STAU1 | SNV | Missense_Mutation | c.1169N>T | p.Ser390Phe | p.S390F | O95793 | protein_coding | deleterious(0.01) | benign(0.11) | TCGA-A8-A09X-01 | Breast | breast invasive carcinoma | Female | <65 | III/IV | Unknown | Unknown | SD | |
| STAU1 | SNV | Missense_Mutation | c.1362G>A | p.Met454Ile | p.M454I | O95793 | protein_coding | tolerated(0.15) | benign(0.009) | TCGA-AC-A23H-01 | Breast | breast invasive carcinoma | Female | >=65 | I/II | Unknown | Unknown | PD | |
| STAU1 | SNV | Missense_Mutation | rs772776840 | c.1040A>C | p.Asn347Thr | p.N347T | O95793 | protein_coding | tolerated(0.37) | benign(0.18) | TCGA-BH-A0DH-01 | Breast | breast invasive carcinoma | Female | <65 | I/II | Chemotherapy | cyclophosphamide | SD |
| STAU1 | SNV | Missense_Mutation | c.382C>G | p.Gln128Glu | p.Q128E | O95793 | protein_coding | tolerated(0.25) | benign(0.193) | TCGA-D8-A1J9-01 | Breast | breast invasive carcinoma | Female | <65 | I/II | Unknown | Unknown | SD | |
| STAU1 | insertion | Frame_Shift_Ins | novel | c.984_985insCTGAGCTCAGGAGTTCAAGACCAGCCTGGCCAACGTG | p.Thr329LeufsTer71 | p.T329Lfs*71 | O95793 | protein_coding | TCGA-AN-A049-01 | Breast | breast invasive carcinoma | Female | <65 | I/II | Unknown | Unknown | SD | ||
| STAU1 | insertion | Nonsense_Mutation | novel | c.951_952insTATAGCAATTTATAACTTAGAAAGTT | p.Glu318TyrfsTer5 | p.E318Yfs*5 | O95793 | protein_coding | TCGA-B6-A0IK-01 | Breast | breast invasive carcinoma | Female | <65 | III/IV | Unknown | Unknown | PD | ||
| STAU1 | SNV | Missense_Mutation | novel | c.471N>C | p.Leu157Phe | p.L157F | O95793 | protein_coding | deleterious(0.02) | probably_damaging(0.99) | TCGA-EK-A3GK-01 | Cervix | cervical & endocervical cancer | Female | <65 | I/II | Unknown | Unknown | SD |
| STAU1 | SNV | Missense_Mutation | c.47N>T | p.Ser16Leu | p.S16L | O95793 | protein_coding | deleterious_low_confidence(0.03) | benign(0.011) | TCGA-VS-A9UZ-01 | Cervix | cervical & endocervical cancer | Female | <65 | I/II | Unknown | Unknown | SD | |
| STAU1 | SNV | Missense_Mutation | novel | c.1361T>C | p.Met454Thr | p.M454T | O95793 | protein_coding | tolerated(1) | benign(0.003) | TCGA-A6-2672-01 | Colorectum | colon adenocarcinoma | Female | >=65 | III/IV | Unknown | Unknown | SD |
| STAU1 | SNV | Missense_Mutation | c.1580C>A | p.Pro527Gln | p.P527Q | O95793 | protein_coding | deleterious(0) | probably_damaging(0.987) | TCGA-AA-3713-01 | Colorectum | colon adenocarcinoma | Male | >=65 | III/IV | Chemotherapy | 5-fluorouracil | PR |
| Page: 1 2 3 4 5 6 |
Top |
Related drugs of malignant transformation related genes |
| Identification of chemicals and drugs interact with genes involved in malignant transfromation |
| (DGIdb 4.0) |
| Entrez ID | Symbol | Category | Interaction Types | Drug Claim Name | Drug Name | PMIDs |
| Page: 1 |

Copyright 2023-Present -The University of Texas Health Science Center at Houston |