| Tissue | Expression Dynamics | Abbreviation |
| Esophagus | 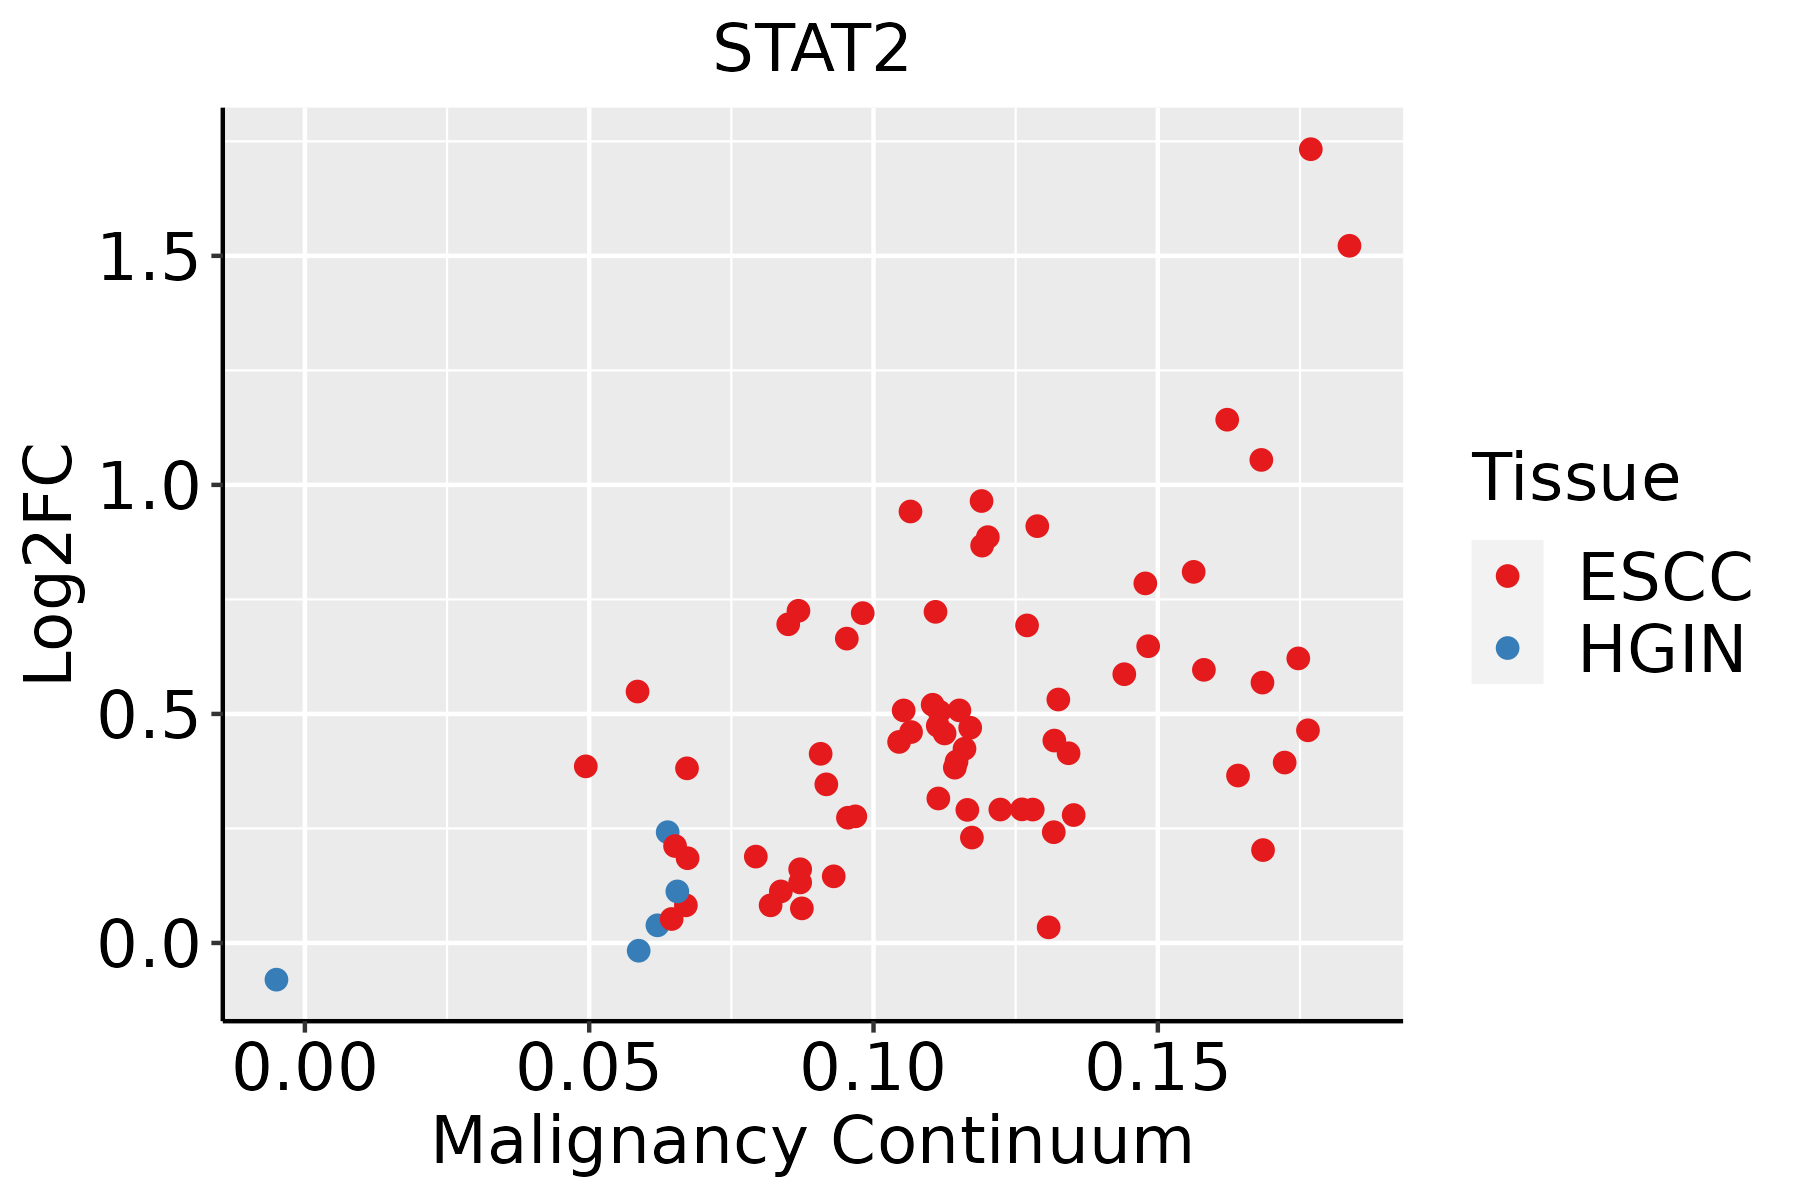 | ESCC: Esophageal squamous cell carcinoma |
| HGIN: High-grade intraepithelial neoplasias |
| LGIN: Low-grade intraepithelial neoplasias |
| Liver | 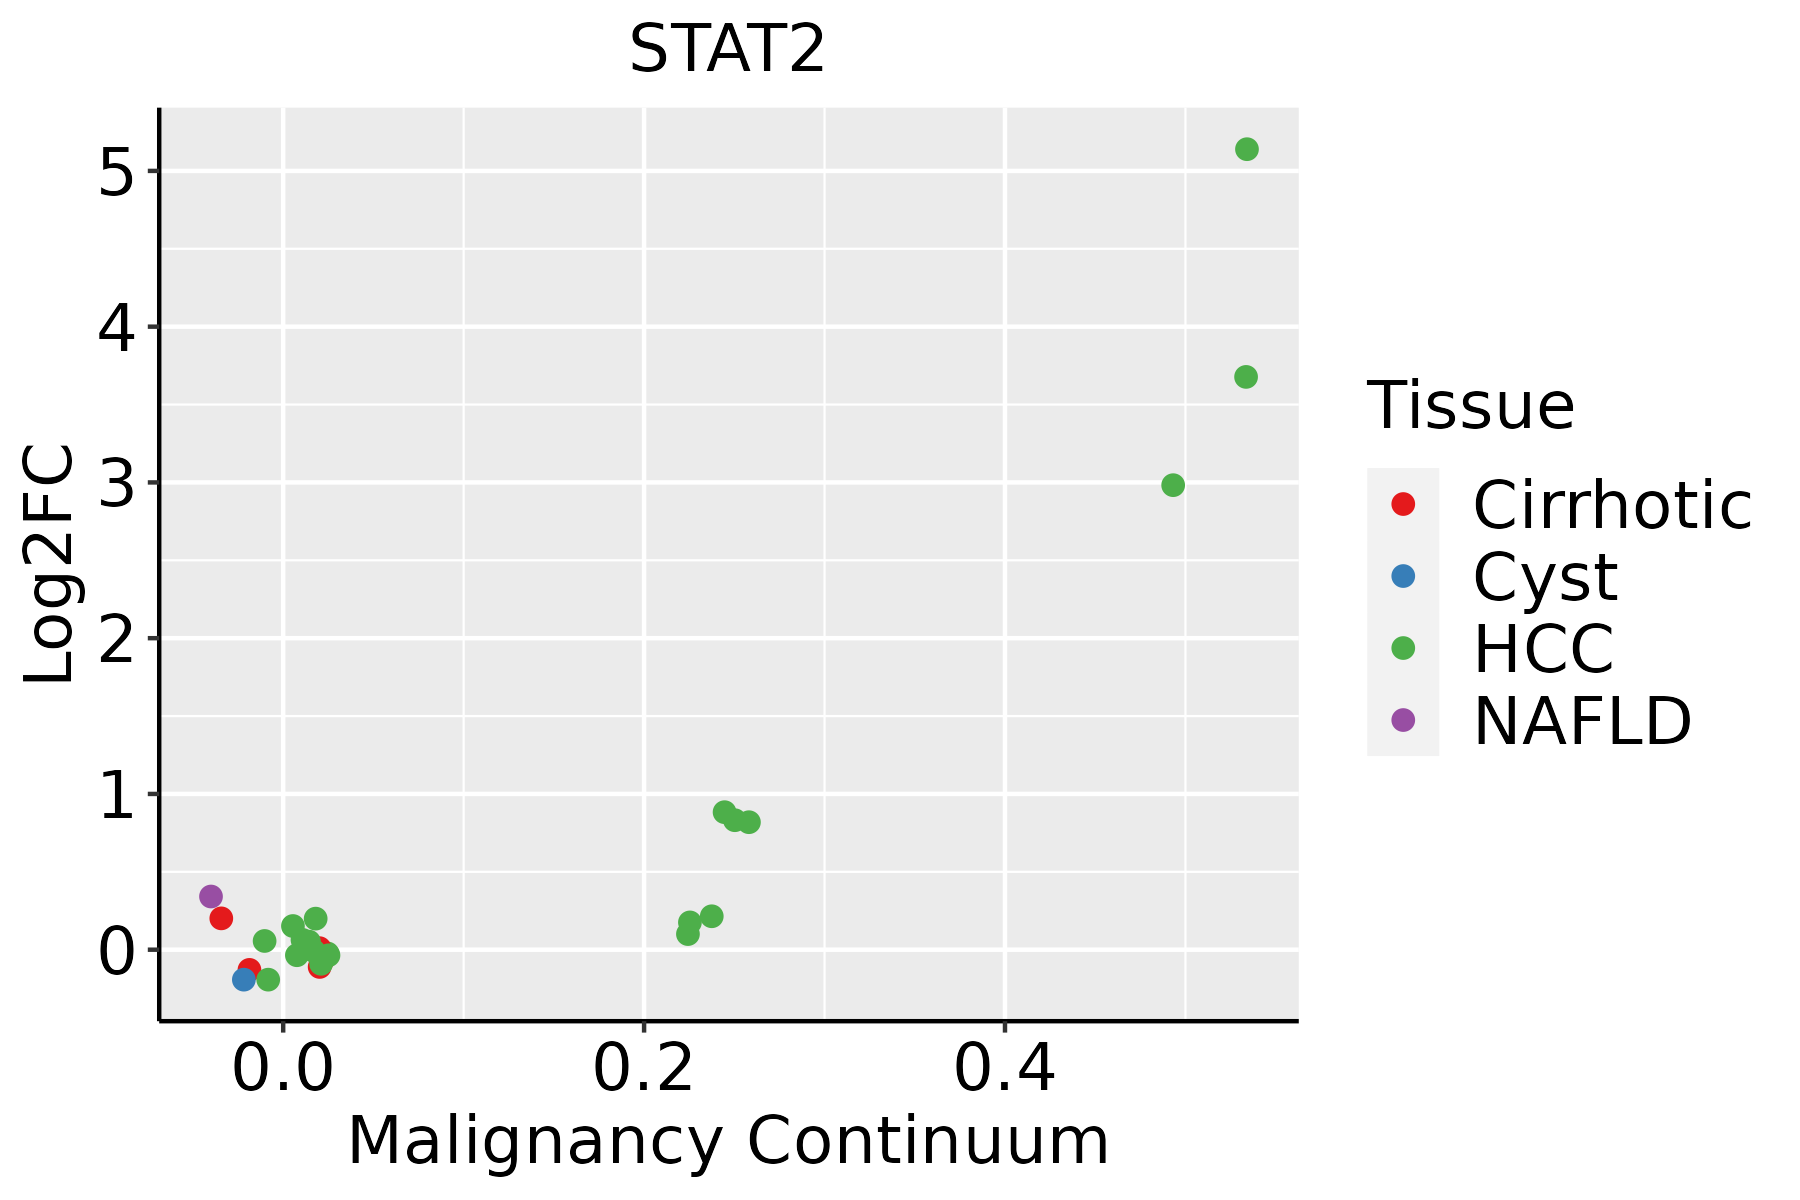 | HCC: Hepatocellular carcinoma |
| NAFLD: Non-alcoholic fatty liver disease |
| Lung | 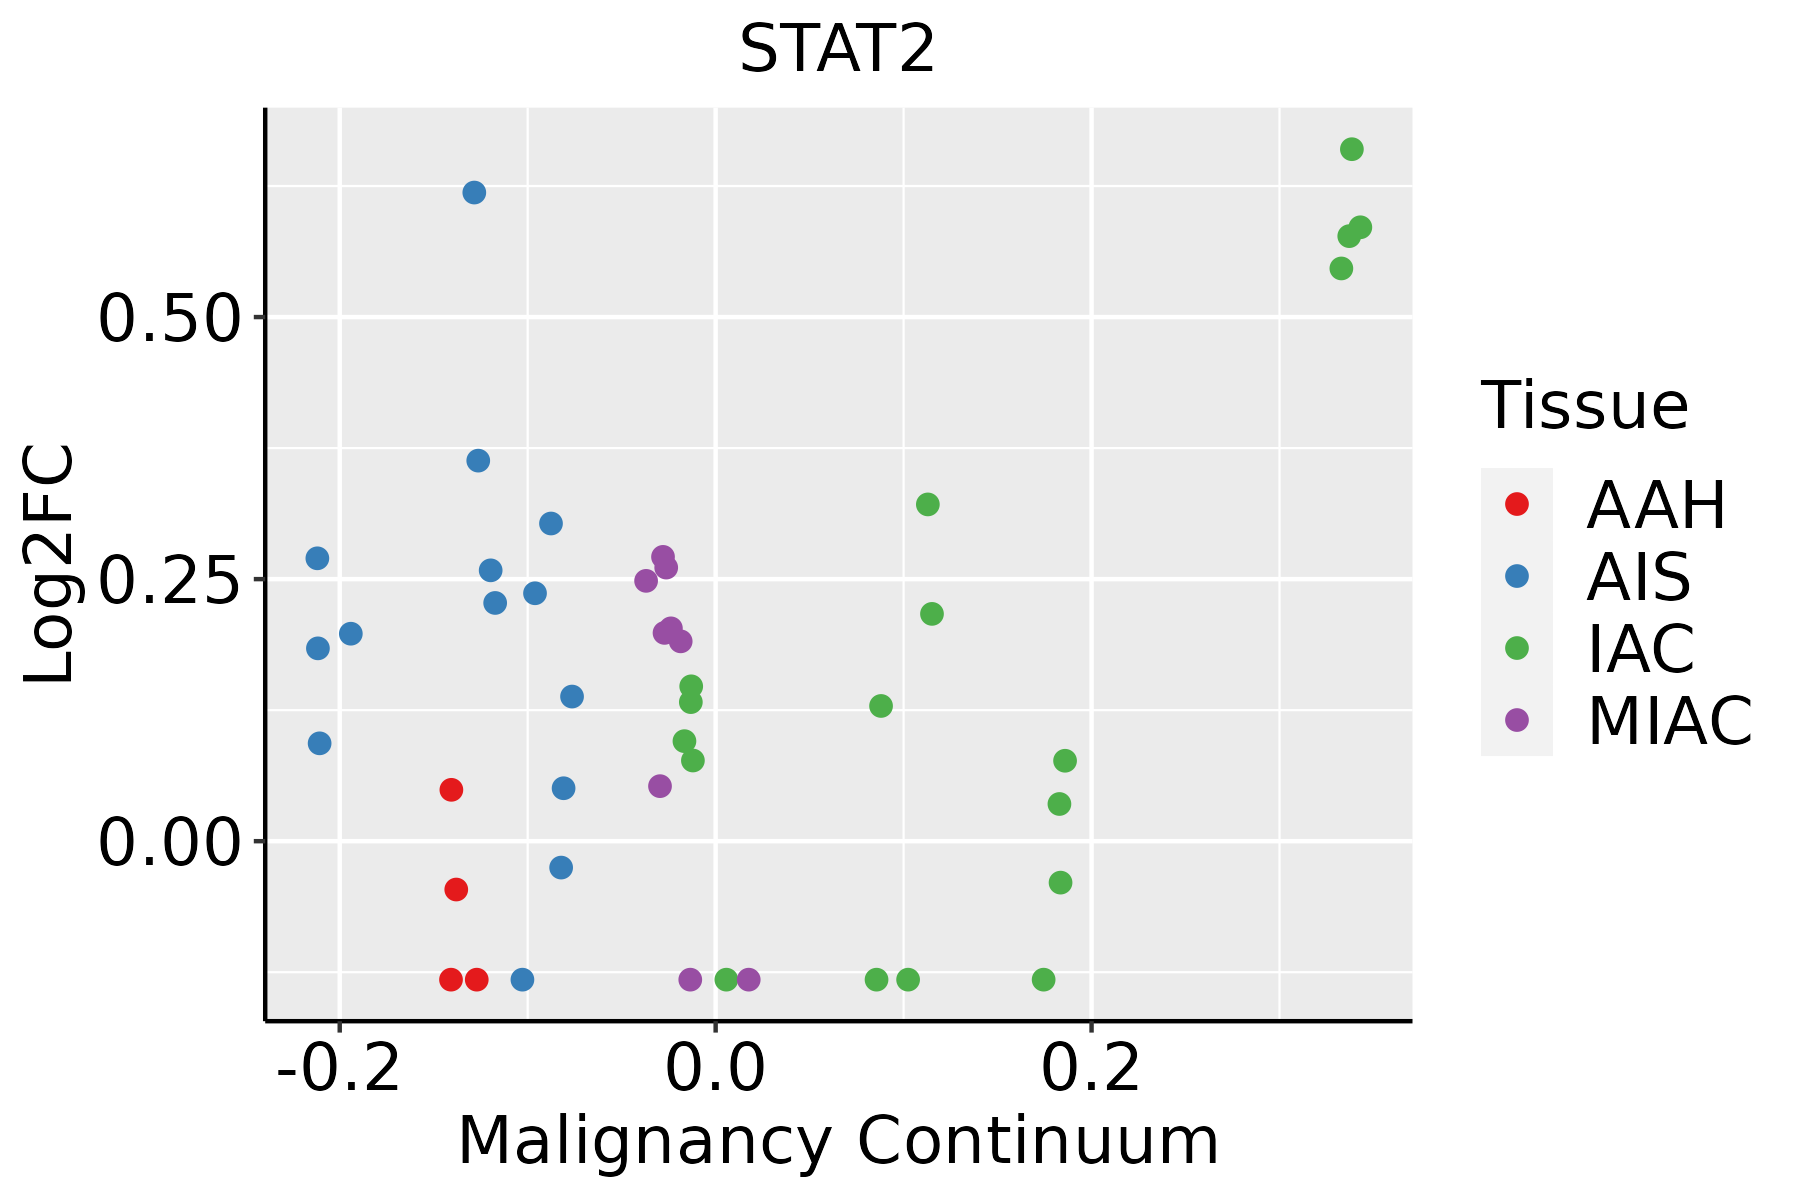 | AAH: Atypical adenomatous hyperplasia |
| AIS: Adenocarcinoma in situ |
| IAC: Invasive lung adenocarcinoma |
| MIA: Minimally invasive adenocarcinoma |
| Oral Cavity |  | EOLP: Erosive Oral lichen planus |
| LP: leukoplakia |
| NEOLP: Non-erosive oral lichen planus |
| OSCC: Oral squamous cell carcinoma |
| Skin |  | AK: Actinic keratosis |
| cSCC: Cutaneous squamous cell carcinoma |
| SCCIS:squamous cell carcinoma in situ |
| Thyroid | 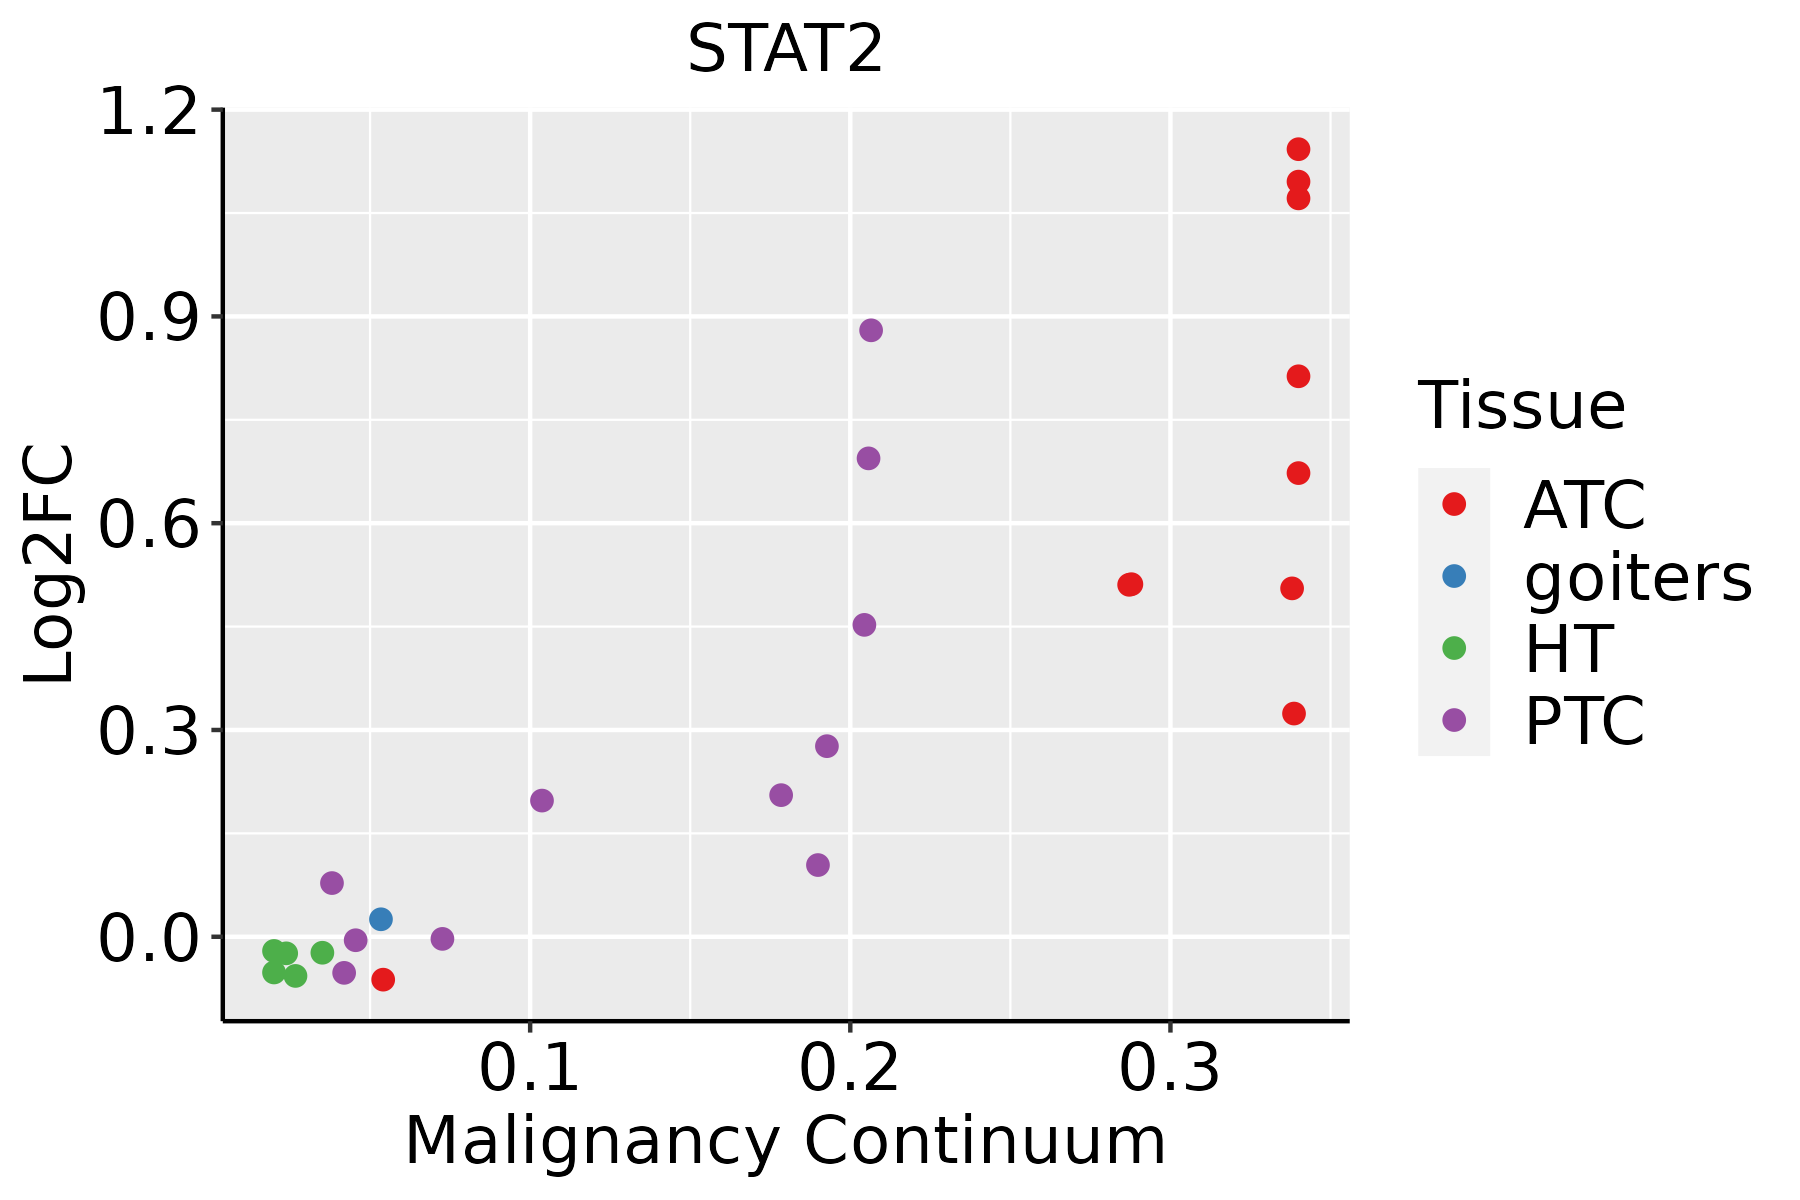 | ATC: Anaplastic thyroid cancer |
| HT: Hashimoto's thyroiditis |
| PTC: Papillary thyroid cancer |
| GO ID | Tissue | Disease Stage | Description | Gene Ratio | Bg Ratio | pvalue | p.adjust | Count |
| GO:00603386 | Skin | cSCC | regulation of type I interferon-mediated signaling pathway | 20/4864 | 36/18723 | 1.55e-04 | 1.36e-03 | 20 |
| GO:000283122 | Skin | cSCC | regulation of response to biotic stimulus | 112/4864 | 327/18723 | 5.00e-04 | 3.76e-03 | 112 |
| GO:00028326 | Skin | cSCC | negative regulation of response to biotic stimulus | 43/4864 | 108/18723 | 1.12e-03 | 7.36e-03 | 43 |
| GO:004508812 | Skin | cSCC | regulation of innate immune response | 75/4864 | 218/18723 | 3.40e-03 | 1.84e-02 | 75 |
| GO:00603393 | Skin | cSCC | negative regulation of type I interferon-mediated signaling pathway | 11/4864 | 20/18723 | 5.40e-03 | 2.71e-02 | 11 |
| GO:00607596 | Skin | cSCC | regulation of response to cytokine stimulus | 57/4864 | 162/18723 | 5.77e-03 | 2.85e-02 | 57 |
| GO:00458246 | Skin | cSCC | negative regulation of innate immune response | 28/4864 | 71/18723 | 8.86e-03 | 4.07e-02 | 28 |
| GO:0043434113 | Thyroid | PTC | response to peptide hormone | 188/5968 | 414/18723 | 4.13e-09 | 1.09e-07 | 188 |
| GO:001082124 | Thyroid | PTC | regulation of mitochondrion organization | 78/5968 | 144/18723 | 2.38e-08 | 5.43e-07 | 78 |
| GO:000961520 | Thyroid | PTC | response to virus | 162/5968 | 367/18723 | 4.52e-07 | 7.41e-06 | 162 |
| GO:00343408 | Thyroid | PTC | response to type I interferon | 35/5968 | 58/18723 | 7.35e-06 | 8.60e-05 | 35 |
| GO:00713577 | Thyroid | PTC | cellular response to type I interferon | 30/5968 | 52/18723 | 1.06e-04 | 8.56e-04 | 30 |
| GO:00603377 | Thyroid | PTC | type I interferon signaling pathway | 29/5968 | 50/18723 | 1.21e-04 | 9.66e-04 | 29 |
| GO:000283114 | Thyroid | PTC | regulation of response to biotic stimulus | 136/5968 | 327/18723 | 1.22e-04 | 9.69e-04 | 136 |
| GO:00603387 | Thyroid | PTC | regulation of type I interferon-mediated signaling pathway | 21/5968 | 36/18723 | 9.36e-04 | 5.68e-03 | 21 |
| GO:00482855 | Thyroid | PTC | organelle fission | 188/5968 | 488/18723 | 9.64e-04 | 5.77e-03 | 188 |
| GO:00516077 | Thyroid | PTC | defense response to virus | 108/5968 | 265/18723 | 1.34e-03 | 7.55e-03 | 108 |
| GO:01405467 | Thyroid | PTC | defense response to symbiont | 108/5968 | 265/18723 | 1.34e-03 | 7.55e-03 | 108 |
| GO:00607597 | Thyroid | PTC | regulation of response to cytokine stimulus | 70/5968 | 162/18723 | 1.54e-03 | 8.58e-03 | 70 |
| GO:00450887 | Thyroid | PTC | regulation of innate immune response | 89/5968 | 218/18723 | 3.16e-03 | 1.55e-02 | 89 |
| Pathway ID | Tissue | Disease Stage | Description | Gene Ratio | Bg Ratio | pvalue | p.adjust | qvalue | Count |
| hsa05169210 | Esophagus | ESCC | Epstein-Barr virus infection | 151/4205 | 202/8465 | 1.55e-13 | 3.45e-12 | 1.77e-12 | 151 |
| hsa05167211 | Esophagus | ESCC | Kaposi sarcoma-associated herpesvirus infection | 136/4205 | 194/8465 | 4.28e-09 | 4.22e-08 | 2.16e-08 | 136 |
| hsa0516425 | Esophagus | ESCC | Influenza A | 122/4205 | 171/8465 | 5.01e-09 | 4.79e-08 | 2.45e-08 | 122 |
| hsa0516510 | Esophagus | ESCC | Human papillomavirus infection | 215/4205 | 331/8465 | 7.86e-09 | 7.12e-08 | 3.65e-08 | 215 |
| hsa05171211 | Esophagus | ESCC | Coronavirus disease - COVID-19 | 156/4205 | 232/8465 | 3.18e-08 | 2.68e-07 | 1.37e-07 | 156 |
| hsa051609 | Esophagus | ESCC | Hepatitis C | 107/4205 | 157/8465 | 1.75e-06 | 1.08e-05 | 5.55e-06 | 107 |
| hsa051619 | Esophagus | ESCC | Hepatitis B | 108/4205 | 162/8465 | 7.68e-06 | 4.15e-05 | 2.12e-05 | 108 |
| hsa046259 | Esophagus | ESCC | C-type lectin receptor signaling pathway | 73/4205 | 104/8465 | 1.57e-05 | 7.98e-05 | 4.09e-05 | 73 |
| hsa051629 | Esophagus | ESCC | Measles | 90/4205 | 139/8465 | 2.16e-04 | 7.87e-04 | 4.03e-04 | 90 |
| hsa0462122 | Esophagus | ESCC | NOD-like receptor signaling pathway | 116/4205 | 186/8465 | 2.90e-04 | 1.03e-03 | 5.30e-04 | 116 |
| hsa0516937 | Esophagus | ESCC | Epstein-Barr virus infection | 151/4205 | 202/8465 | 1.55e-13 | 3.45e-12 | 1.77e-12 | 151 |
| hsa0516738 | Esophagus | ESCC | Kaposi sarcoma-associated herpesvirus infection | 136/4205 | 194/8465 | 4.28e-09 | 4.22e-08 | 2.16e-08 | 136 |
| hsa0516435 | Esophagus | ESCC | Influenza A | 122/4205 | 171/8465 | 5.01e-09 | 4.79e-08 | 2.45e-08 | 122 |
| hsa0516515 | Esophagus | ESCC | Human papillomavirus infection | 215/4205 | 331/8465 | 7.86e-09 | 7.12e-08 | 3.65e-08 | 215 |
| hsa05171310 | Esophagus | ESCC | Coronavirus disease - COVID-19 | 156/4205 | 232/8465 | 3.18e-08 | 2.68e-07 | 1.37e-07 | 156 |
| hsa0516016 | Esophagus | ESCC | Hepatitis C | 107/4205 | 157/8465 | 1.75e-06 | 1.08e-05 | 5.55e-06 | 107 |
| hsa0516114 | Esophagus | ESCC | Hepatitis B | 108/4205 | 162/8465 | 7.68e-06 | 4.15e-05 | 2.12e-05 | 108 |
| hsa0462513 | Esophagus | ESCC | C-type lectin receptor signaling pathway | 73/4205 | 104/8465 | 1.57e-05 | 7.98e-05 | 4.09e-05 | 73 |
| hsa0516213 | Esophagus | ESCC | Measles | 90/4205 | 139/8465 | 2.16e-04 | 7.87e-04 | 4.03e-04 | 90 |
| hsa0462132 | Esophagus | ESCC | NOD-like receptor signaling pathway | 116/4205 | 186/8465 | 2.90e-04 | 1.03e-03 | 5.30e-04 | 116 |
| Hugo Symbol | Variant Class | Variant Classification | dbSNP RS | HGVSc | HGVSp | HGVSp Short | SWISSPROT | BIOTYPE | SIFT | PolyPhen | Tumor Sample Barcode | Tissue | Histology | Sex | Age | Stage | Therapy Types | Drugs | Outcome |
| STAT2 | SNV | Missense_Mutation | rs755127513 | c.2491G>A | p.Glu831Lys | p.E831K | P52630 | protein_coding | deleterious_low_confidence(0.01) | benign(0.303) | TCGA-5L-AAT1-01 | Breast | breast invasive carcinoma | Female | <65 | III/IV | Hormone Therapy | letrozol | SD |
| STAT2 | SNV | Missense_Mutation | | c.404N>G | p.Glu135Gly | p.E135G | P52630 | protein_coding | tolerated(0.13) | benign(0.054) | TCGA-AC-A23H-01 | Breast | breast invasive carcinoma | Female | >=65 | I/II | Unknown | Unknown | PD |
| STAT2 | SNV | Missense_Mutation | | c.2403N>T | p.Glu801Asp | p.E801D | P52630 | protein_coding | tolerated_low_confidence(0.25) | benign(0.007) | TCGA-BH-A1FM-01 | Breast | breast invasive carcinoma | Female | <65 | III/IV | Unknown | Unknown | SD |
| STAT2 | SNV | Missense_Mutation | | c.599N>G | p.Gln200Arg | p.Q200R | P52630 | protein_coding | tolerated(0.09) | probably_damaging(0.992) | TCGA-C8-A12Z-01 | Breast | breast invasive carcinoma | Female | <65 | I/II | Chemotherapy | 5-fluorouracil | CR |
| STAT2 | SNV | Missense_Mutation | novel | c.2527N>A | p.Asp843Asn | p.D843N | P52630 | protein_coding | deleterious_low_confidence(0) | benign(0.104) | TCGA-C8-A8HQ-01 | Breast | breast invasive carcinoma | Female | <65 | I/II | Unknown | Unknown | SD |
| STAT2 | insertion | In_Frame_Ins | novel | c.1120_1121insAAAGGAACAGGGGTTGGG | p.Arg374delinsGlnArgAsnArgGlyTrpGly | p.R374delinsQRNRGWG | P52630 | protein_coding | | | TCGA-A7-A0CE-01 | Breast | breast invasive carcinoma | Female | <65 | I/II | Chemotherapy | adriamycin | SD |
| STAT2 | SNV | Missense_Mutation | novel | c.1063G>A | p.Glu355Lys | p.E355K | P52630 | protein_coding | tolerated(0.14) | probably_damaging(0.953) | TCGA-C5-A8XJ-01 | Cervix | cervical & endocervical cancer | Female | >=65 | I/II | Chemotherapy | cisplatin | SD |
| STAT2 | SNV | Missense_Mutation | | c.613G>C | p.Glu205Gln | p.E205Q | P52630 | protein_coding | tolerated(0.17) | possibly_damaging(0.889) | TCGA-EK-A2RN-01 | Cervix | cervical & endocervical cancer | Female | <65 | I/II | Unknown | Unknown | SD |
| STAT2 | SNV | Missense_Mutation | | c.2348N>T | p.Ser783Leu | p.S783L | P52630 | protein_coding | tolerated_low_confidence(0.25) | benign(0.003) | TCGA-EK-A3GK-01 | Cervix | cervical & endocervical cancer | Female | <65 | I/II | Unknown | Unknown | SD |
| STAT2 | SNV | Missense_Mutation | | c.2309N>C | p.Val770Ala | p.V770A | P52630 | protein_coding | tolerated_low_confidence(0.81) | benign(0) | TCGA-HM-A3JK-01 | Cervix | cervical & endocervical cancer | Female | <65 | I/II | Chemotherapy | cisplatin | SD |


