
|
|||||
|
 | |
| |
| |
| |
| |
| |
|
Gene: STARD13 |
Gene summary for STARD13 |
| Gene information | Species | Human | Gene symbol | STARD13 | Gene ID | 90627 |
| Gene name | StAR related lipid transfer domain containing 13 | |
| Gene Alias | ARHGAP37 | |
| Cytomap | 13q13.1-q13.2 | |
| Gene Type | protein-coding | GO ID | GO:0001525 | UniProtAcc | Q9Y3M8 |
Top |
Malignant transformation analysis |
| Identification of the aberrant gene expression in precancerous and cancerous lesions by comparing the gene expression of stem-like cells in diseased tissues with normal stem cells |
| Entrez ID | Symbol | Replicates | Species | Organ | Tissue | Adj P-value | Log2FC | Malignancy |
| 90627 | STARD13 | HTA11_3410_2000001011 | Human | Colorectum | AD | 8.64e-25 | -7.27e-01 | 0.0155 |
| 90627 | STARD13 | HTA11_2487_2000001011 | Human | Colorectum | SER | 3.91e-12 | -6.76e-01 | -0.1808 |
| 90627 | STARD13 | HTA11_2951_2000001011 | Human | Colorectum | AD | 2.52e-03 | -6.88e-01 | 0.0216 |
| 90627 | STARD13 | HTA11_1938_2000001011 | Human | Colorectum | AD | 1.94e-03 | -5.73e-01 | -0.0811 |
| 90627 | STARD13 | HTA11_78_2000001011 | Human | Colorectum | AD | 6.92e-13 | -7.05e-01 | -0.1088 |
| 90627 | STARD13 | HTA11_3361_2000001011 | Human | Colorectum | AD | 2.83e-08 | -7.15e-01 | -0.1207 |
| 90627 | STARD13 | HTA11_83_2000001011 | Human | Colorectum | SER | 5.64e-03 | -5.25e-01 | -0.1526 |
| 90627 | STARD13 | HTA11_696_2000001011 | Human | Colorectum | AD | 8.61e-12 | -5.10e-01 | -0.1464 |
| 90627 | STARD13 | HTA11_866_2000001011 | Human | Colorectum | AD | 6.93e-14 | -5.81e-01 | -0.1001 |
| 90627 | STARD13 | HTA11_1391_2000001011 | Human | Colorectum | AD | 1.85e-02 | -4.17e-01 | -0.059 |
| 90627 | STARD13 | HTA11_2992_2000001011 | Human | Colorectum | SER | 6.39e-06 | -7.85e-01 | -0.1706 |
| 90627 | STARD13 | HTA11_5212_2000001011 | Human | Colorectum | AD | 5.99e-07 | -7.87e-01 | -0.2061 |
| 90627 | STARD13 | HTA11_5216_2000001011 | Human | Colorectum | SER | 1.05e-03 | -6.35e-01 | -0.1462 |
| 90627 | STARD13 | HTA11_7862_2000001011 | Human | Colorectum | AD | 1.08e-03 | -5.26e-01 | -0.0179 |
| 90627 | STARD13 | HTA11_866_3004761011 | Human | Colorectum | AD | 6.81e-14 | -5.99e-01 | 0.096 |
| 90627 | STARD13 | HTA11_10711_2000001011 | Human | Colorectum | AD | 7.94e-11 | -6.95e-01 | 0.0338 |
| 90627 | STARD13 | HTA11_7696_3000711011 | Human | Colorectum | AD | 1.17e-12 | -5.26e-01 | 0.0674 |
| 90627 | STARD13 | HTA11_99999965062_69753 | Human | Colorectum | MSI-H | 2.16e-03 | 8.83e-01 | 0.3487 |
| 90627 | STARD13 | HTA11_99999965104_69814 | Human | Colorectum | MSS | 1.01e-03 | 6.44e-01 | 0.281 |
| 90627 | STARD13 | HTA11_99999971662_82457 | Human | Colorectum | MSS | 3.95e-03 | 6.10e-01 | 0.3859 |
| Page: 1 2 3 4 5 6 7 |
| Tissue | Expression Dynamics | Abbreviation |
| Colorectum (GSE201348) | 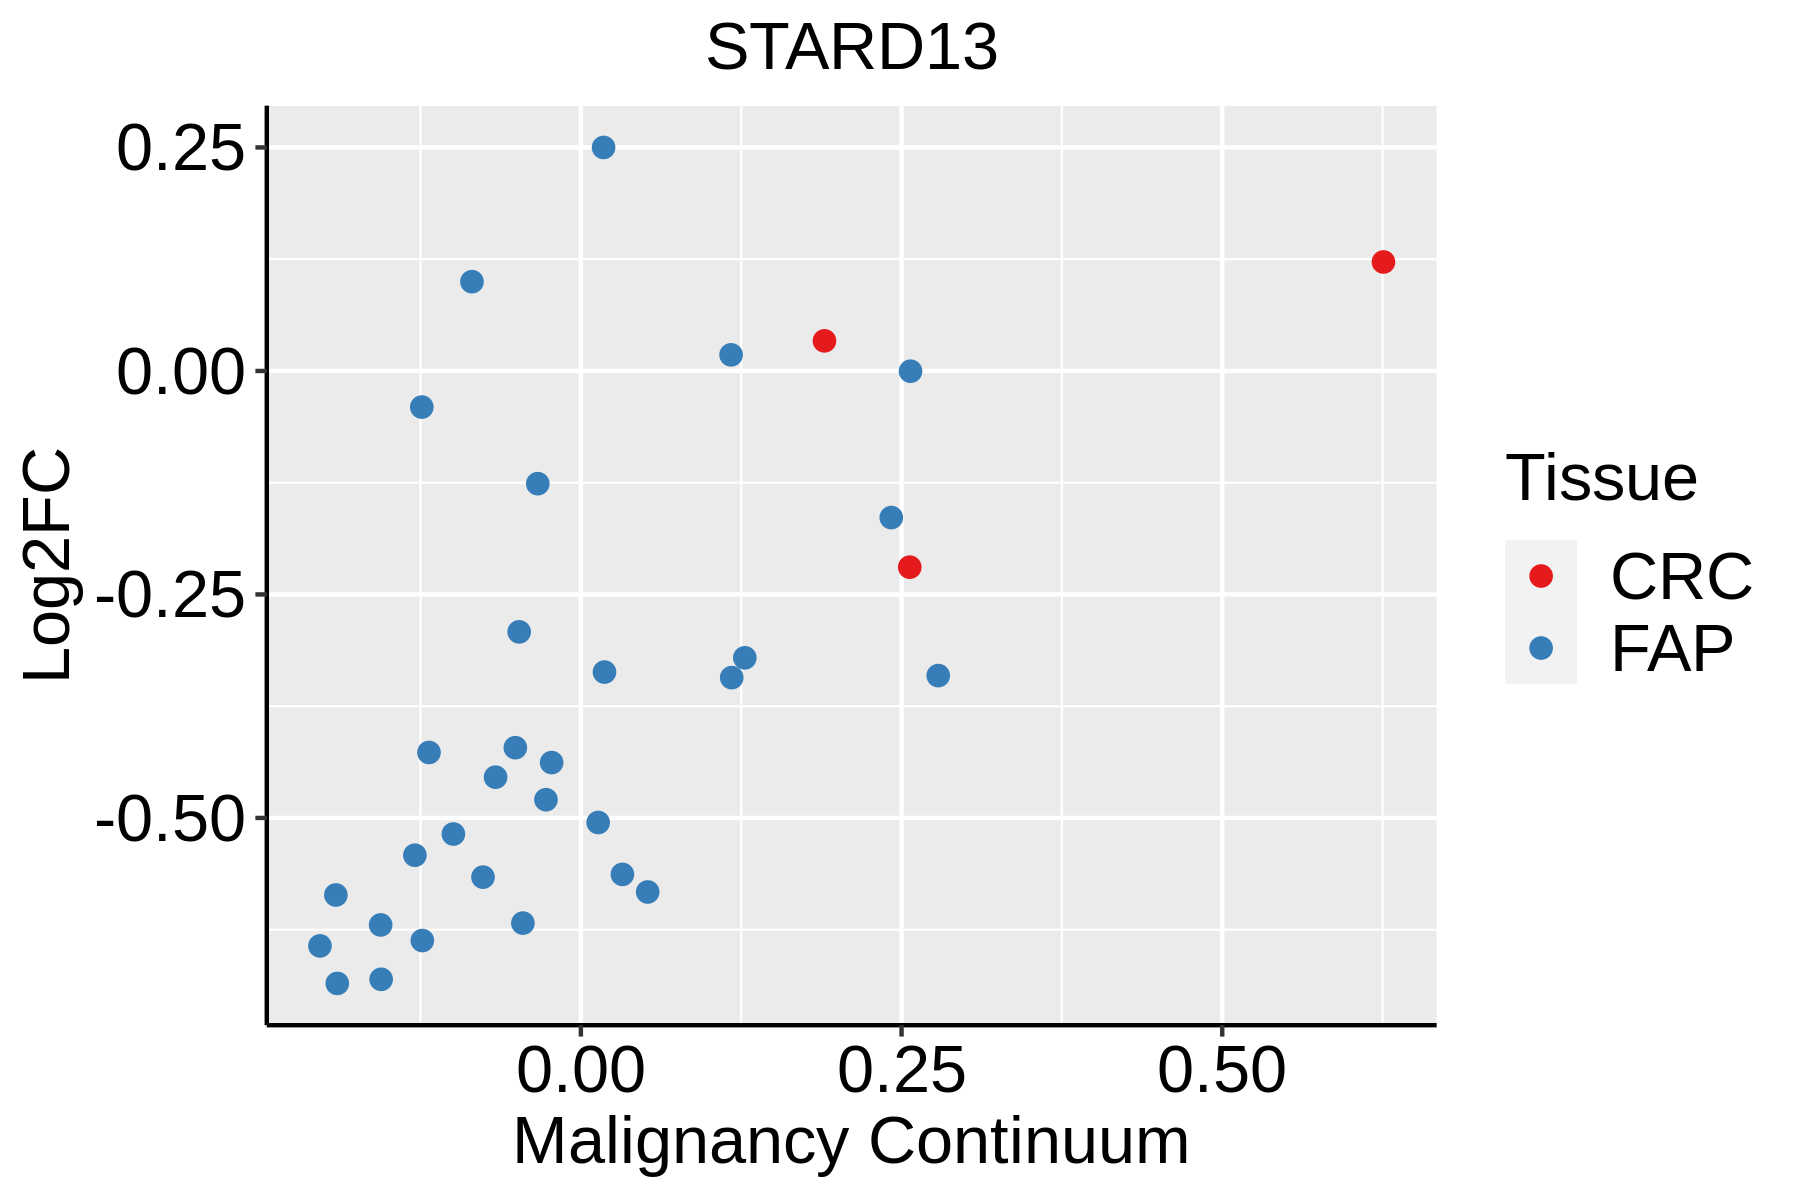 | FAP: Familial adenomatous polyposis |
| CRC: Colorectal cancer | ||
| Colorectum (HTA11) | 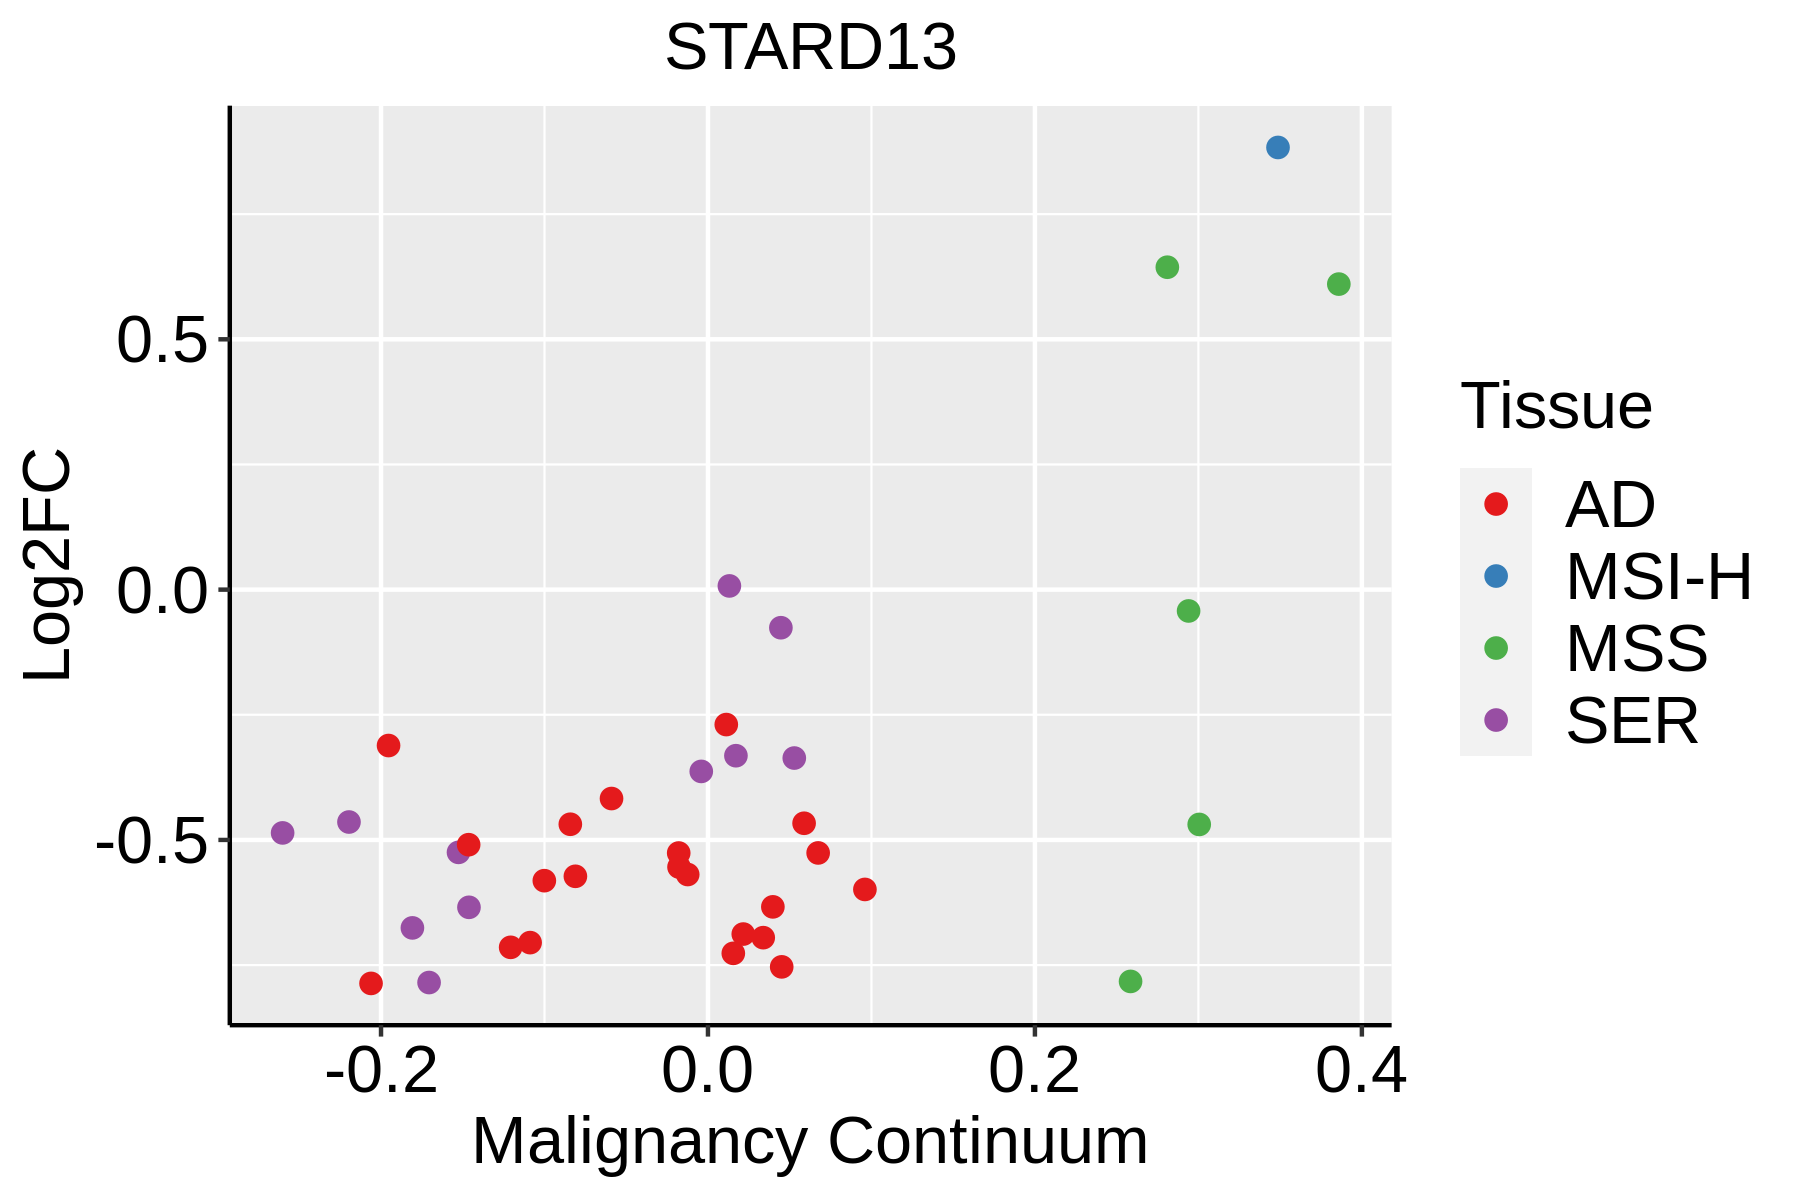 | AD: Adenomas |
| SER: Sessile serrated lesions | ||
| MSI-H: Microsatellite-high colorectal cancer | ||
| MSS: Microsatellite stable colorectal cancer | ||
| Endometrium | 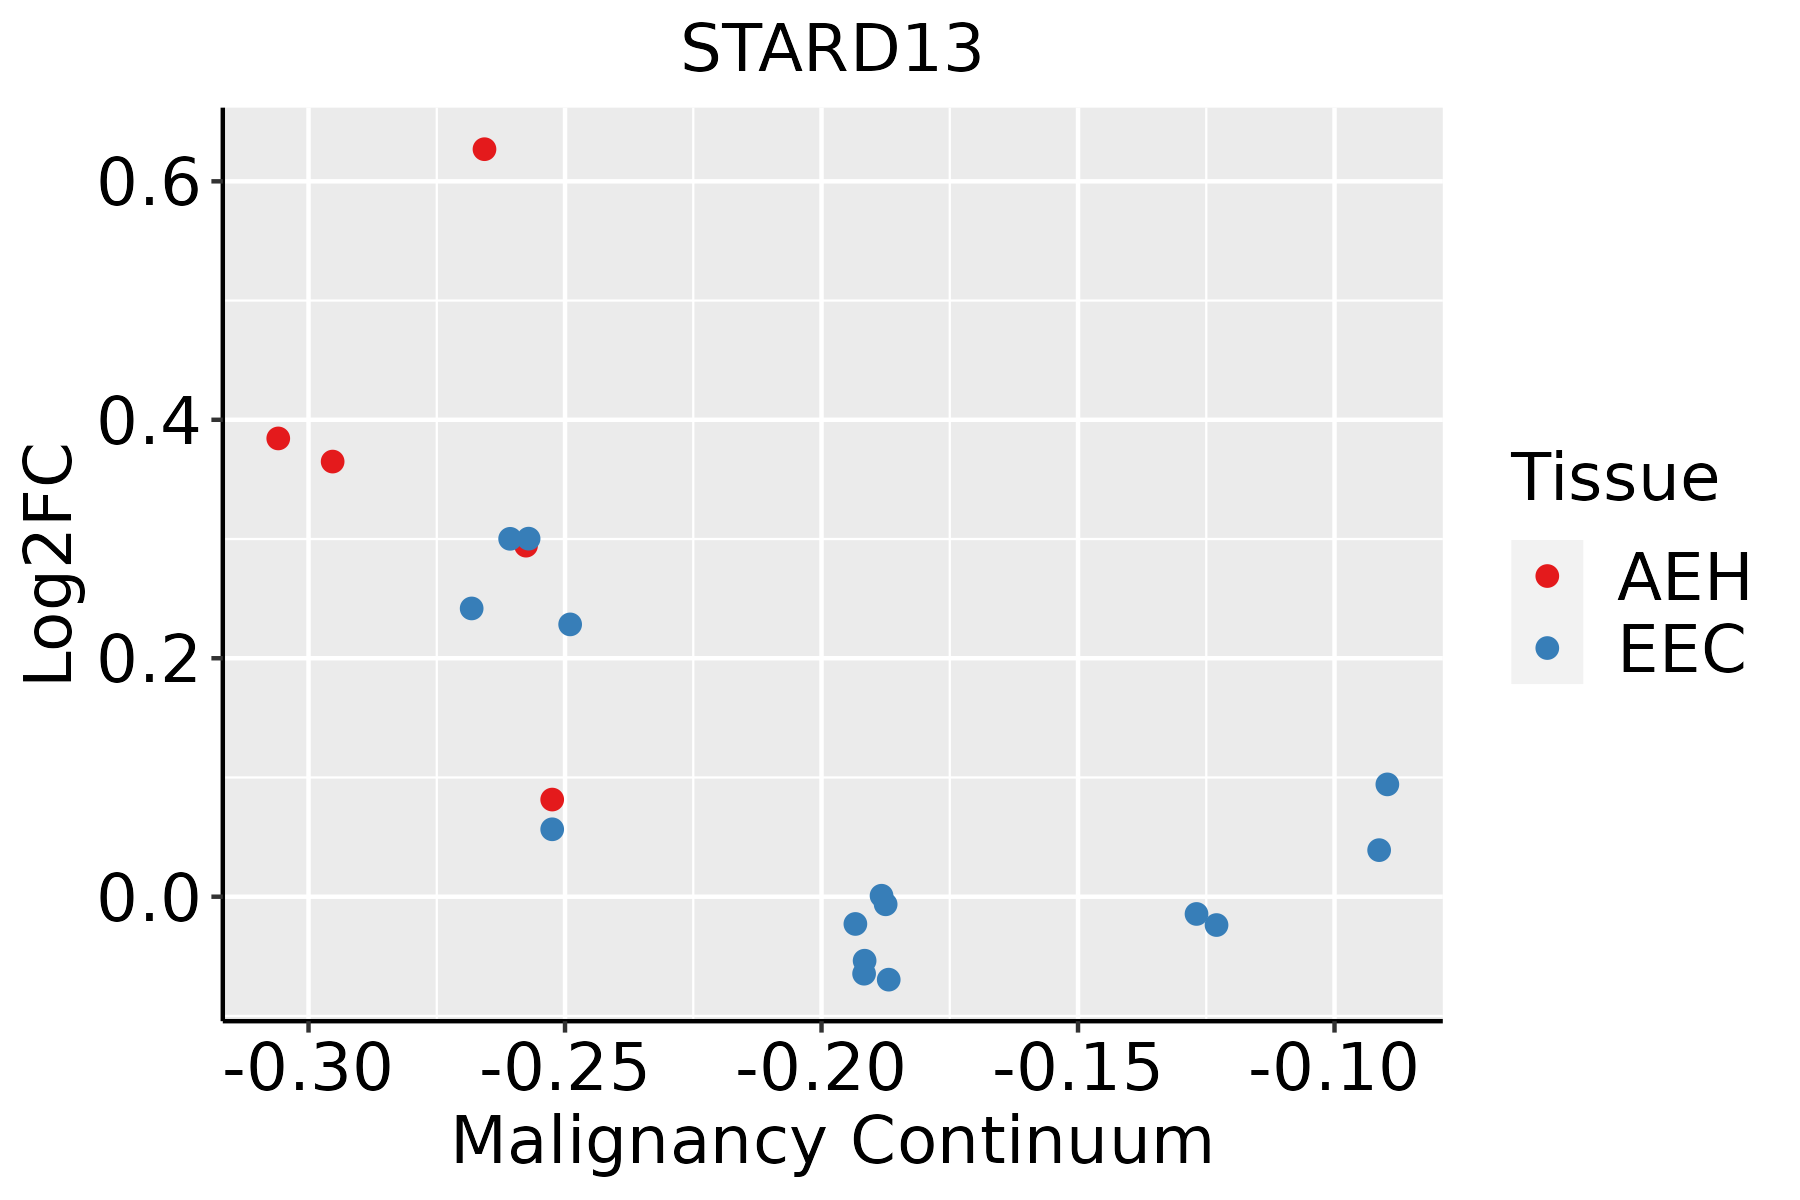 | AEH: Atypical endometrial hyperplasia |
| EEC: Endometrioid Cancer | ||
| Esophagus | 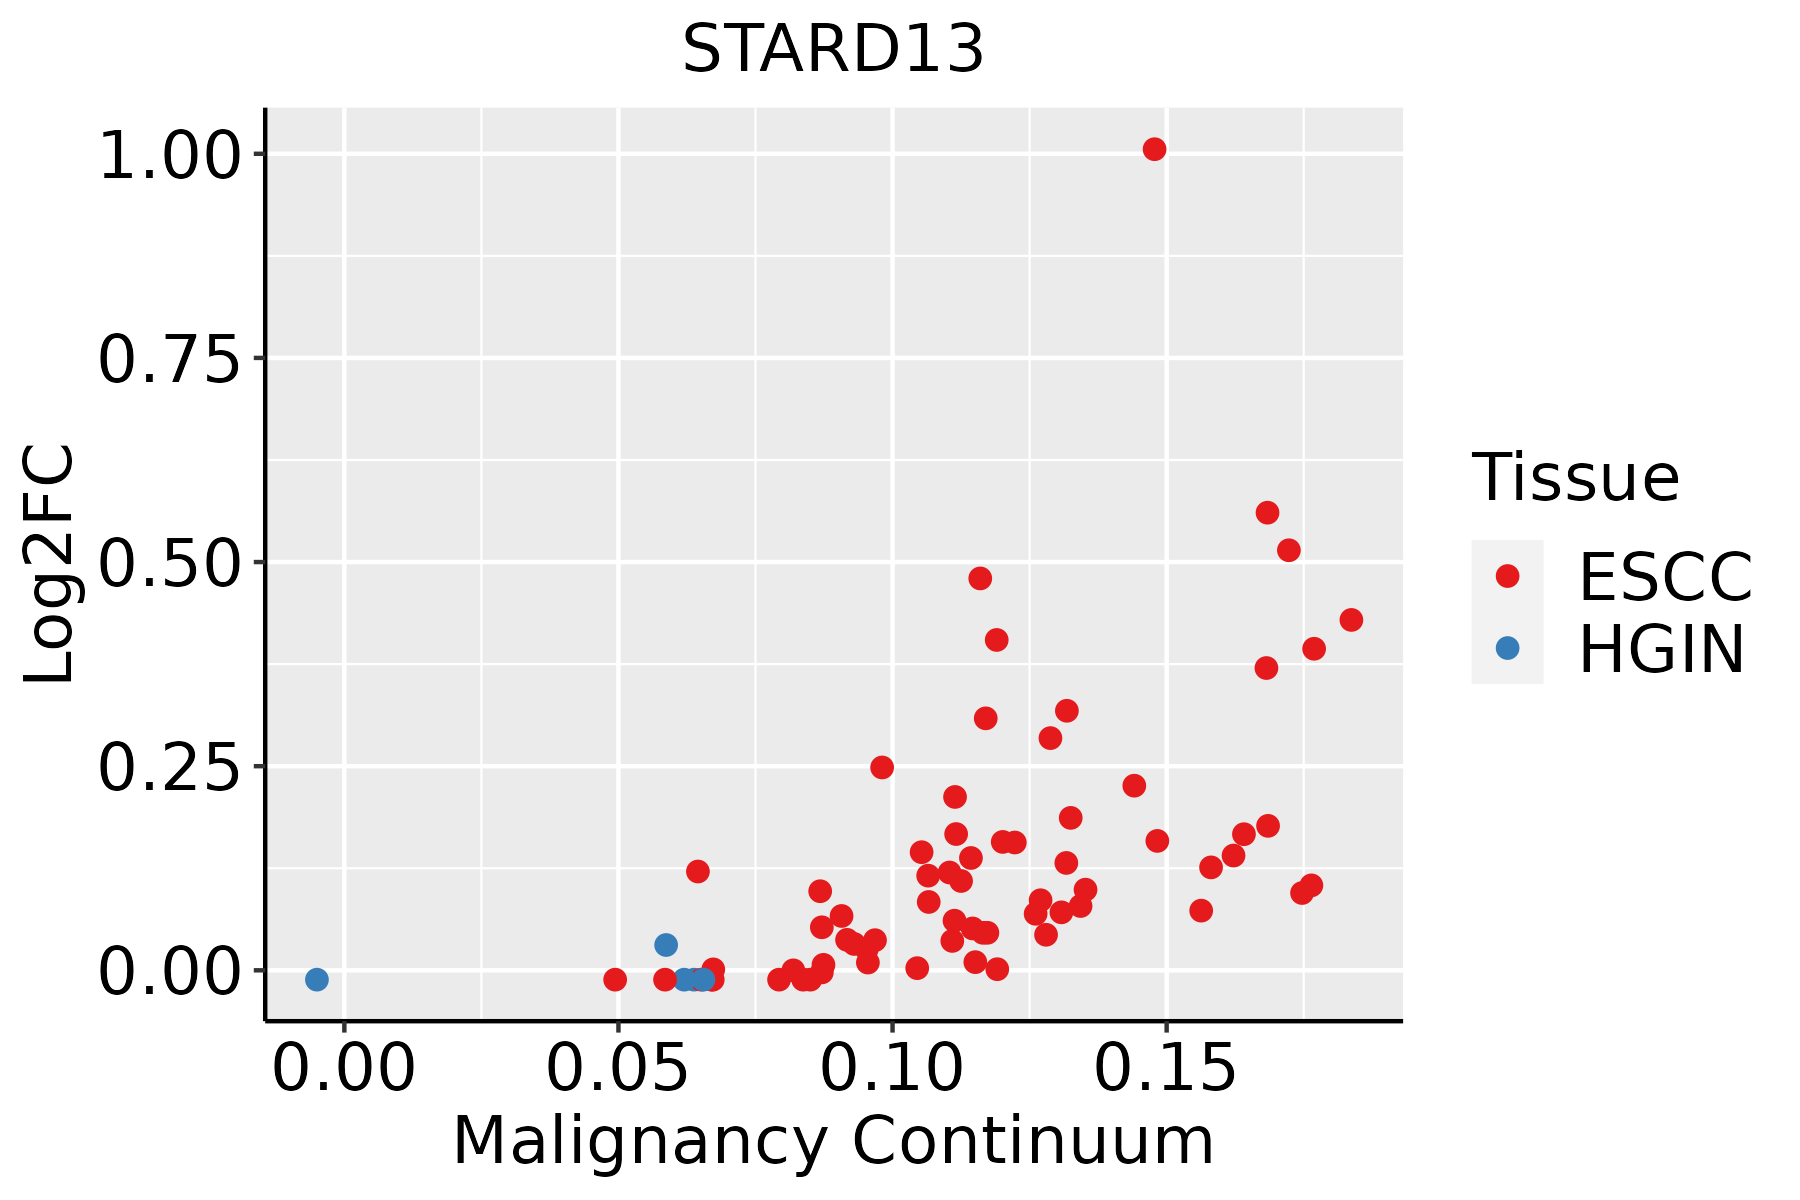 | ESCC: Esophageal squamous cell carcinoma |
| HGIN: High-grade intraepithelial neoplasias | ||
| LGIN: Low-grade intraepithelial neoplasias | ||
| Liver |  | HCC: Hepatocellular carcinoma |
| NAFLD: Non-alcoholic fatty liver disease | ||
| Lung |  | AAH: Atypical adenomatous hyperplasia |
| AIS: Adenocarcinoma in situ | ||
| IAC: Invasive lung adenocarcinoma | ||
| MIA: Minimally invasive adenocarcinoma | ||
| Prostate |  | BPH: Benign Prostatic Hyperplasia |
| Thyroid | 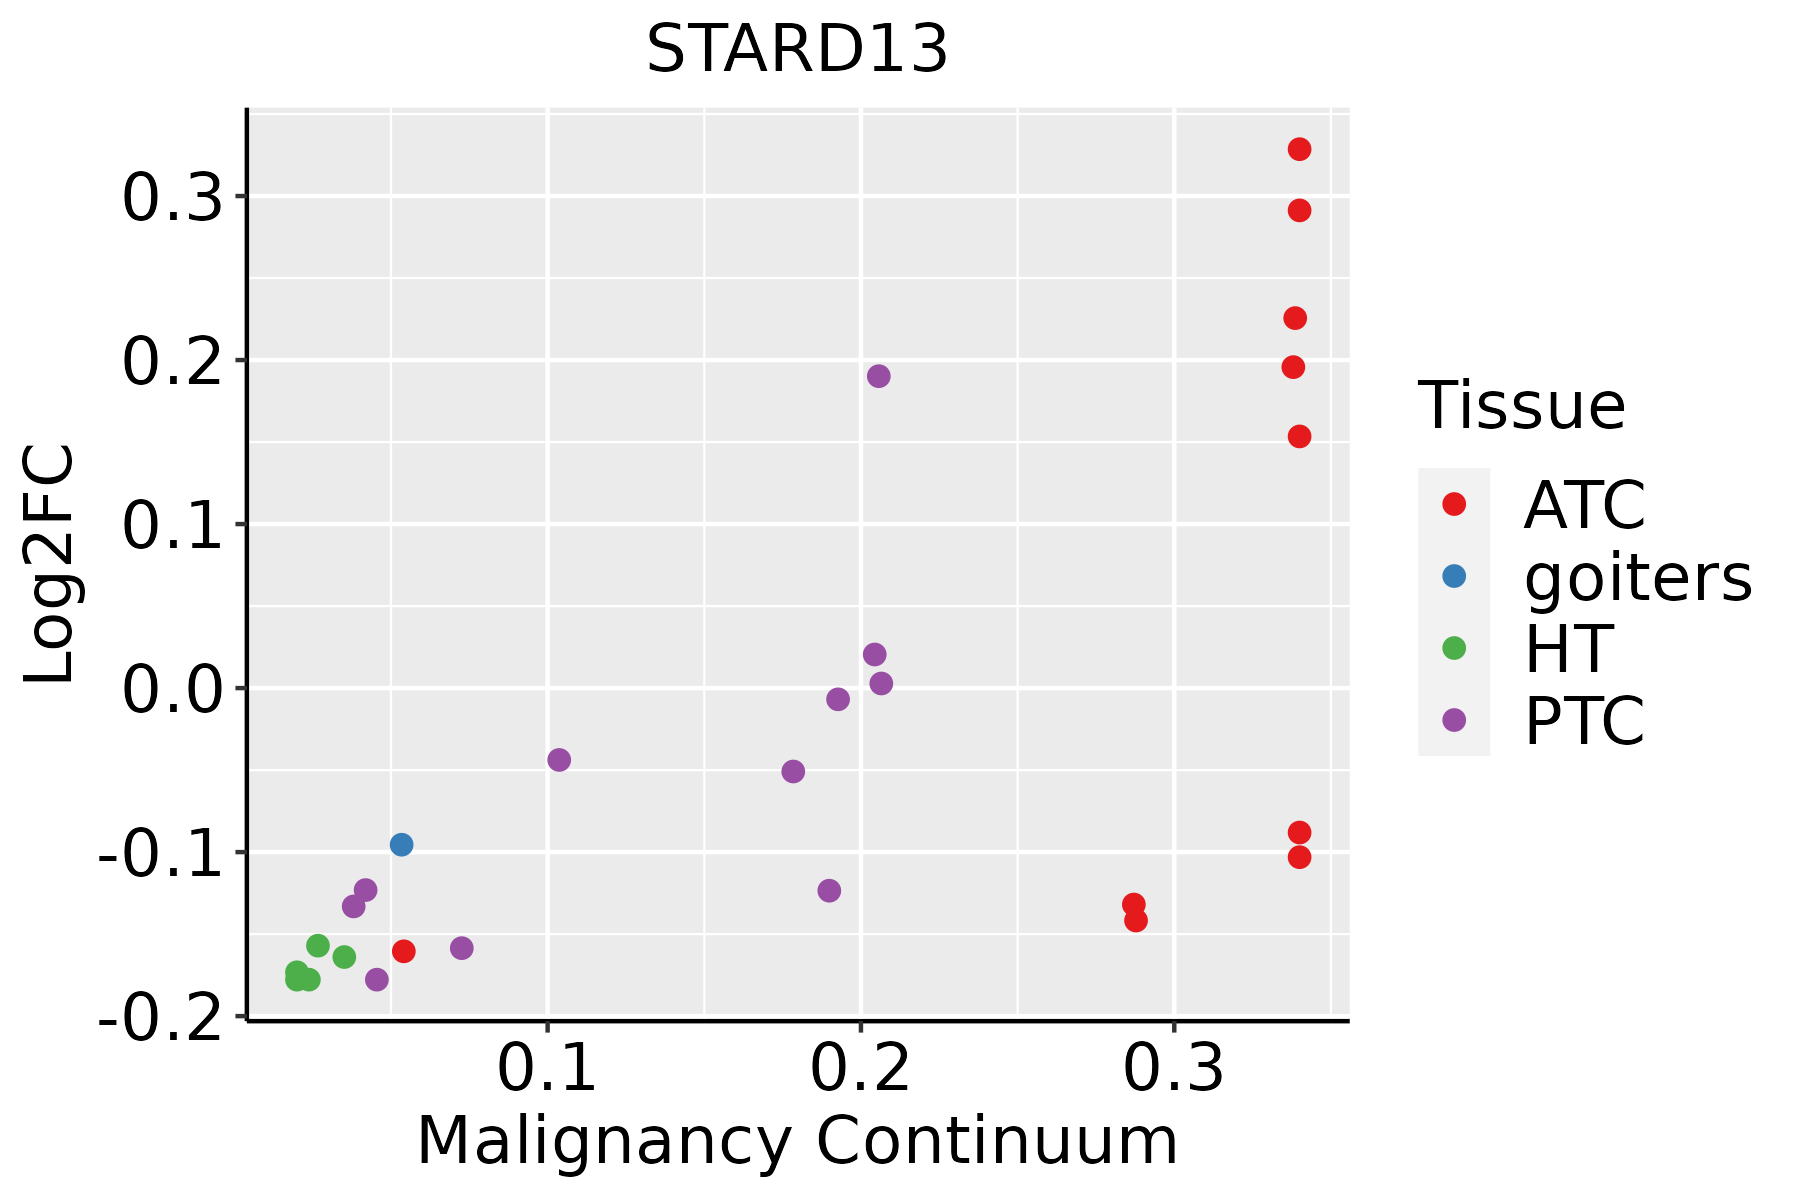 | ATC: Anaplastic thyroid cancer |
| HT: Hashimoto's thyroiditis | ||
| PTC: Papillary thyroid cancer |
| ∗log2FC in expression of this searched gene in stem-like cells from each diseased tissue sample relative to stem-like cells in normal samples in each tissue plotted against the malignancy continuum. Samples are colored based on if they are from different disease stage. |
Top |
Malignant transformation related pathway analysis |
| Find out the enriched GO biological processes and KEGG pathways involved in transition from healthy to precancer to cancer |
| Tissue | Disease Stage | Enriched GO biological Processes |
| Colorectum | AD |  |
| Colorectum | SER |  |
| Colorectum | MSS |  |
| Colorectum | MSI-H |  |
| Colorectum | FAP |  |
| ∗Top 15 enriched GO BP terms are showed in the bar plot of each disease state in each tissue. Each row represents a significant GO biological process which is colored according to the -log10(p.adjust). |
| Page: 1 2 3 4 5 6 7 8 9 |
| GO ID | Tissue | Disease Stage | Description | Gene Ratio | Bg Ratio | pvalue | p.adjust | Count |
| GO:00016677 | Lung | IAC | ameboidal-type cell migration | 80/2061 | 475/18723 | 6.90e-05 | 1.47e-03 | 80 |
| GO:00031587 | Lung | IAC | endothelium development | 28/2061 | 136/18723 | 7.79e-04 | 1.01e-02 | 28 |
| GO:00350234 | Lung | IAC | regulation of Rho protein signal transduction | 20/2061 | 86/18723 | 8.82e-04 | 1.11e-02 | 20 |
| GO:2000146 | Lung | IAC | negative regulation of cell motility | 56/2061 | 359/18723 | 4.58e-03 | 3.62e-02 | 56 |
| GO:0030336 | Lung | IAC | negative regulation of cell migration | 54/2061 | 344/18723 | 4.65e-03 | 3.66e-02 | 54 |
| GO:0051271 | Lung | IAC | negative regulation of cellular component movement | 57/2061 | 367/18723 | 4.67e-03 | 3.67e-02 | 57 |
| GO:0010594 | Lung | IAC | regulation of endothelial cell migration | 39/2061 | 232/18723 | 4.73e-03 | 3.68e-02 | 39 |
| GO:0040013 | Lung | IAC | negative regulation of locomotion | 60/2061 | 391/18723 | 4.94e-03 | 3.78e-02 | 60 |
| GO:00435425 | Lung | IAC | endothelial cell migration | 45/2061 | 279/18723 | 5.62e-03 | 4.14e-02 | 45 |
| GO:005105611 | Lung | AIS | regulation of small GTPase mediated signal transduction | 66/1849 | 302/18723 | 4.26e-10 | 9.53e-08 | 66 |
| GO:000726512 | Lung | AIS | Ras protein signal transduction | 60/1849 | 337/18723 | 4.68e-06 | 2.31e-04 | 60 |
| GO:004657812 | Lung | AIS | regulation of Ras protein signal transduction | 39/1849 | 189/18723 | 6.68e-06 | 2.95e-04 | 39 |
| GO:006056211 | Lung | AIS | epithelial tube morphogenesis | 57/1849 | 325/18723 | 1.27e-05 | 4.78e-04 | 57 |
| GO:000166713 | Lung | AIS | ameboidal-type cell migration | 73/1849 | 475/18723 | 8.91e-05 | 2.20e-03 | 73 |
| GO:000726612 | Lung | AIS | Rho protein signal transduction | 28/1849 | 137/18723 | 1.51e-04 | 3.22e-03 | 28 |
| GO:009013211 | Lung | AIS | epithelium migration | 56/1849 | 360/18723 | 4.14e-04 | 7.14e-03 | 56 |
| GO:001063211 | Lung | AIS | regulation of epithelial cell migration | 47/1849 | 292/18723 | 5.47e-04 | 8.65e-03 | 47 |
| GO:009013011 | Lung | AIS | tissue migration | 56/1849 | 365/18723 | 5.85e-04 | 9.03e-03 | 56 |
| GO:001063111 | Lung | AIS | epithelial cell migration | 55/1849 | 357/18723 | 5.89e-04 | 9.03e-03 | 55 |
| GO:003502312 | Lung | AIS | regulation of Rho protein signal transduction | 18/1849 | 86/18723 | 1.62e-03 | 1.87e-02 | 18 |
| Page: 1 2 3 4 5 6 7 8 9 10 11 |
| Pathway ID | Tissue | Disease Stage | Description | Gene Ratio | Bg Ratio | pvalue | p.adjust | qvalue | Count |
| Page: 1 |
Top |
Cell-cell communication analysis |
| Identification of potential cell-cell interactions between two cell types and their ligand-receptor pairs for different disease states |
| Ligand | Receptor | LRpair | Pathway | Tissue | Disease Stage |
| Page: 1 |
Top |
Single-cell gene regulatory network inference analysis |
| Find out the significant the regulons (TFs) and the target genes of each regulon across cell types for different disease states |
| TF | Cell Type | Tissue | Disease Stage | Target Gene | RSS | Regulon Activity |
| ∗The dot plots of a searched regulon are shown for all cell subpopulations in each disease state of each tissue based on the regulon specific score inferred using pySCENIC and by calculating the average expression. |
| Page: 1 |
Top |
Somatic mutation of malignant transformation related genes |
| Annotation of somatic variants for genes involved in malignant transformation |
| Hugo Symbol | Variant Class | Variant Classification | dbSNP RS | HGVSc | HGVSp | HGVSp Short | SWISSPROT | BIOTYPE | SIFT | PolyPhen | Tumor Sample Barcode | Tissue | Histology | Sex | Age | Stage | Therapy Types | Drugs | Outcome |
| STARD13 | SNV | Missense_Mutation | c.125G>C | p.Ser42Thr | p.S42T | Q9Y3M8 | protein_coding | tolerated(0.23) | benign(0.078) | TCGA-A2-A0EY-01 | Breast | breast invasive carcinoma | Female | <65 | I/II | Chemotherapy | adriamycin | SD | |
| STARD13 | insertion | Nonsense_Mutation | novel | c.3128_3129insAAAATAACATTAAAGGAGACTTATGTGTTAACGCTTTGTTTCTGCTA | p.Gly1044LysfsTer2 | p.G1044Kfs*2 | Q9Y3M8 | protein_coding | TCGA-A8-A07J-01 | Breast | breast invasive carcinoma | Female | <65 | I/II | Chemotherapy | 5-fluorouracil | CR | ||
| STARD13 | insertion | Frame_Shift_Ins | novel | c.3094_3095insACAGTATTTTATTCATTGTTATCTTGCCAATGGAAATAAAGTATGA | p.Leu1032HisfsTer21 | p.L1032Hfs*21 | Q9Y3M8 | protein_coding | TCGA-AR-A0TY-01 | Breast | breast invasive carcinoma | Female | <65 | I/II | Unspecific | Paclitaxel | PD | ||
| STARD13 | SNV | Missense_Mutation | novel | c.3265N>G | p.Leu1089Val | p.L1089V | Q9Y3M8 | protein_coding | deleterious(0.02) | benign(0.127) | TCGA-C5-A8YQ-01 | Cervix | cervical & endocervical cancer | Female | >=65 | I/II | Chemotherapy | cisplatin | PD |
| STARD13 | SNV | Missense_Mutation | c.2775N>A | p.Phe925Leu | p.F925L | Q9Y3M8 | protein_coding | deleterious(0) | benign(0.387) | TCGA-AA-3510-01 | Colorectum | colon adenocarcinoma | Male | >=65 | I/II | Unknown | Unknown | SD | |
| STARD13 | SNV | Missense_Mutation | c.3058A>G | p.Thr1020Ala | p.T1020A | Q9Y3M8 | protein_coding | deleterious(0.01) | possibly_damaging(0.674) | TCGA-AA-3864-01 | Colorectum | colon adenocarcinoma | Male | >=65 | I/II | Unknown | Unknown | SD | |
| STARD13 | SNV | Missense_Mutation | c.1243N>A | p.Leu415Ile | p.L415I | Q9Y3M8 | protein_coding | deleterious(0.01) | probably_damaging(0.946) | TCGA-AA-3877-01 | Colorectum | colon adenocarcinoma | Female | >=65 | I/II | Unknown | Unknown | SD | |
| STARD13 | SNV | Missense_Mutation | novel | c.3108N>G | p.His1036Gln | p.H1036Q | Q9Y3M8 | protein_coding | deleterious(0.01) | probably_damaging(0.932) | TCGA-AA-3980-01 | Colorectum | colon adenocarcinoma | Female | >=65 | I/II | Unknown | Unknown | SD |
| STARD13 | SNV | Missense_Mutation | novel | c.461N>A | p.Ser154Tyr | p.S154Y | Q9Y3M8 | protein_coding | deleterious(0) | possibly_damaging(0.878) | TCGA-AZ-4315-01 | Colorectum | colon adenocarcinoma | Male | <65 | I/II | Unknown | Unknown | SD |
| STARD13 | SNV | Missense_Mutation | c.1173N>T | p.Glu391Asp | p.E391D | Q9Y3M8 | protein_coding | tolerated(0.13) | benign(0.019) | TCGA-CA-6718-01 | Colorectum | colon adenocarcinoma | Male | <65 | I/II | Unknown | Unknown | PD |
| Page: 1 2 3 4 5 6 7 8 9 10 11 12 |
Top |
Related drugs of malignant transformation related genes |
| Identification of chemicals and drugs interact with genes involved in malignant transfromation |
| (DGIdb 4.0) |
| Entrez ID | Symbol | Category | Interaction Types | Drug Claim Name | Drug Name | PMIDs |
| Page: 1 |

Copyright 2023-Present -The University of Texas Health Science Center at Houston |