
|
|||||
|
 | |
| |
| |
| |
| |
| |
|
Gene: STAM |
Gene summary for STAM |
| Gene information | Species | Human | Gene symbol | STAM | Gene ID | 8027 |
| Gene name | signal transducing adaptor molecule | |
| Gene Alias | STAM-1 | |
| Cytomap | 10p12.33 | |
| Gene Type | protein-coding | GO ID | GO:0006508 | UniProtAcc | B4DZT2 |
Top |
Malignant transformation analysis |
| Identification of the aberrant gene expression in precancerous and cancerous lesions by comparing the gene expression of stem-like cells in diseased tissues with normal stem cells |
| Entrez ID | Symbol | Replicates | Species | Organ | Tissue | Adj P-value | Log2FC | Malignancy |
| 8027 | STAM | LZE4T | Human | Esophagus | ESCC | 1.41e-07 | 2.39e-01 | 0.0811 |
| 8027 | STAM | LZE24T | Human | Esophagus | ESCC | 5.99e-10 | 1.44e-01 | 0.0596 |
| 8027 | STAM | P1T-E | Human | Esophagus | ESCC | 7.72e-05 | 1.64e-01 | 0.0875 |
| 8027 | STAM | P2T-E | Human | Esophagus | ESCC | 3.58e-21 | 2.05e-01 | 0.1177 |
| 8027 | STAM | P4T-E | Human | Esophagus | ESCC | 1.76e-16 | 2.65e-01 | 0.1323 |
| 8027 | STAM | P5T-E | Human | Esophagus | ESCC | 2.11e-17 | 1.95e-01 | 0.1327 |
| 8027 | STAM | P8T-E | Human | Esophagus | ESCC | 6.12e-10 | 6.72e-02 | 0.0889 |
| 8027 | STAM | P9T-E | Human | Esophagus | ESCC | 1.02e-04 | -3.84e-02 | 0.1131 |
| 8027 | STAM | P10T-E | Human | Esophagus | ESCC | 1.20e-19 | 8.40e-02 | 0.116 |
| 8027 | STAM | P11T-E | Human | Esophagus | ESCC | 9.14e-10 | 3.60e-01 | 0.1426 |
| 8027 | STAM | P12T-E | Human | Esophagus | ESCC | 2.37e-14 | 2.17e-01 | 0.1122 |
| 8027 | STAM | P15T-E | Human | Esophagus | ESCC | 1.65e-21 | 2.04e-01 | 0.1149 |
| 8027 | STAM | P16T-E | Human | Esophagus | ESCC | 3.04e-15 | 2.33e-01 | 0.1153 |
| 8027 | STAM | P17T-E | Human | Esophagus | ESCC | 4.64e-02 | 1.62e-01 | 0.1278 |
| 8027 | STAM | P20T-E | Human | Esophagus | ESCC | 5.76e-06 | 1.24e-01 | 0.1124 |
| 8027 | STAM | P21T-E | Human | Esophagus | ESCC | 5.35e-22 | 5.23e-01 | 0.1617 |
| 8027 | STAM | P22T-E | Human | Esophagus | ESCC | 9.65e-04 | 6.26e-02 | 0.1236 |
| 8027 | STAM | P23T-E | Human | Esophagus | ESCC | 1.75e-04 | 6.83e-02 | 0.108 |
| 8027 | STAM | P24T-E | Human | Esophagus | ESCC | 8.13e-10 | 1.68e-01 | 0.1287 |
| 8027 | STAM | P26T-E | Human | Esophagus | ESCC | 5.83e-19 | 4.14e-01 | 0.1276 |
| Page: 1 2 3 4 5 |
| Tissue | Expression Dynamics | Abbreviation |
| Esophagus | 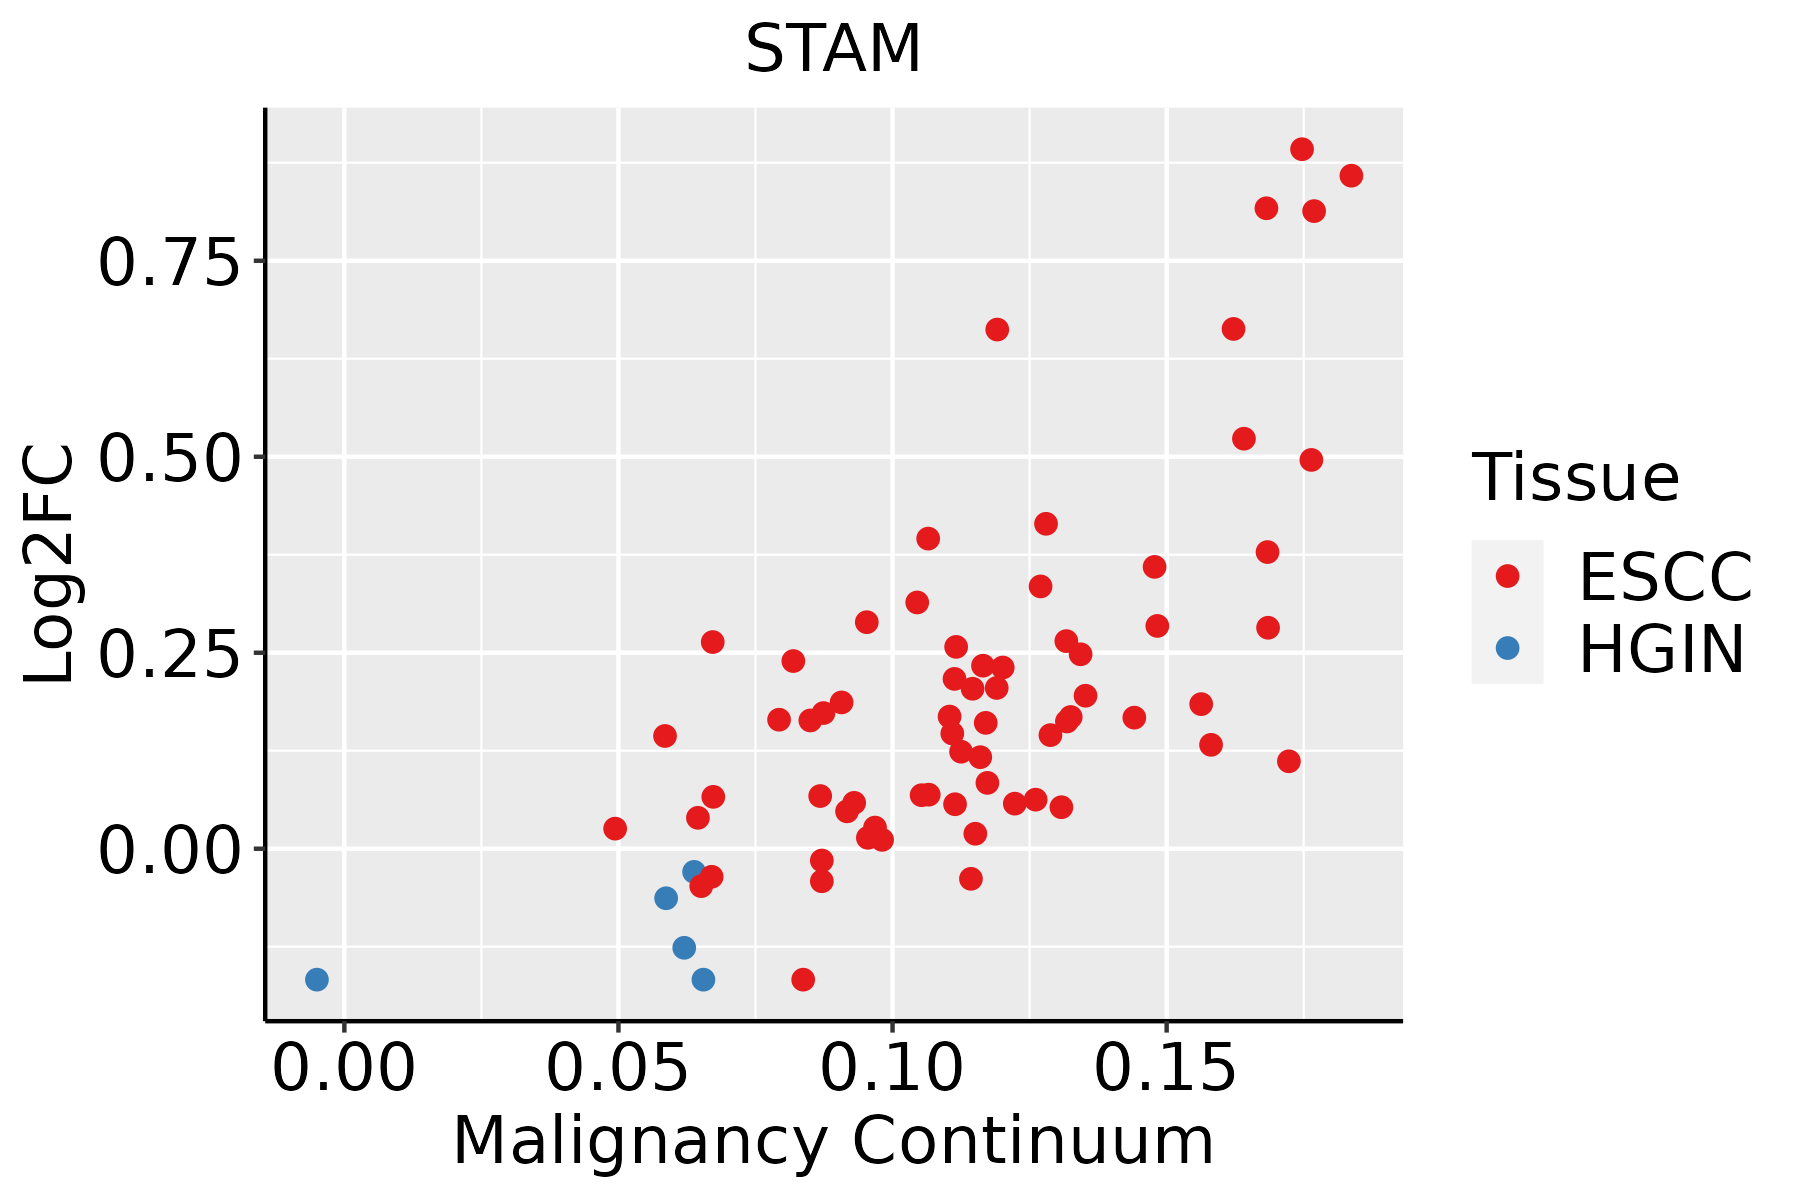 | ESCC: Esophageal squamous cell carcinoma |
| HGIN: High-grade intraepithelial neoplasias | ||
| LGIN: Low-grade intraepithelial neoplasias | ||
| Liver | 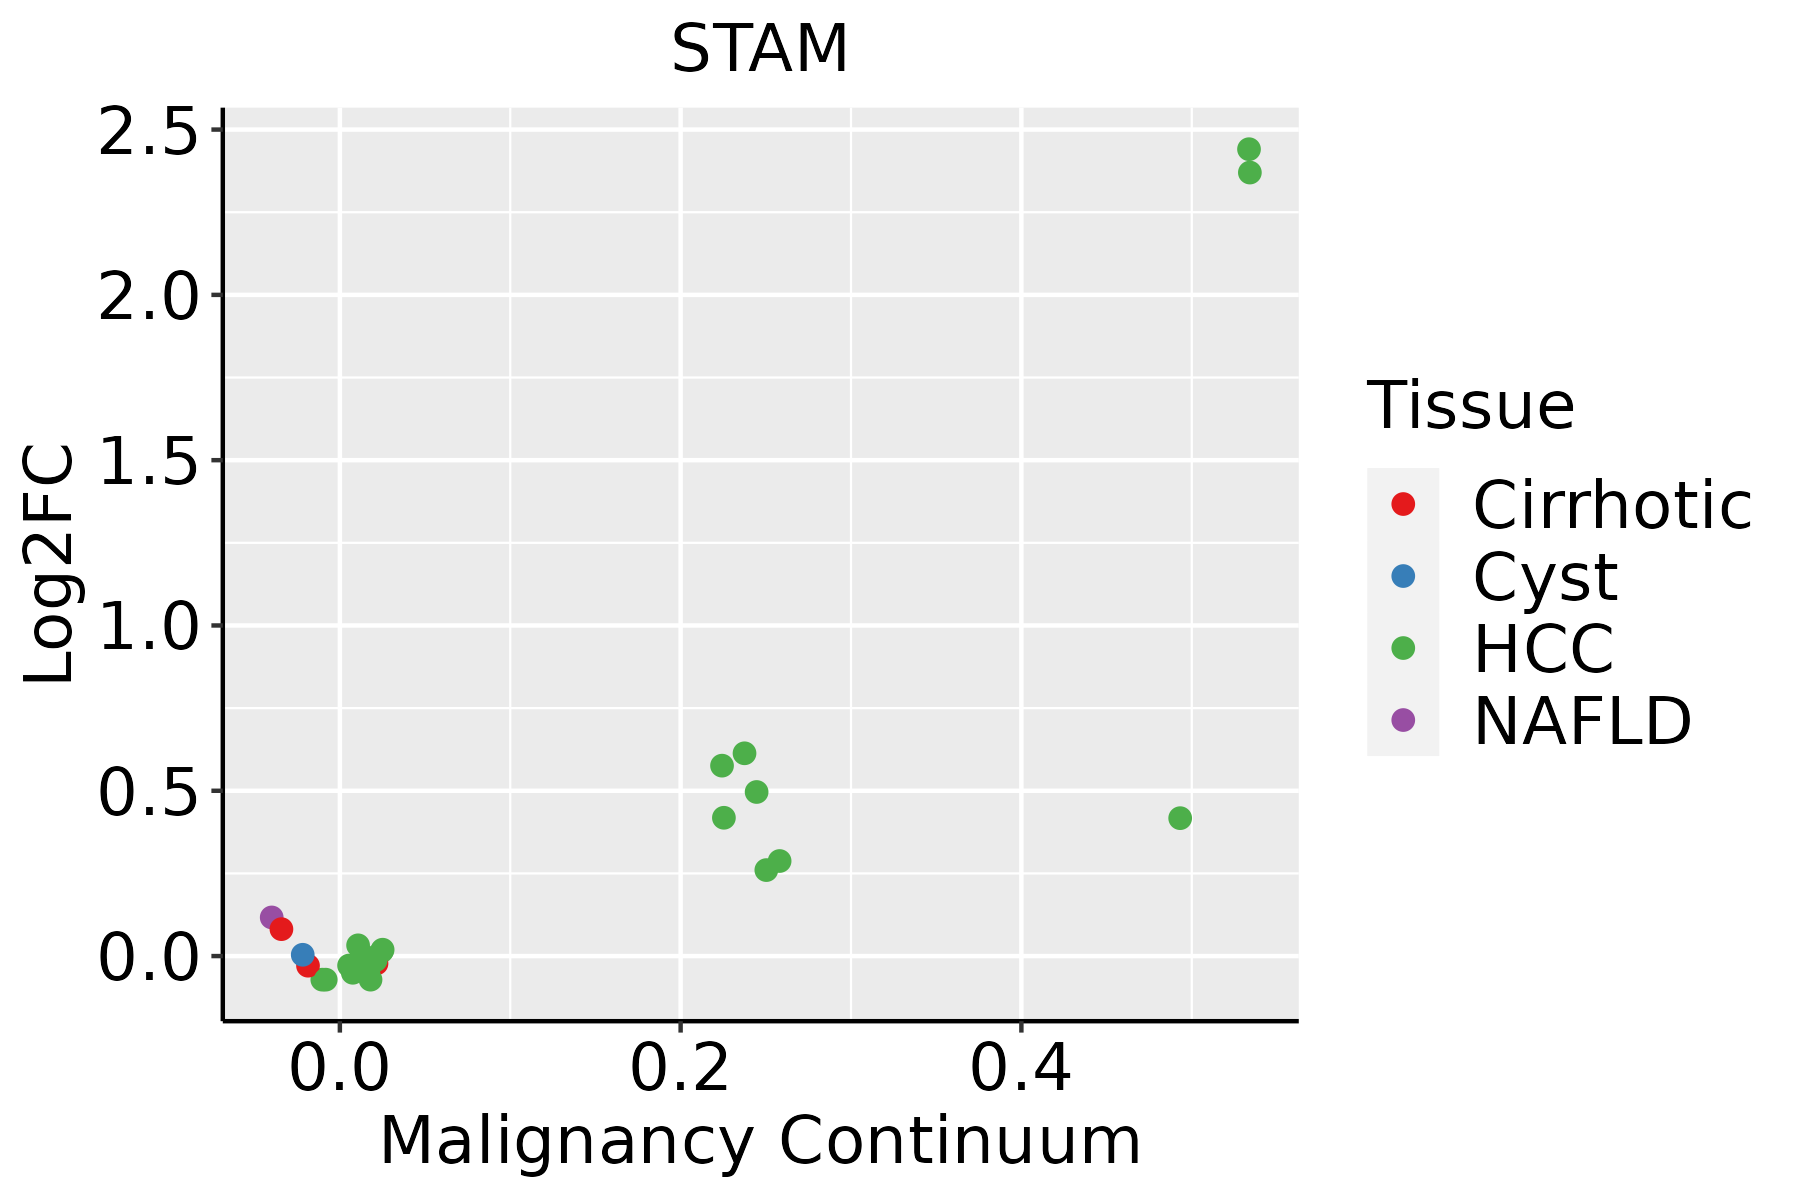 | HCC: Hepatocellular carcinoma |
| NAFLD: Non-alcoholic fatty liver disease | ||
| Oral Cavity | 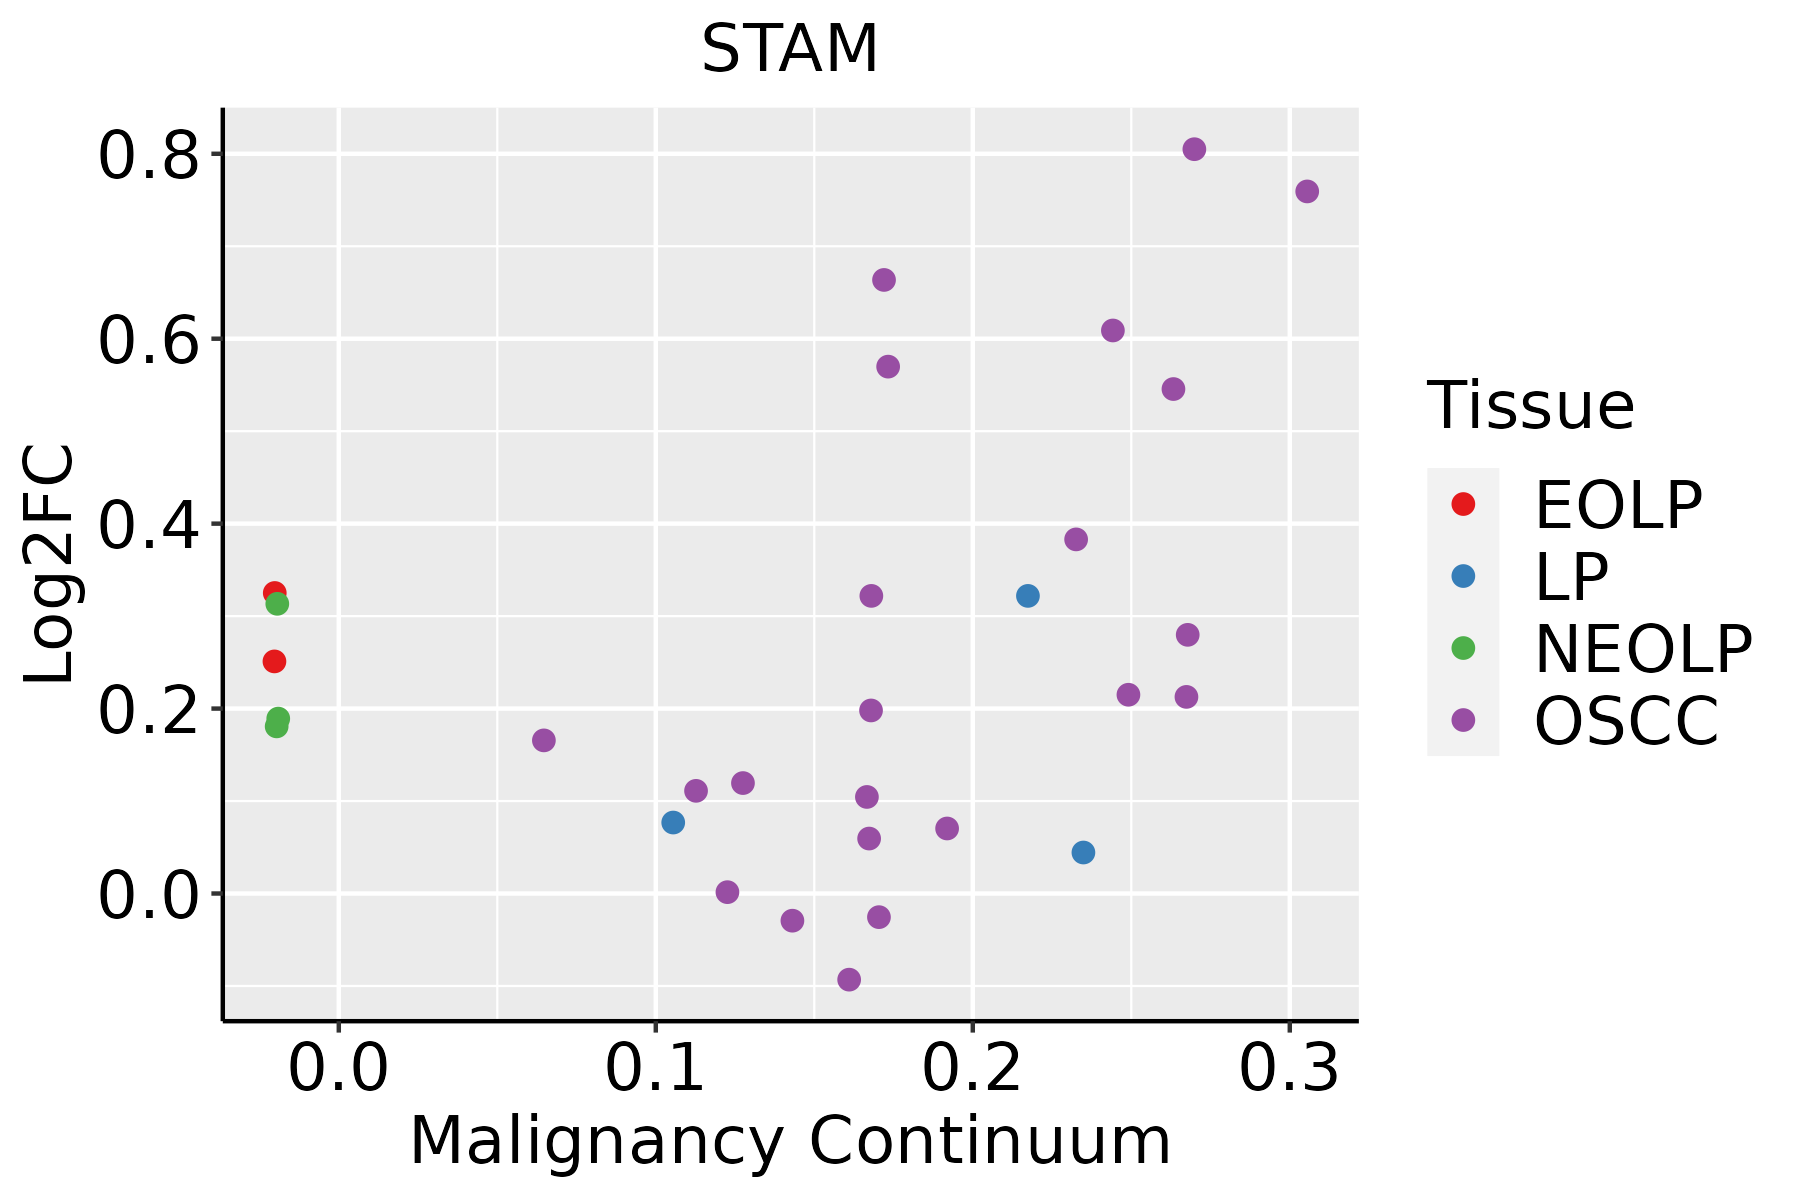 | EOLP: Erosive Oral lichen planus |
| LP: leukoplakia | ||
| NEOLP: Non-erosive oral lichen planus | ||
| OSCC: Oral squamous cell carcinoma | ||
| Thyroid | 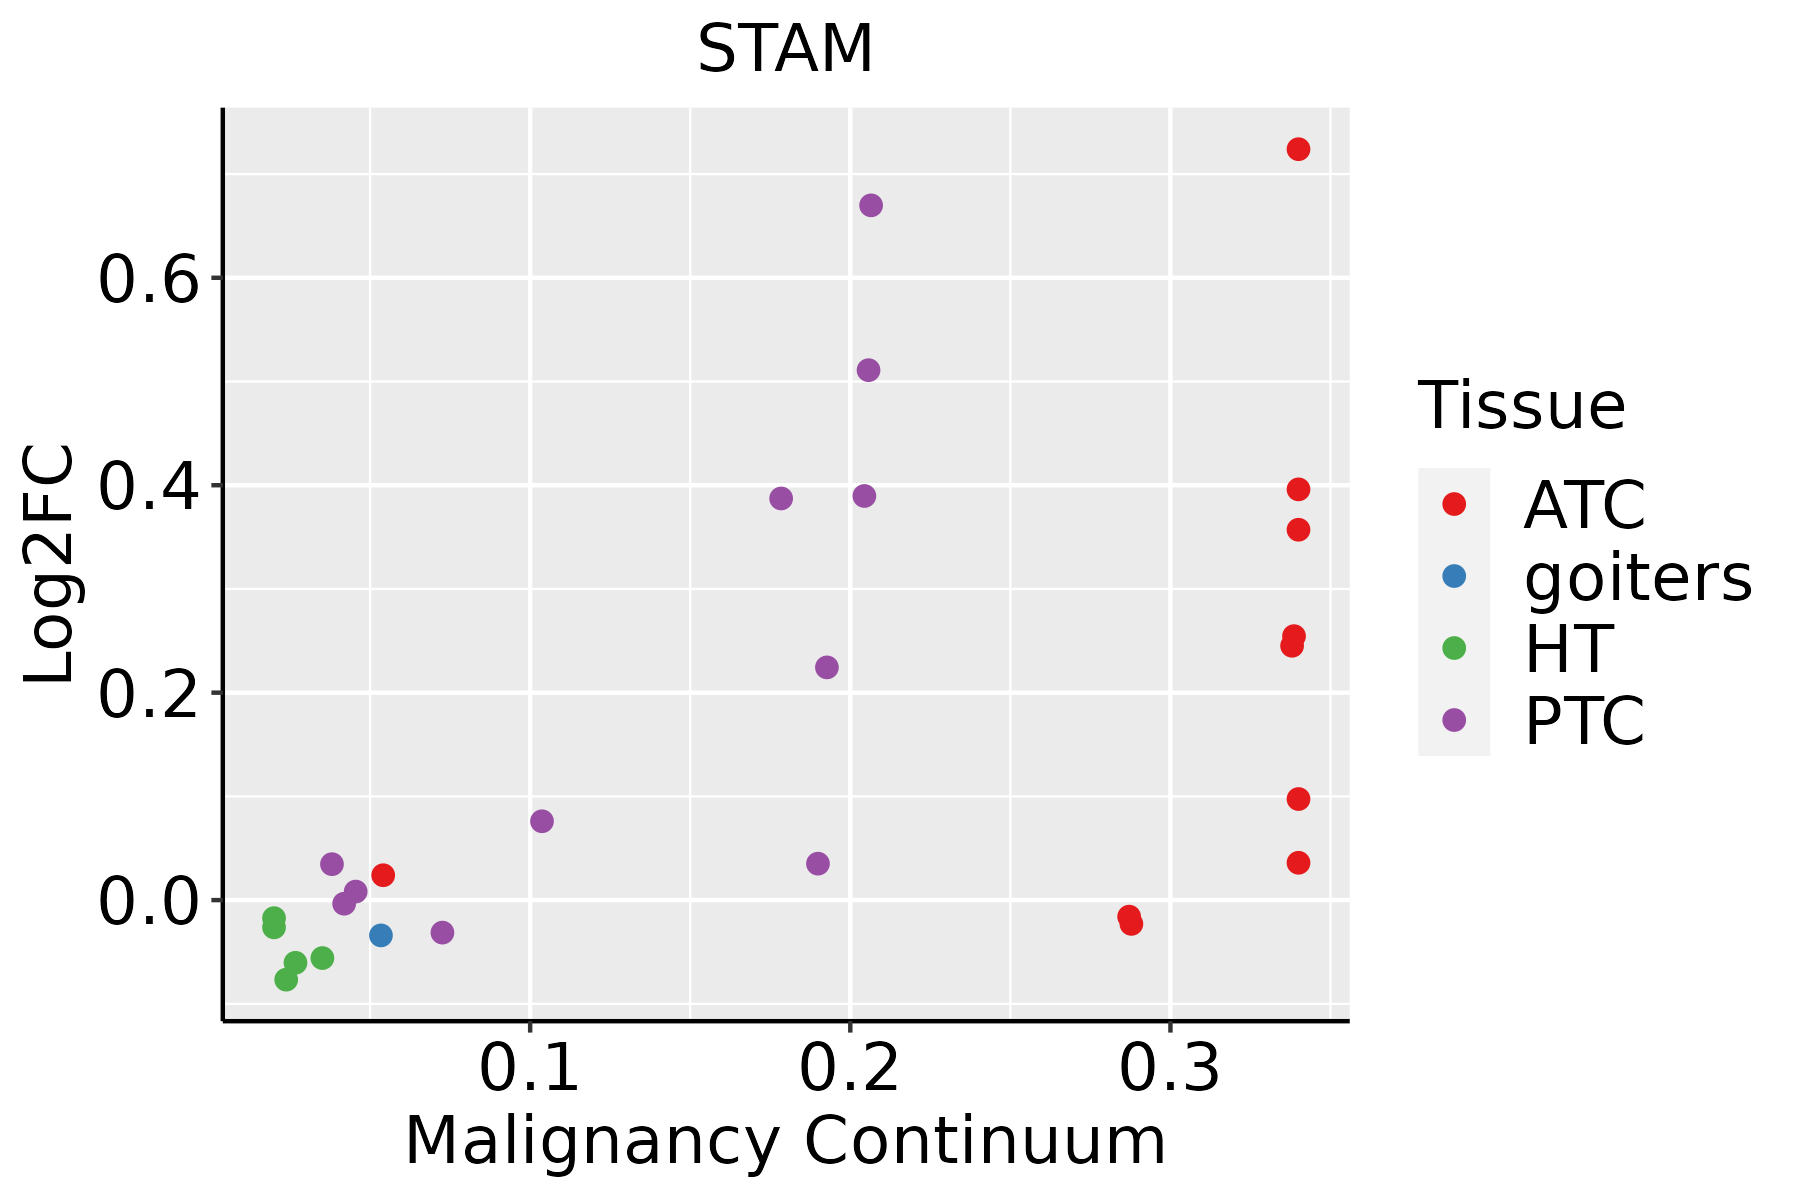 | ATC: Anaplastic thyroid cancer |
| HT: Hashimoto's thyroiditis | ||
| PTC: Papillary thyroid cancer |
| ∗log2FC in expression of this searched gene in stem-like cells from each diseased tissue sample relative to stem-like cells in normal samples in each tissue plotted against the malignancy continuum. Samples are colored based on if they are from different disease stage. |
Top |
Malignant transformation related pathway analysis |
| Find out the enriched GO biological processes and KEGG pathways involved in transition from healthy to precancer to cancer |
| Tissue | Disease Stage | Enriched GO biological Processes |
| Colorectum | AD |  |
| Colorectum | SER |  |
| Colorectum | MSS |  |
| Colorectum | MSI-H |  |
| Colorectum | FAP |  |
| ∗Top 15 enriched GO BP terms are showed in the bar plot of each disease state in each tissue. Each row represents a significant GO biological process which is colored according to the -log10(p.adjust). |
| Page: 1 2 3 4 5 6 7 8 9 |
| GO ID | Tissue | Disease Stage | Description | Gene Ratio | Bg Ratio | pvalue | p.adjust | Count |
| GO:190354115 | Thyroid | PTC | regulation of exosomal secretion | 14/5968 | 17/18723 | 2.62e-05 | 2.56e-04 | 14 |
| GO:00610256 | Thyroid | PTC | membrane fusion | 77/5968 | 163/18723 | 2.86e-05 | 2.78e-04 | 77 |
| GO:007266610 | Thyroid | PTC | establishment of protein localization to vacuole | 29/5968 | 49/18723 | 7.32e-05 | 6.31e-04 | 29 |
| GO:0034612111 | Thyroid | PTC | response to tumor necrosis factor | 109/5968 | 253/18723 | 1.08e-04 | 8.69e-04 | 109 |
| GO:00616408 | Thyroid | PTC | cytoskeleton-dependent cytokinesis | 50/5968 | 100/18723 | 1.20e-04 | 9.59e-04 | 50 |
| GO:00510586 | Thyroid | PTC | negative regulation of small GTPase mediated signal transduction | 31/5968 | 56/18723 | 2.32e-04 | 1.68e-03 | 31 |
| GO:00706465 | Thyroid | PTC | protein modification by small protein removal | 71/5968 | 157/18723 | 3.03e-04 | 2.12e-03 | 71 |
| GO:004592614 | Thyroid | PTC | negative regulation of growth | 105/5968 | 249/18723 | 3.76e-04 | 2.54e-03 | 105 |
| GO:00465805 | Thyroid | PTC | negative regulation of Ras protein signal transduction | 27/5968 | 49/18723 | 6.38e-04 | 4.02e-03 | 27 |
| GO:0071356111 | Thyroid | PTC | cellular response to tumor necrosis factor | 96/5968 | 229/18723 | 8.24e-04 | 5.10e-03 | 96 |
| GO:00303087 | Thyroid | PTC | negative regulation of cell growth | 80/5968 | 188/18723 | 1.28e-03 | 7.31e-03 | 80 |
| GO:00705363 | Thyroid | PTC | protein K63-linked deubiquitination | 20/5968 | 35/18723 | 1.75e-03 | 9.51e-03 | 20 |
| GO:00165794 | Thyroid | PTC | protein deubiquitination | 59/5968 | 139/18723 | 5.50e-03 | 2.50e-02 | 59 |
| GO:00431625 | Thyroid | PTC | ubiquitin-dependent protein catabolic process via the multivesicular body sorting pathway | 13/5968 | 23/18723 | 1.25e-02 | 4.88e-02 | 13 |
| GO:007259429 | Thyroid | ATC | establishment of protein localization to organelle | 247/6293 | 422/18723 | 2.88e-26 | 1.40e-23 | 247 |
| GO:001623623 | Thyroid | ATC | macroautophagy | 169/6293 | 291/18723 | 6.56e-18 | 7.69e-16 | 169 |
| GO:001605023 | Thyroid | ATC | vesicle organization | 166/6293 | 300/18723 | 6.14e-15 | 3.92e-13 | 166 |
| GO:001619719 | Thyroid | ATC | endosomal transport | 128/6293 | 230/18723 | 4.44e-12 | 1.75e-10 | 128 |
| GO:000726524 | Thyroid | ATC | Ras protein signal transduction | 172/6293 | 337/18723 | 2.25e-11 | 7.96e-10 | 172 |
| GO:000028117 | Thyroid | ATC | mitotic cytokinesis | 50/6293 | 71/18723 | 2.46e-10 | 7.10e-09 | 50 |
| Page: 1 2 3 4 5 6 7 8 9 10 |
| Pathway ID | Tissue | Disease Stage | Description | Gene Ratio | Bg Ratio | pvalue | p.adjust | qvalue | Count |
| hsa04144210 | Esophagus | ESCC | Endocytosis | 186/4205 | 251/8465 | 9.74e-16 | 4.66e-14 | 2.39e-14 | 186 |
| hsa0414437 | Esophagus | ESCC | Endocytosis | 186/4205 | 251/8465 | 9.74e-16 | 4.66e-14 | 2.39e-14 | 186 |
| hsa0414422 | Liver | HCC | Endocytosis | 178/4020 | 251/8465 | 2.03e-14 | 5.22e-13 | 2.91e-13 | 178 |
| hsa0414432 | Liver | HCC | Endocytosis | 178/4020 | 251/8465 | 2.03e-14 | 5.22e-13 | 2.91e-13 | 178 |
| hsa0414427 | Oral cavity | OSCC | Endocytosis | 174/3704 | 251/8465 | 9.42e-17 | 4.51e-15 | 2.29e-15 | 174 |
| hsa04144112 | Oral cavity | OSCC | Endocytosis | 174/3704 | 251/8465 | 9.42e-17 | 4.51e-15 | 2.29e-15 | 174 |
| hsa0414442 | Oral cavity | EOLP | Endocytosis | 71/1218 | 251/8465 | 5.28e-09 | 8.97e-08 | 5.29e-08 | 71 |
| hsa04630 | Oral cavity | EOLP | JAK-STAT signaling pathway | 35/1218 | 166/8465 | 1.15e-02 | 3.07e-02 | 1.81e-02 | 35 |
| hsa0414452 | Oral cavity | EOLP | Endocytosis | 71/1218 | 251/8465 | 5.28e-09 | 8.97e-08 | 5.29e-08 | 71 |
| hsa046301 | Oral cavity | EOLP | JAK-STAT signaling pathway | 35/1218 | 166/8465 | 1.15e-02 | 3.07e-02 | 1.81e-02 | 35 |
| hsa0414461 | Oral cavity | NEOLP | Endocytosis | 62/1112 | 251/8465 | 3.56e-07 | 4.92e-06 | 3.09e-06 | 62 |
| hsa0414471 | Oral cavity | NEOLP | Endocytosis | 62/1112 | 251/8465 | 3.56e-07 | 4.92e-06 | 3.09e-06 | 62 |
| Page: 1 |
Top |
Cell-cell communication analysis |
| Identification of potential cell-cell interactions between two cell types and their ligand-receptor pairs for different disease states |
| Ligand | Receptor | LRpair | Pathway | Tissue | Disease Stage |
| Page: 1 |
Top |
Single-cell gene regulatory network inference analysis |
| Find out the significant the regulons (TFs) and the target genes of each regulon across cell types for different disease states |
| TF | Cell Type | Tissue | Disease Stage | Target Gene | RSS | Regulon Activity |
| ∗The dot plots of a searched regulon are shown for all cell subpopulations in each disease state of each tissue based on the regulon specific score inferred using pySCENIC and by calculating the average expression. |
| Page: 1 |
Top |
Somatic mutation of malignant transformation related genes |
| Annotation of somatic variants for genes involved in malignant transformation |
| Hugo Symbol | Variant Class | Variant Classification | dbSNP RS | HGVSc | HGVSp | HGVSp Short | SWISSPROT | BIOTYPE | SIFT | PolyPhen | Tumor Sample Barcode | Tissue | Histology | Sex | Age | Stage | Therapy Types | Drugs | Outcome |
| STAM | SNV | Missense_Mutation | novel | c.697N>A | p.Ala233Thr | p.A233T | Q92783 | protein_coding | tolerated(0.32) | benign(0.266) | TCGA-A8-A085-01 | Breast | breast invasive carcinoma | Male | <65 | I/II | Hormone Therapy | tamoxiphen | SD |
| STAM | SNV | Missense_Mutation | c.98G>A | p.Cys33Tyr | p.C33Y | Q92783 | protein_coding | deleterious(0) | probably_damaging(0.999) | TCGA-AN-A0FV-01 | Breast | breast invasive carcinoma | Female | <65 | I/II | Unknown | Unknown | SD | |
| STAM | SNV | Missense_Mutation | rs782454144 | c.1499N>G | p.Asn500Ser | p.N500S | Q92783 | protein_coding | tolerated_low_confidence(0.11) | benign(0.03) | TCGA-B6-A0RQ-01 | Breast | breast invasive carcinoma | Female | >=65 | I/II | Unknown | Unknown | SD |
| STAM | SNV | Missense_Mutation | rs782048712 | c.328N>A | p.Ala110Thr | p.A110T | Q92783 | protein_coding | tolerated(0.13) | benign(0.41) | TCGA-JL-A3YW-01 | Breast | breast invasive carcinoma | Female | <65 | I/II | Unknown | Unknown | SD |
| STAM | SNV | Missense_Mutation | c.811N>A | p.Glu271Lys | p.E271K | Q92783 | protein_coding | deleterious(0) | probably_damaging(0.968) | TCGA-IR-A3LK-01 | Cervix | cervical & endocervical cancer | Female | >=65 | I/II | Chemotherapy | cisplatin | PD | |
| STAM | SNV | Missense_Mutation | rs782237766 | c.1307C>G | p.Ser436Cys | p.S436C | Q92783 | protein_coding | deleterious(0.05) | benign(0.241) | TCGA-JW-A5VL-01 | Cervix | cervical & endocervical cancer | Female | <65 | I/II | Unknown | Unknown | SD |
| STAM | SNV | Missense_Mutation | novel | c.997N>C | p.Glu333Gln | p.E333Q | Q92783 | protein_coding | deleterious(0) | probably_damaging(0.986) | TCGA-VS-A8QF-01 | Cervix | cervical & endocervical cancer | Female | <65 | I/II | Chemotherapy | cisplatin | CR |
| STAM | SNV | Missense_Mutation | c.1004N>G | p.Met335Arg | p.M335R | Q92783 | protein_coding | tolerated(0.42) | benign(0.012) | TCGA-AA-3510-01 | Colorectum | colon adenocarcinoma | Male | >=65 | I/II | Unknown | Unknown | SD | |
| STAM | SNV | Missense_Mutation | c.1171N>A | p.Pro391Thr | p.P391T | Q92783 | protein_coding | tolerated(0.43) | benign(0.012) | TCGA-AA-3815-01 | Colorectum | colon adenocarcinoma | Female | >=65 | I/II | Unknown | Unknown | SD | |
| STAM | SNV | Missense_Mutation | rs782638753 | c.1429N>A | p.Ala477Thr | p.A477T | Q92783 | protein_coding | tolerated(0.62) | benign(0) | TCGA-AA-3864-01 | Colorectum | colon adenocarcinoma | Male | >=65 | I/II | Unknown | Unknown | SD |
| Page: 1 2 3 4 5 6 |
Top |
Related drugs of malignant transformation related genes |
| Identification of chemicals and drugs interact with genes involved in malignant transfromation |
| (DGIdb 4.0) |
| Entrez ID | Symbol | Category | Interaction Types | Drug Claim Name | Drug Name | PMIDs |
| Page: 1 |

Copyright 2023-Present -The University of Texas Health Science Center at Houston |