
|
|||||
|
 | |
| |
| |
| |
| |
| |
|
Gene: SNCA |
Gene summary for SNCA |
| Gene information | Species | Human | Gene symbol | SNCA | Gene ID | 6622 |
| Gene name | synuclein alpha | |
| Gene Alias | NACP | |
| Cytomap | 4q22.1 | |
| Gene Type | protein-coding | GO ID | GO:0000122 | UniProtAcc | P37840 |
Top |
Malignant transformation analysis |
| Identification of the aberrant gene expression in precancerous and cancerous lesions by comparing the gene expression of stem-like cells in diseased tissues with normal stem cells |
| Entrez ID | Symbol | Replicates | Species | Organ | Tissue | Adj P-value | Log2FC | Malignancy |
| 6622 | SNCA | P2T-E | Human | Esophagus | ESCC | 1.48e-16 | 3.68e-01 | 0.1177 |
| 6622 | SNCA | P8T-E | Human | Esophagus | ESCC | 2.40e-13 | 4.25e-01 | 0.0889 |
| 6622 | SNCA | P9T-E | Human | Esophagus | ESCC | 2.04e-04 | 2.64e-01 | 0.1131 |
| 6622 | SNCA | P10T-E | Human | Esophagus | ESCC | 7.30e-42 | 7.83e-01 | 0.116 |
| 6622 | SNCA | P11T-E | Human | Esophagus | ESCC | 1.77e-09 | 7.33e-01 | 0.1426 |
| 6622 | SNCA | P12T-E | Human | Esophagus | ESCC | 9.01e-04 | 1.91e-01 | 0.1122 |
| 6622 | SNCA | P15T-E | Human | Esophagus | ESCC | 1.09e-28 | 7.95e-01 | 0.1149 |
| 6622 | SNCA | P16T-E | Human | Esophagus | ESCC | 9.44e-10 | 2.42e-01 | 0.1153 |
| 6622 | SNCA | P21T-E | Human | Esophagus | ESCC | 2.61e-10 | 4.90e-01 | 0.1617 |
| 6622 | SNCA | P24T-E | Human | Esophagus | ESCC | 4.21e-04 | 4.65e-02 | 0.1287 |
| 6622 | SNCA | P26T-E | Human | Esophagus | ESCC | 8.01e-13 | 4.86e-01 | 0.1276 |
| 6622 | SNCA | P28T-E | Human | Esophagus | ESCC | 4.97e-05 | 3.39e-01 | 0.1149 |
| 6622 | SNCA | P30T-E | Human | Esophagus | ESCC | 1.14e-08 | 7.63e-01 | 0.137 |
| 6622 | SNCA | P32T-E | Human | Esophagus | ESCC | 3.36e-22 | 7.82e-01 | 0.1666 |
| 6622 | SNCA | P36T-E | Human | Esophagus | ESCC | 2.79e-02 | 6.05e-01 | 0.1187 |
| 6622 | SNCA | P37T-E | Human | Esophagus | ESCC | 1.38e-09 | 2.63e-01 | 0.1371 |
| 6622 | SNCA | P40T-E | Human | Esophagus | ESCC | 3.86e-03 | 3.17e-01 | 0.109 |
| 6622 | SNCA | P49T-E | Human | Esophagus | ESCC | 3.88e-05 | 1.20e+00 | 0.1768 |
| 6622 | SNCA | P52T-E | Human | Esophagus | ESCC | 2.88e-06 | 5.58e-01 | 0.1555 |
| 6622 | SNCA | P57T-E | Human | Esophagus | ESCC | 1.05e-09 | 5.16e-01 | 0.0926 |
| Page: 1 2 3 |
| Tissue | Expression Dynamics | Abbreviation |
| Esophagus | 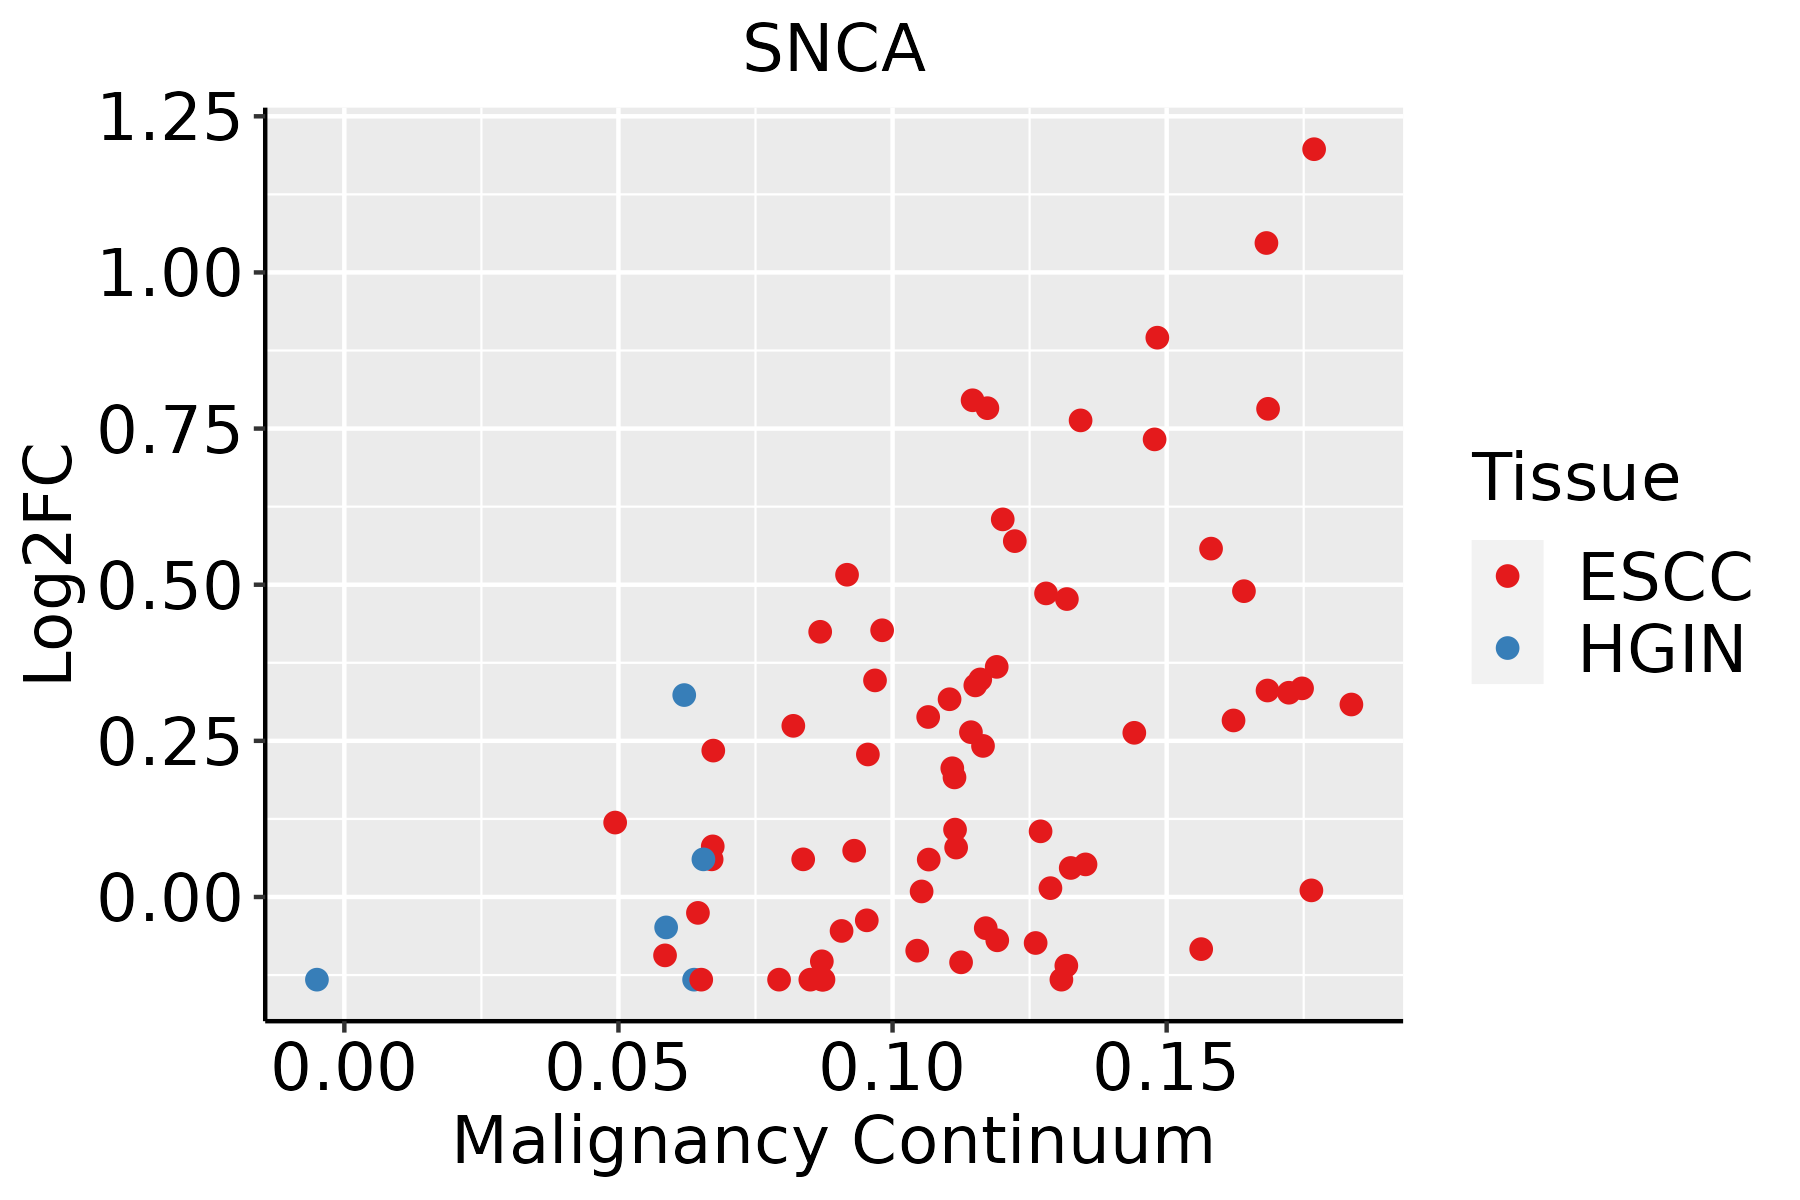 | ESCC: Esophageal squamous cell carcinoma |
| HGIN: High-grade intraepithelial neoplasias | ||
| LGIN: Low-grade intraepithelial neoplasias | ||
| Oral Cavity |  | EOLP: Erosive Oral lichen planus |
| LP: leukoplakia | ||
| NEOLP: Non-erosive oral lichen planus | ||
| OSCC: Oral squamous cell carcinoma |
| ∗log2FC in expression of this searched gene in stem-like cells from each diseased tissue sample relative to stem-like cells in normal samples in each tissue plotted against the malignancy continuum. Samples are colored based on if they are from different disease stage. |
Top |
Malignant transformation related pathway analysis |
| Find out the enriched GO biological processes and KEGG pathways involved in transition from healthy to precancer to cancer |
| Tissue | Disease Stage | Enriched GO biological Processes |
| Colorectum | AD |  |
| Colorectum | SER |  |
| Colorectum | MSS |  |
| Colorectum | MSI-H |  |
| Colorectum | FAP |  |
| ∗Top 15 enriched GO BP terms are showed in the bar plot of each disease state in each tissue. Each row represents a significant GO biological process which is colored according to the -log10(p.adjust). |
| Page: 1 2 3 4 5 6 7 8 9 |
| GO ID | Tissue | Disease Stage | Description | Gene Ratio | Bg Ratio | pvalue | p.adjust | Count |
| GO:00512623 | Esophagus | ESCC | protein tetramerization | 54/8552 | 87/18723 | 1.50e-03 | 7.06e-03 | 54 |
| GO:000223719 | Esophagus | ESCC | response to molecule of bacterial origin | 194/8552 | 363/18723 | 1.64e-03 | 7.61e-03 | 194 |
| GO:00061096 | Esophagus | ESCC | regulation of carbohydrate metabolic process | 101/8552 | 178/18723 | 1.89e-03 | 8.52e-03 | 101 |
| GO:007124117 | Esophagus | ESCC | cellular response to inorganic substance | 125/8552 | 226/18723 | 2.17e-03 | 9.67e-03 | 125 |
| GO:00311138 | Esophagus | ESCC | regulation of microtubule polymerization | 36/8552 | 55/18723 | 2.43e-03 | 1.06e-02 | 36 |
| GO:00019211 | Esophagus | ESCC | positive regulation of receptor recycling | 12/8552 | 14/18723 | 2.51e-03 | 1.08e-02 | 12 |
| GO:190121516 | Esophagus | ESCC | negative regulation of neuron death | 115/8552 | 208/18723 | 3.24e-03 | 1.34e-02 | 115 |
| GO:00512592 | Esophagus | ESCC | protein complex oligomerization | 130/8552 | 238/18723 | 3.29e-03 | 1.36e-02 | 130 |
| GO:006168417 | Esophagus | ESCC | chaperone-mediated autophagy | 13/8552 | 16/18723 | 4.05e-03 | 1.62e-02 | 13 |
| GO:00106755 | Esophagus | ESCC | regulation of cellular carbohydrate metabolic process | 83/8552 | 146/18723 | 4.24e-03 | 1.69e-02 | 83 |
| GO:00484892 | Esophagus | ESCC | synaptic vesicle transport | 28/8552 | 42/18723 | 4.90e-03 | 1.89e-02 | 28 |
| GO:0010640 | Esophagus | ESCC | regulation of platelet-derived growth factor receptor signaling pathway | 17/8552 | 23/18723 | 5.73e-03 | 2.13e-02 | 17 |
| GO:19016174 | Esophagus | ESCC | organic hydroxy compound biosynthetic process | 128/8552 | 237/18723 | 5.86e-03 | 2.16e-02 | 128 |
| GO:00513534 | Esophagus | ESCC | positive regulation of oxidoreductase activity | 37/8552 | 59/18723 | 6.23e-03 | 2.29e-02 | 37 |
| GO:001046620 | Esophagus | ESCC | negative regulation of peptidase activity | 140/8552 | 262/18723 | 6.73e-03 | 2.46e-02 | 140 |
| GO:00331355 | Esophagus | ESCC | regulation of peptidyl-serine phosphorylation | 81/8552 | 144/18723 | 6.79e-03 | 2.48e-02 | 81 |
| GO:001095119 | Esophagus | ESCC | negative regulation of endopeptidase activity | 135/8552 | 252/18723 | 6.86e-03 | 2.51e-02 | 135 |
| GO:20007574 | Esophagus | ESCC | negative regulation of peptidyl-lysine acetylation | 15/8552 | 20/18723 | 7.60e-03 | 2.71e-02 | 15 |
| GO:00103101 | Esophagus | ESCC | regulation of hydrogen peroxide metabolic process | 16/8552 | 22/18723 | 9.46e-03 | 3.28e-02 | 16 |
| GO:19019844 | Esophagus | ESCC | negative regulation of protein acetylation | 17/8552 | 24/18723 | 1.13e-02 | 3.81e-02 | 17 |
| Page: 1 2 3 4 5 6 7 8 9 10 11 12 13 14 15 16 17 18 19 20 21 22 23 24 |
| Pathway ID | Tissue | Disease Stage | Description | Gene Ratio | Bg Ratio | pvalue | p.adjust | qvalue | Count |
| hsa05022210 | Esophagus | ESCC | Pathways of neurodegeneration - multiple diseases | 318/4205 | 476/8465 | 6.10e-15 | 2.04e-13 | 1.05e-13 | 318 |
| hsa05010210 | Esophagus | ESCC | Alzheimer disease | 263/4205 | 384/8465 | 1.80e-14 | 5.47e-13 | 2.80e-13 | 263 |
| hsa0502238 | Esophagus | ESCC | Pathways of neurodegeneration - multiple diseases | 318/4205 | 476/8465 | 6.10e-15 | 2.04e-13 | 1.05e-13 | 318 |
| hsa0501038 | Esophagus | ESCC | Alzheimer disease | 263/4205 | 384/8465 | 1.80e-14 | 5.47e-13 | 2.80e-13 | 263 |
| hsa0501230 | Oral cavity | OSCC | Parkinson disease | 188/3704 | 266/8465 | 1.82e-19 | 1.52e-17 | 7.75e-18 | 188 |
| hsa0501028 | Oral cavity | OSCC | Alzheimer disease | 244/3704 | 384/8465 | 1.18e-15 | 3.60e-14 | 1.83e-14 | 244 |
| hsa0502228 | Oral cavity | OSCC | Pathways of neurodegeneration - multiple diseases | 292/3704 | 476/8465 | 1.60e-15 | 4.47e-14 | 2.28e-14 | 292 |
| hsa05012113 | Oral cavity | OSCC | Parkinson disease | 188/3704 | 266/8465 | 1.82e-19 | 1.52e-17 | 7.75e-18 | 188 |
| hsa05010112 | Oral cavity | OSCC | Alzheimer disease | 244/3704 | 384/8465 | 1.18e-15 | 3.60e-14 | 1.83e-14 | 244 |
| hsa05022112 | Oral cavity | OSCC | Pathways of neurodegeneration - multiple diseases | 292/3704 | 476/8465 | 1.60e-15 | 4.47e-14 | 2.28e-14 | 292 |
| hsa05012210 | Oral cavity | LP | Parkinson disease | 166/2418 | 266/8465 | 2.02e-31 | 3.36e-29 | 2.17e-29 | 166 |
| hsa0501029 | Oral cavity | LP | Alzheimer disease | 197/2418 | 384/8465 | 6.66e-22 | 3.69e-20 | 2.38e-20 | 197 |
| hsa0502229 | Oral cavity | LP | Pathways of neurodegeneration - multiple diseases | 232/2418 | 476/8465 | 7.77e-22 | 3.69e-20 | 2.38e-20 | 232 |
| hsa0501238 | Oral cavity | LP | Parkinson disease | 166/2418 | 266/8465 | 2.02e-31 | 3.36e-29 | 2.17e-29 | 166 |
| hsa0501037 | Oral cavity | LP | Alzheimer disease | 197/2418 | 384/8465 | 6.66e-22 | 3.69e-20 | 2.38e-20 | 197 |
| hsa0502237 | Oral cavity | LP | Pathways of neurodegeneration - multiple diseases | 232/2418 | 476/8465 | 7.77e-22 | 3.69e-20 | 2.38e-20 | 232 |
| Page: 1 |
Top |
Cell-cell communication analysis |
| Identification of potential cell-cell interactions between two cell types and their ligand-receptor pairs for different disease states |
| Ligand | Receptor | LRpair | Pathway | Tissue | Disease Stage |
| Page: 1 |
Top |
Single-cell gene regulatory network inference analysis |
| Find out the significant the regulons (TFs) and the target genes of each regulon across cell types for different disease states |
| TF | Cell Type | Tissue | Disease Stage | Target Gene | RSS | Regulon Activity |
| ∗The dot plots of a searched regulon are shown for all cell subpopulations in each disease state of each tissue based on the regulon specific score inferred using pySCENIC and by calculating the average expression. |
| Page: 1 |
Top |
Somatic mutation of malignant transformation related genes |
| Annotation of somatic variants for genes involved in malignant transformation |
| Hugo Symbol | Variant Class | Variant Classification | dbSNP RS | HGVSc | HGVSp | HGVSp Short | SWISSPROT | BIOTYPE | SIFT | PolyPhen | Tumor Sample Barcode | Tissue | Histology | Sex | Age | Stage | Therapy Types | Drugs | Outcome |
| SNCA | SNV | Missense_Mutation | c.152N>T | p.Gly51Val | p.G51V | P37840 | protein_coding | deleterious(0) | probably_damaging(1) | TCGA-AA-3947-01 | Colorectum | colon adenocarcinoma | Female | <65 | I/II | Unknown | Unknown | SD | |
| SNCA | SNV | Missense_Mutation | novel | c.249N>T | p.Glu83Asp | p.E83D | P37840 | protein_coding | deleterious(0.03) | probably_damaging(0.927) | TCGA-AA-3949-01 | Colorectum | colon adenocarcinoma | Female | >=65 | III/IV | Unknown | Unknown | SD |
| SNCA | SNV | Missense_Mutation | rs548523899 | c.287N>G | p.Lys96Arg | p.K96R | P37840 | protein_coding | tolerated(0.29) | benign(0.003) | TCGA-CM-4743-01 | Colorectum | colon adenocarcinoma | Male | >=65 | I/II | Chemotherapy | capecitabine | SD |
| SNCA | SNV | Missense_Mutation | novel | c.176N>T | p.Thr59Ile | p.T59I | P37840 | protein_coding | deleterious(0) | probably_damaging(0.995) | TCGA-AP-A1DK-01 | Endometrium | uterine corpus endometrioid carcinoma | Female | <65 | I/II | Unknown | Unknown | SD |
| SNCA | SNV | Missense_Mutation | novel | c.403G>T | p.Asp135Tyr | p.D135Y | P37840 | protein_coding | deleterious_low_confidence(0) | possibly_damaging(0.455) | TCGA-AX-A2HD-01 | Endometrium | uterine corpus endometrioid carcinoma | Female | >=65 | III/IV | Unknown | Unknown | SD |
| SNCA | SNV | Missense_Mutation | c.386N>T | p.Ser129Phe | p.S129F | P37840 | protein_coding | deleterious_low_confidence(0.02) | possibly_damaging(0.586) | TCGA-B5-A0JY-01 | Endometrium | uterine corpus endometrioid carcinoma | Female | <65 | III/IV | Chemotherapy | doxorubicin | SD | |
| SNCA | SNV | Missense_Mutation | c.4N>T | p.Asp2Tyr | p.D2Y | P37840 | protein_coding | deleterious(0) | probably_damaging(0.999) | TCGA-B5-A0JY-01 | Endometrium | uterine corpus endometrioid carcinoma | Female | <65 | III/IV | Chemotherapy | doxorubicin | SD | |
| SNCA | SNV | Missense_Mutation | c.290N>T | p.Lys97Met | p.K97M | P37840 | protein_coding | deleterious(0.04) | probably_damaging(0.927) | TCGA-BS-A0UV-01 | Endometrium | uterine corpus endometrioid carcinoma | Female | <65 | III/IV | Unknown | Unknown | SD | |
| SNCA | SNV | Missense_Mutation | novel | c.409N>A | p.Glu137Lys | p.E137K | P37840 | protein_coding | deleterious_low_confidence(0.01) | benign(0.025) | TCGA-EO-A22R-01 | Endometrium | uterine corpus endometrioid carcinoma | Female | <65 | I/II | Unknown | Unknown | SD |
| SNCA | SNV | Missense_Mutation | c.41N>A | p.Gly14Glu | p.G14E | P37840 | protein_coding | deleterious(0) | probably_damaging(1) | TCGA-DD-A4NF-01 | Liver | liver hepatocellular carcinoma | Male | >=65 | I/II | Unknown | Unknown | PD |
| Page: 1 2 |
Top |
Related drugs of malignant transformation related genes |
| Identification of chemicals and drugs interact with genes involved in malignant transfromation |
| (DGIdb 4.0) |
| Entrez ID | Symbol | Category | Interaction Types | Drug Claim Name | Drug Name | PMIDs |
| 6622 | SNCA | DRUGGABLE GENOME, TRANSPORTER | ALTENUSIN | ALTENUSIN | ||
| 6622 | SNCA | DRUGGABLE GENOME, TRANSPORTER | MYCOPHENOLIC ACID | MYCOPHENOLIC ACID | ||
| 6622 | SNCA | DRUGGABLE GENOME, TRANSPORTER | CALCDPWW | CALCDPWW | 19597508 | |
| 6622 | SNCA | DRUGGABLE GENOME, TRANSPORTER | NPT-200-11 | |||
| 6622 | SNCA | DRUGGABLE GENOME, TRANSPORTER | DNDI1417599 | CHEMBL2094833 | ||
| 6622 | SNCA | DRUGGABLE GENOME, TRANSPORTER | GARDENIN | GARDENIN | ||
| 6622 | SNCA | DRUGGABLE GENOME, TRANSPORTER | DOXORUBICIN HYDROCHLORIDE | DOXORUBICIN HYDROCHLORIDE | ||
| 6622 | SNCA | DRUGGABLE GENOME, TRANSPORTER | NSC-228155 | CHEMBL505670 | ||
| 6622 | SNCA | DRUGGABLE GENOME, TRANSPORTER | DNDI1417076 | CHEMBL1526167 | ||
| 6622 | SNCA | DRUGGABLE GENOME, TRANSPORTER | TCMDC-123769 | CHEMBL534353 |
| Page: 1 2 3 4 |

Copyright 2023-Present -The University of Texas Health Science Center at Houston |