
|
|||||
|
 | |
| |
| |
| |
| |
| |
|
Gene: SMOC2 |
Gene summary for SMOC2 |
| Gene information | Species | Human | Gene symbol | SMOC2 | Gene ID | 64094 |
| Gene name | SPARC related modular calcium binding 2 | |
| Gene Alias | DTDP1 | |
| Cytomap | 6q27 | |
| Gene Type | protein-coding | GO ID | GO:0000278 | UniProtAcc | Q9H3U7 |
Top |
Malignant transformation analysis |
| Identification of the aberrant gene expression in precancerous and cancerous lesions by comparing the gene expression of stem-like cells in diseased tissues with normal stem cells |
| Entrez ID | Symbol | Replicates | Species | Organ | Tissue | Adj P-value | Log2FC | Malignancy |
| 64094 | SMOC2 | HTA11_2487_2000001011 | Human | Colorectum | SER | 2.22e-02 | -5.14e-01 | -0.1808 |
| 64094 | SMOC2 | HTA11_1938_2000001011 | Human | Colorectum | AD | 2.73e-08 | -7.37e-01 | -0.0811 |
| 64094 | SMOC2 | HTA11_78_2000001011 | Human | Colorectum | AD | 7.30e-13 | -7.05e-01 | -0.1088 |
| 64094 | SMOC2 | HTA11_347_2000001011 | Human | Colorectum | AD | 1.44e-10 | -5.77e-01 | -0.1954 |
| 64094 | SMOC2 | HTA11_2112_2000001011 | Human | Colorectum | SER | 2.01e-02 | -1.29e-01 | -0.2196 |
| 64094 | SMOC2 | HTA11_83_2000001011 | Human | Colorectum | SER | 1.19e-06 | -7.33e-01 | -0.1526 |
| 64094 | SMOC2 | HTA11_866_2000001011 | Human | Colorectum | AD | 4.07e-04 | -4.85e-01 | -0.1001 |
| 64094 | SMOC2 | HTA11_1391_2000001011 | Human | Colorectum | AD | 2.18e-08 | -5.14e-01 | -0.059 |
| 64094 | SMOC2 | HTA11_5212_2000001011 | Human | Colorectum | AD | 6.62e-04 | -7.64e-01 | -0.2061 |
| 64094 | SMOC2 | HTA11_866_3004761011 | Human | Colorectum | AD | 1.31e-08 | 8.99e-01 | 0.096 |
| 64094 | SMOC2 | HTA11_4255_2000001011 | Human | Colorectum | SER | 7.97e-04 | 1.34e+00 | 0.0446 |
| 64094 | SMOC2 | HTA11_8622_2000001021 | Human | Colorectum | SER | 1.81e-05 | 1.14e+00 | 0.0528 |
| 64094 | SMOC2 | HTA11_7663_2000001011 | Human | Colorectum | SER | 1.04e-06 | 1.95e+00 | 0.0131 |
| 64094 | SMOC2 | HTA11_7696_3000711011 | Human | Colorectum | AD | 1.39e-17 | -7.15e-01 | 0.0674 |
| 64094 | SMOC2 | HTA11_11156_2000001011 | Human | Colorectum | AD | 1.37e-03 | 1.25e+00 | 0.0397 |
| 64094 | SMOC2 | HTA11_99999970781_79442 | Human | Colorectum | MSS | 2.43e-54 | 1.88e+00 | 0.294 |
| 64094 | SMOC2 | HTA11_99999965062_69753 | Human | Colorectum | MSI-H | 2.44e-12 | 2.53e+00 | 0.3487 |
| 64094 | SMOC2 | HTA11_99999965104_69814 | Human | Colorectum | MSS | 4.67e-02 | 8.59e-01 | 0.281 |
| 64094 | SMOC2 | HTA11_99999971662_82457 | Human | Colorectum | MSS | 2.35e-06 | 8.57e-01 | 0.3859 |
| 64094 | SMOC2 | F007 | Human | Colorectum | FAP | 1.04e-02 | -5.19e-01 | 0.1176 |
| Page: 1 2 3 4 |
| Tissue | Expression Dynamics | Abbreviation |
| Colorectum (GSE201348) |  | FAP: Familial adenomatous polyposis |
| CRC: Colorectal cancer | ||
| Colorectum (HTA11) |  | AD: Adenomas |
| SER: Sessile serrated lesions | ||
| MSI-H: Microsatellite-high colorectal cancer | ||
| MSS: Microsatellite stable colorectal cancer | ||
| Esophagus | 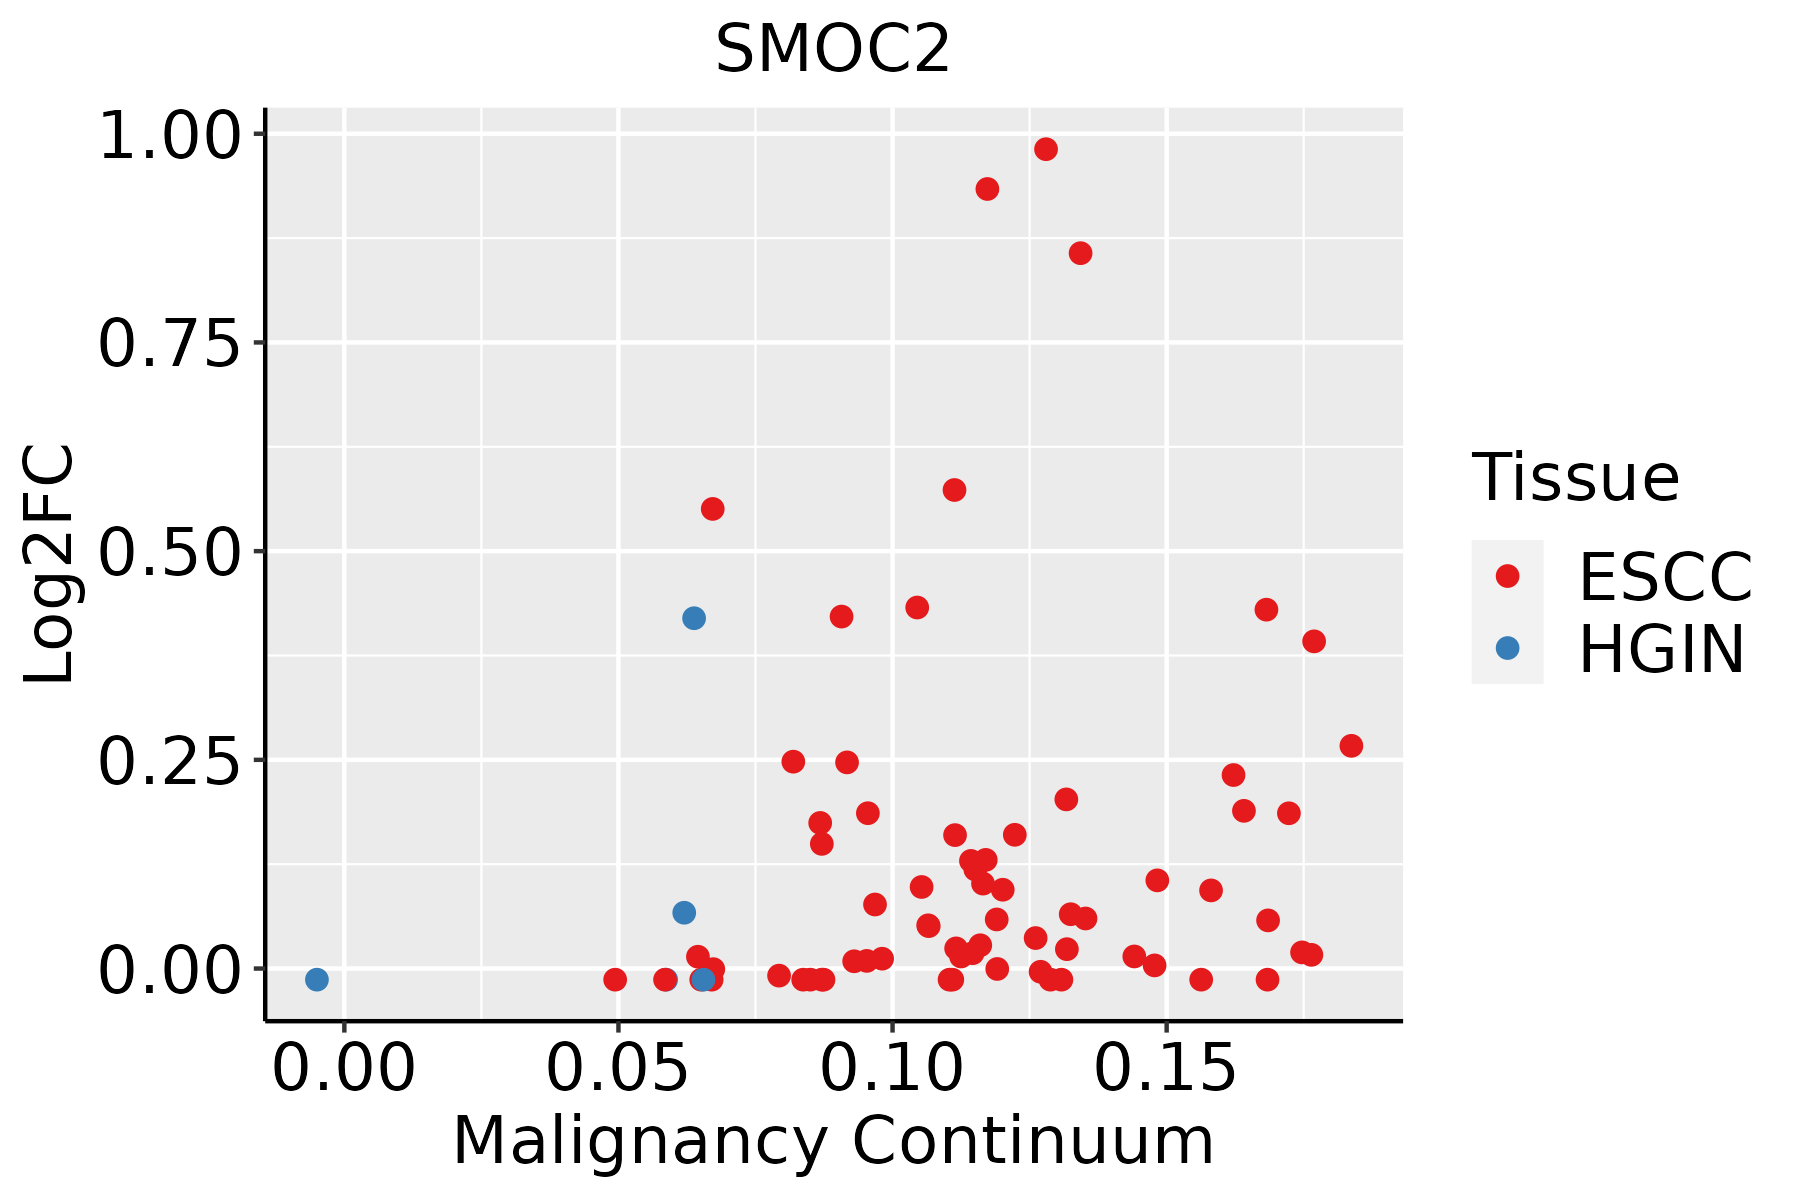 | ESCC: Esophageal squamous cell carcinoma |
| HGIN: High-grade intraepithelial neoplasias | ||
| LGIN: Low-grade intraepithelial neoplasias | ||
| Oral Cavity |  | EOLP: Erosive Oral lichen planus |
| LP: leukoplakia | ||
| NEOLP: Non-erosive oral lichen planus | ||
| OSCC: Oral squamous cell carcinoma | ||
| Thyroid | 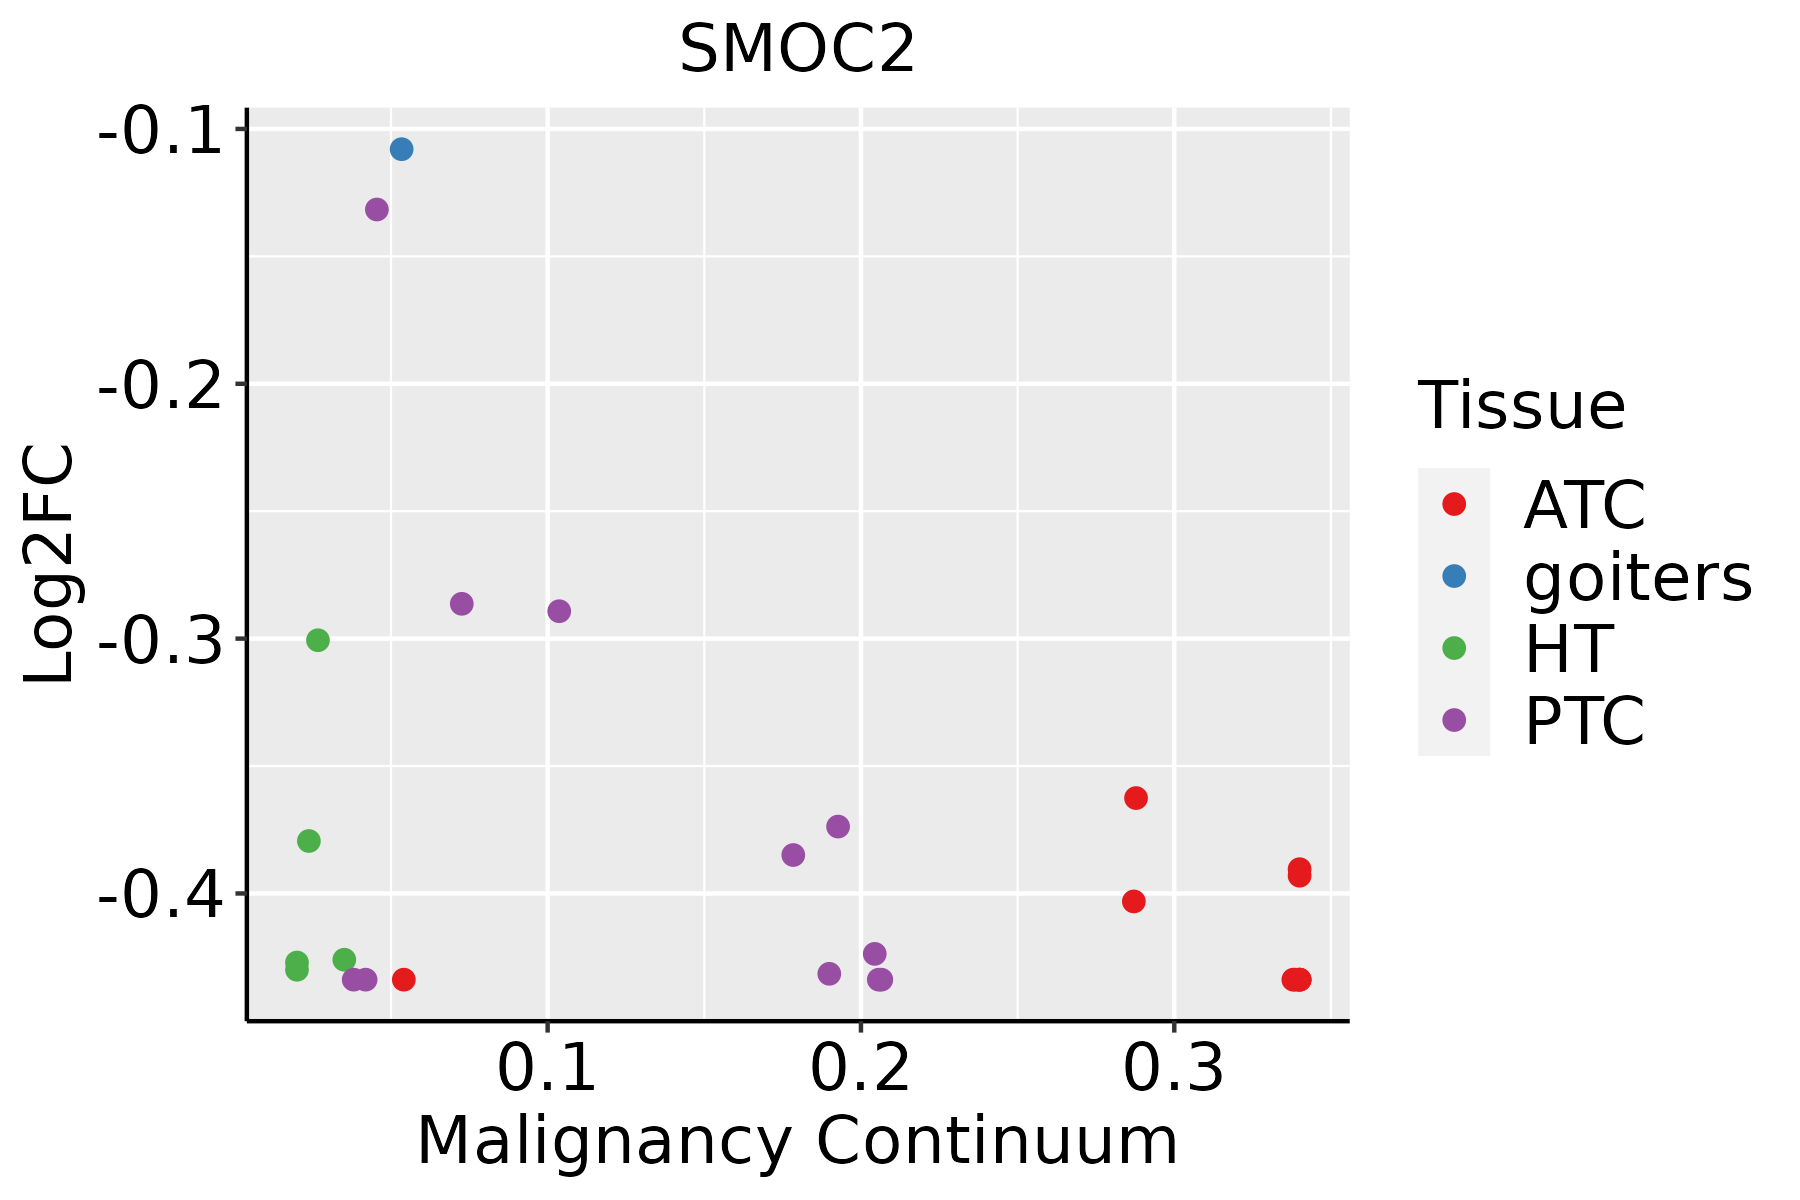 | ATC: Anaplastic thyroid cancer |
| HT: Hashimoto's thyroiditis | ||
| PTC: Papillary thyroid cancer |
| ∗log2FC in expression of this searched gene in stem-like cells from each diseased tissue sample relative to stem-like cells in normal samples in each tissue plotted against the malignancy continuum. Samples are colored based on if they are from different disease stage. |
Top |
Malignant transformation related pathway analysis |
| Find out the enriched GO biological processes and KEGG pathways involved in transition from healthy to precancer to cancer |
| Tissue | Disease Stage | Enriched GO biological Processes |
| Colorectum | AD |  |
| Colorectum | SER |  |
| Colorectum | MSS |  |
| Colorectum | MSI-H |  |
| Colorectum | FAP |  |
| ∗Top 15 enriched GO BP terms are showed in the bar plot of each disease state in each tissue. Each row represents a significant GO biological process which is colored according to the -log10(p.adjust). |
| Page: 1 2 3 4 5 6 7 8 9 |
| GO ID | Tissue | Disease Stage | Description | Gene Ratio | Bg Ratio | pvalue | p.adjust | Count |
| GO:001063119 | Oral cavity | EOLP | epithelial cell migration | 80/2218 | 357/18723 | 1.03e-08 | 4.97e-07 | 80 |
| GO:009013219 | Oral cavity | EOLP | epithelium migration | 80/2218 | 360/18723 | 1.52e-08 | 6.97e-07 | 80 |
| GO:009013019 | Oral cavity | EOLP | tissue migration | 80/2218 | 365/18723 | 2.89e-08 | 1.16e-06 | 80 |
| GO:005105222 | Oral cavity | EOLP | regulation of DNA metabolic process | 75/2218 | 359/18723 | 5.81e-07 | 1.53e-05 | 75 |
| GO:003210314 | Oral cavity | EOLP | positive regulation of response to external stimulus | 84/2218 | 427/18723 | 1.72e-06 | 3.99e-05 | 84 |
| GO:001063219 | Oral cavity | EOLP | regulation of epithelial cell migration | 62/2218 | 292/18723 | 3.09e-06 | 6.74e-05 | 62 |
| GO:004354210 | Oral cavity | EOLP | endothelial cell migration | 59/2218 | 279/18723 | 6.05e-06 | 1.19e-04 | 59 |
| GO:001063419 | Oral cavity | EOLP | positive regulation of epithelial cell migration | 41/2218 | 176/18723 | 1.45e-05 | 2.42e-04 | 41 |
| GO:005105421 | Oral cavity | EOLP | positive regulation of DNA metabolic process | 45/2218 | 201/18723 | 1.68e-05 | 2.77e-04 | 45 |
| GO:190303419 | Oral cavity | EOLP | regulation of response to wounding | 38/2218 | 167/18723 | 5.06e-05 | 6.58e-04 | 38 |
| GO:004593121 | Oral cavity | EOLP | positive regulation of mitotic cell cycle | 30/2218 | 121/18723 | 5.78e-05 | 7.31e-04 | 30 |
| GO:006104117 | Oral cavity | EOLP | regulation of wound healing | 32/2218 | 134/18723 | 7.29e-05 | 8.89e-04 | 32 |
| GO:000734621 | Oral cavity | EOLP | regulation of mitotic cell cycle | 82/2218 | 457/18723 | 7.50e-05 | 9.14e-04 | 82 |
| GO:006032614 | Oral cavity | EOLP | cell chemotaxis | 60/2218 | 310/18723 | 8.04e-05 | 9.66e-04 | 60 |
| GO:200027823 | Oral cavity | EOLP | regulation of DNA biosynthetic process | 27/2218 | 106/18723 | 8.11e-05 | 9.69e-04 | 27 |
| GO:00105957 | Oral cavity | EOLP | positive regulation of endothelial cell migration | 31/2218 | 133/18723 | 1.51e-04 | 1.62e-03 | 31 |
| GO:00105947 | Oral cavity | EOLP | regulation of endothelial cell migration | 47/2218 | 232/18723 | 1.52e-04 | 1.62e-03 | 47 |
| GO:00902872 | Oral cavity | EOLP | regulation of cellular response to growth factor stimulus | 57/2218 | 304/18723 | 2.84e-04 | 2.70e-03 | 57 |
| GO:009030314 | Oral cavity | EOLP | positive regulation of wound healing | 17/2218 | 59/18723 | 3.48e-04 | 3.20e-03 | 17 |
| GO:190303616 | Oral cavity | EOLP | positive regulation of response to wounding | 19/2218 | 72/18723 | 5.48e-04 | 4.68e-03 | 19 |
| Page: 1 2 3 4 5 6 7 8 9 10 11 12 13 14 15 |
| Pathway ID | Tissue | Disease Stage | Description | Gene Ratio | Bg Ratio | pvalue | p.adjust | qvalue | Count |
| Page: 1 |
Top |
Cell-cell communication analysis |
| Identification of potential cell-cell interactions between two cell types and their ligand-receptor pairs for different disease states |
| Ligand | Receptor | LRpair | Pathway | Tissue | Disease Stage |
| Page: 1 |
Top |
Single-cell gene regulatory network inference analysis |
| Find out the significant the regulons (TFs) and the target genes of each regulon across cell types for different disease states |
| TF | Cell Type | Tissue | Disease Stage | Target Gene | RSS | Regulon Activity |
| ∗The dot plots of a searched regulon are shown for all cell subpopulations in each disease state of each tissue based on the regulon specific score inferred using pySCENIC and by calculating the average expression. |
| Page: 1 |
Top |
Somatic mutation of malignant transformation related genes |
| Annotation of somatic variants for genes involved in malignant transformation |
| Hugo Symbol | Variant Class | Variant Classification | dbSNP RS | HGVSc | HGVSp | HGVSp Short | SWISSPROT | BIOTYPE | SIFT | PolyPhen | Tumor Sample Barcode | Tissue | Histology | Sex | Age | Stage | Therapy Types | Drugs | Outcome |
| SMOC2 | SNV | Missense_Mutation | novel | c.454N>T | p.Arg152Trp | p.R152W | Q9H3U7 | protein_coding | deleterious(0.02) | possibly_damaging(0.541) | TCGA-A7-A3IY-01 | Breast | breast invasive carcinoma | Female | >=65 | I/II | Hormone Therapy | anastrozole | SD |
| SMOC2 | SNV | Missense_Mutation | c.199C>A | p.Gln67Lys | p.Q67K | Q9H3U7 | protein_coding | deleterious(0.01) | benign(0.155) | TCGA-AN-A0AT-01 | Breast | breast invasive carcinoma | Female | <65 | I/II | Unknown | Unknown | SD | |
| SMOC2 | SNV | Missense_Mutation | c.1101N>A | p.Phe367Leu | p.F367L | Q9H3U7 | protein_coding | deleterious(0) | probably_damaging(0.994) | TCGA-B6-A0X5-01 | Breast | breast invasive carcinoma | Female | <65 | I/II | Unknown | Unknown | PD | |
| SMOC2 | SNV | Missense_Mutation | c.1072C>G | p.Leu358Val | p.L358V | Q9H3U7 | protein_coding | deleterious(0) | probably_damaging(0.998) | TCGA-D8-A1JL-01 | Breast | breast invasive carcinoma | Female | >=65 | I/II | Unknown | Unknown | SD | |
| SMOC2 | SNV | Missense_Mutation | novel | c.545N>T | p.Asp182Val | p.D182V | Q9H3U7 | protein_coding | deleterious(0) | probably_damaging(0.914) | TCGA-EA-A3HU-01 | Cervix | cervical & endocervical cancer | Female | <65 | I/II | Unknown | Unknown | SD |
| SMOC2 | SNV | Missense_Mutation | c.982N>G | p.Leu328Val | p.L328V | Q9H3U7 | protein_coding | tolerated(0.12) | probably_damaging(0.993) | TCGA-EK-A2RJ-01 | Cervix | cervical & endocervical cancer | Female | <65 | I/II | Unknown | Unknown | SD | |
| SMOC2 | SNV | Missense_Mutation | rs201624579 | c.1291N>A | p.Gly431Ser | p.G431S | Q9H3U7 | protein_coding | tolerated(0.2) | benign(0.251) | TCGA-AA-3672-01 | Colorectum | colon adenocarcinoma | Female | >=65 | III/IV | Unknown | Unknown | SD |
| SMOC2 | SNV | Missense_Mutation | rs776824810 | c.832C>T | p.Arg278Cys | p.R278C | Q9H3U7 | protein_coding | deleterious(0) | probably_damaging(0.998) | TCGA-AA-A01R-01 | Colorectum | colon adenocarcinoma | Male | <65 | III/IV | Chemotherapy | 5-fluorouracil | PD |
| SMOC2 | SNV | Missense_Mutation | c.757N>T | p.His253Tyr | p.H253Y | Q9H3U7 | protein_coding | tolerated(0.37) | benign(0.116) | TCGA-G4-6588-01 | Colorectum | colon adenocarcinoma | Female | <65 | I/II | Unknown | Unknown | SD | |
| SMOC2 | SNV | Missense_Mutation | rs561879643 | c.763N>A | p.Gly255Ser | p.G255S | Q9H3U7 | protein_coding | tolerated(0.06) | probably_damaging(1) | TCGA-AG-A020-01 | Colorectum | rectum adenocarcinoma | Female | <65 | III/IV | Chemotherapy | folinic | CR |
| Page: 1 2 3 4 5 6 |
Top |
Related drugs of malignant transformation related genes |
| Identification of chemicals and drugs interact with genes involved in malignant transfromation |
| (DGIdb 4.0) |
| Entrez ID | Symbol | Category | Interaction Types | Drug Claim Name | Drug Name | PMIDs |
| Page: 1 |

Copyright 2023-Present -The University of Texas Health Science Center at Houston |