
|
|||||
|
 | |
| |
| |
| |
| |
| |
|
Gene: SESN2 |
Gene summary for SESN2 |
| Gene information | Species | Human | Gene symbol | SESN2 | Gene ID | 83667 |
| Gene name | sestrin 2 | |
| Gene Alias | HI95 | |
| Cytomap | 1p35.3 | |
| Gene Type | protein-coding | GO ID | GO:0000002 | UniProtAcc | P58004 |
Top |
Malignant transformation analysis |
| Identification of the aberrant gene expression in precancerous and cancerous lesions by comparing the gene expression of stem-like cells in diseased tissues with normal stem cells |
| Entrez ID | Symbol | Replicates | Species | Organ | Tissue | Adj P-value | Log2FC | Malignancy |
| 83667 | SESN2 | HTA11_2487_2000001011 | Human | Colorectum | SER | 7.97e-04 | 2.66e-01 | -0.1808 |
| 83667 | SESN2 | HTA11_78_2000001011 | Human | Colorectum | AD | 1.70e-02 | 2.75e-01 | -0.1088 |
| 83667 | SESN2 | HTA11_347_2000001011 | Human | Colorectum | AD | 1.97e-17 | 5.02e-01 | -0.1954 |
| 83667 | SESN2 | HTA11_83_2000001011 | Human | Colorectum | SER | 2.65e-06 | 4.06e-01 | -0.1526 |
| 83667 | SESN2 | HTA11_696_2000001011 | Human | Colorectum | AD | 2.52e-09 | 4.27e-01 | -0.1464 |
| 83667 | SESN2 | HTA11_1391_2000001011 | Human | Colorectum | AD | 2.46e-05 | 3.47e-01 | -0.059 |
| 83667 | SESN2 | HTA11_546_2000001011 | Human | Colorectum | AD | 4.79e-02 | 3.18e-01 | -0.0842 |
| 83667 | SESN2 | A002-C-016 | Human | Colorectum | FAP | 2.93e-02 | -5.77e-02 | 0.0521 |
| 83667 | SESN2 | A002-C-116 | Human | Colorectum | FAP | 2.91e-02 | -1.08e-01 | -0.0452 |
| 83667 | SESN2 | LZE7T | Human | Esophagus | ESCC | 4.15e-02 | 2.88e-01 | 0.0667 |
| 83667 | SESN2 | LZE24T | Human | Esophagus | ESCC | 3.92e-08 | 4.09e-01 | 0.0596 |
| 83667 | SESN2 | P1T-E | Human | Esophagus | ESCC | 4.37e-09 | 4.34e-01 | 0.0875 |
| 83667 | SESN2 | P2T-E | Human | Esophagus | ESCC | 7.15e-27 | 6.40e-01 | 0.1177 |
| 83667 | SESN2 | P4T-E | Human | Esophagus | ESCC | 2.17e-11 | 4.19e-01 | 0.1323 |
| 83667 | SESN2 | P5T-E | Human | Esophagus | ESCC | 1.97e-07 | 2.64e-01 | 0.1327 |
| 83667 | SESN2 | P8T-E | Human | Esophagus | ESCC | 3.40e-02 | 1.26e-01 | 0.0889 |
| 83667 | SESN2 | P10T-E | Human | Esophagus | ESCC | 1.76e-08 | 2.76e-01 | 0.116 |
| 83667 | SESN2 | P11T-E | Human | Esophagus | ESCC | 2.58e-08 | 3.60e-01 | 0.1426 |
| 83667 | SESN2 | P12T-E | Human | Esophagus | ESCC | 5.53e-13 | 3.28e-01 | 0.1122 |
| 83667 | SESN2 | P15T-E | Human | Esophagus | ESCC | 7.20e-08 | 2.23e-01 | 0.1149 |
| Page: 1 2 3 4 |
| Tissue | Expression Dynamics | Abbreviation |
| Colorectum (GSE201348) |  | FAP: Familial adenomatous polyposis |
| CRC: Colorectal cancer | ||
| Colorectum (HTA11) |  | AD: Adenomas |
| SER: Sessile serrated lesions | ||
| MSI-H: Microsatellite-high colorectal cancer | ||
| MSS: Microsatellite stable colorectal cancer | ||
| Esophagus | 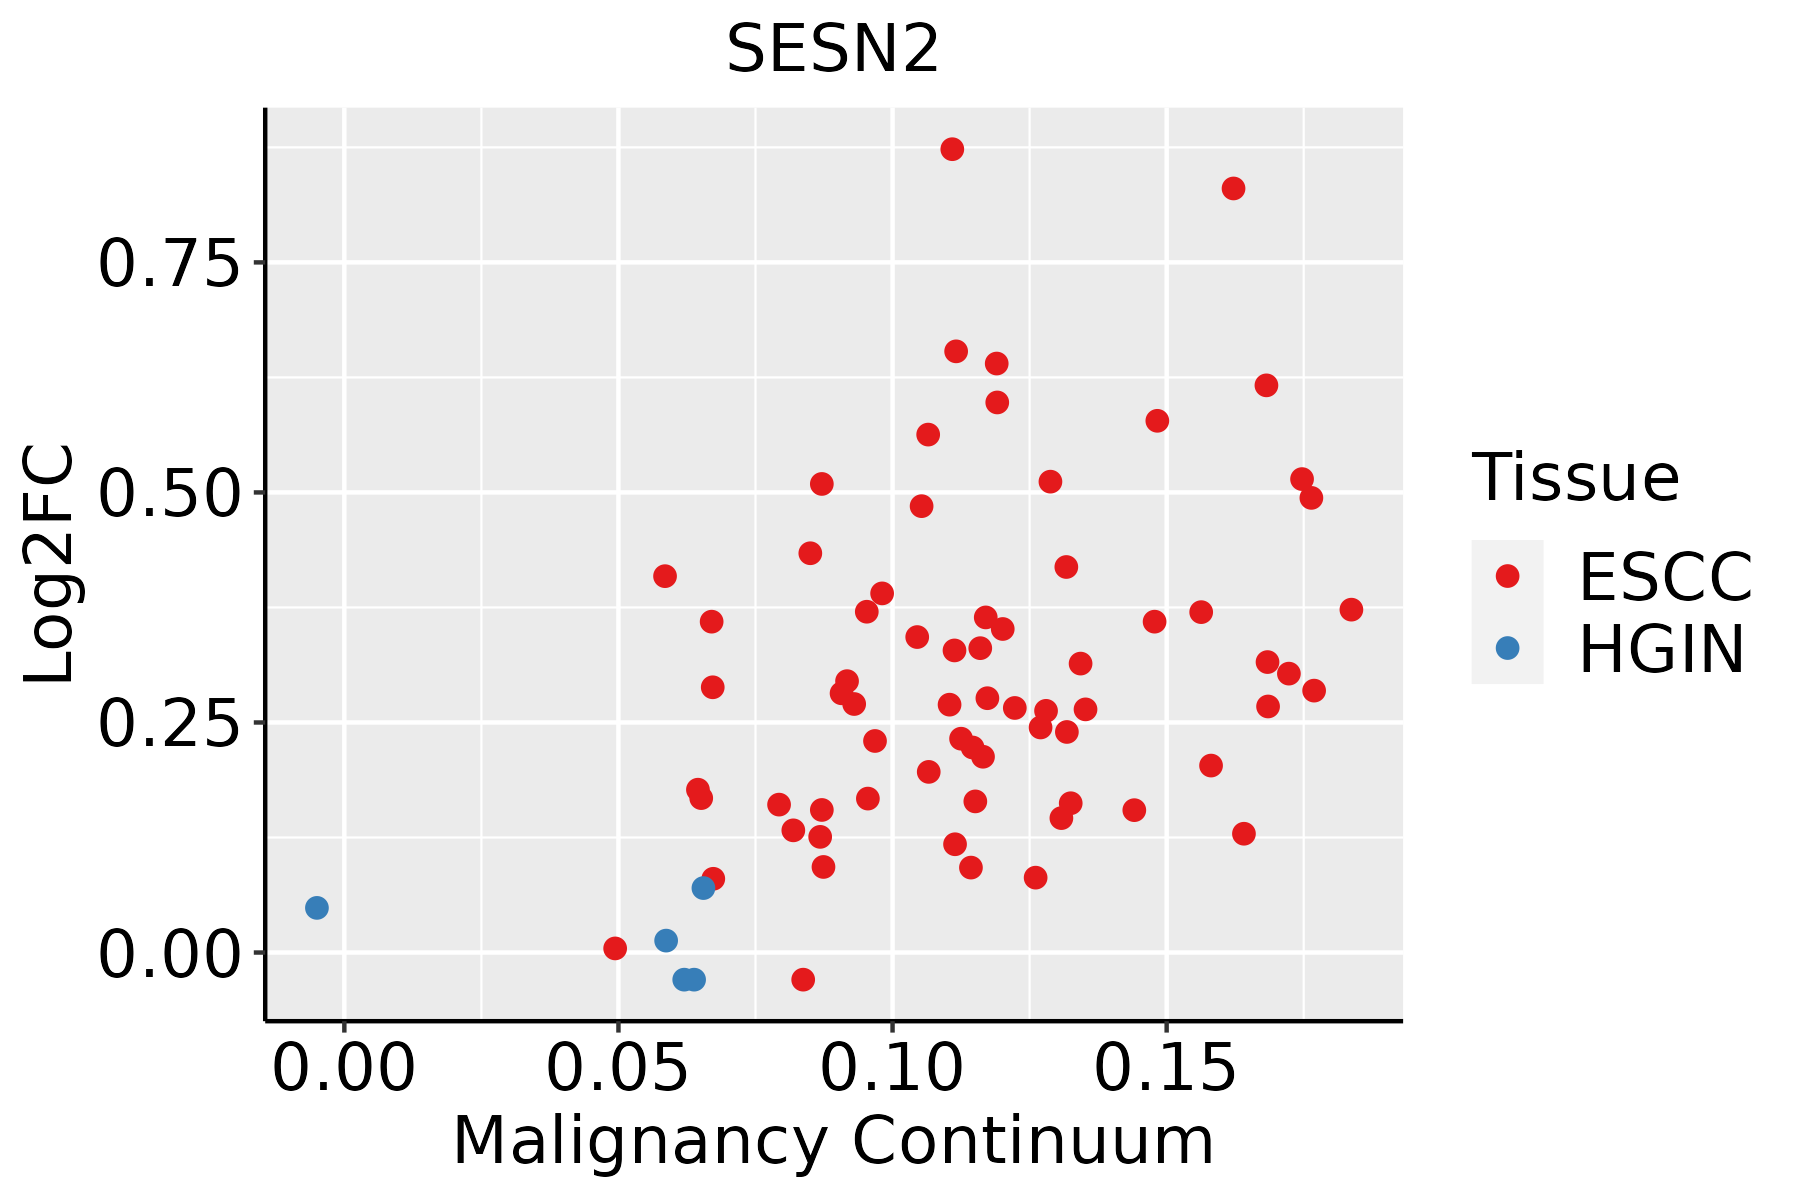 | ESCC: Esophageal squamous cell carcinoma |
| HGIN: High-grade intraepithelial neoplasias | ||
| LGIN: Low-grade intraepithelial neoplasias | ||
| Liver | 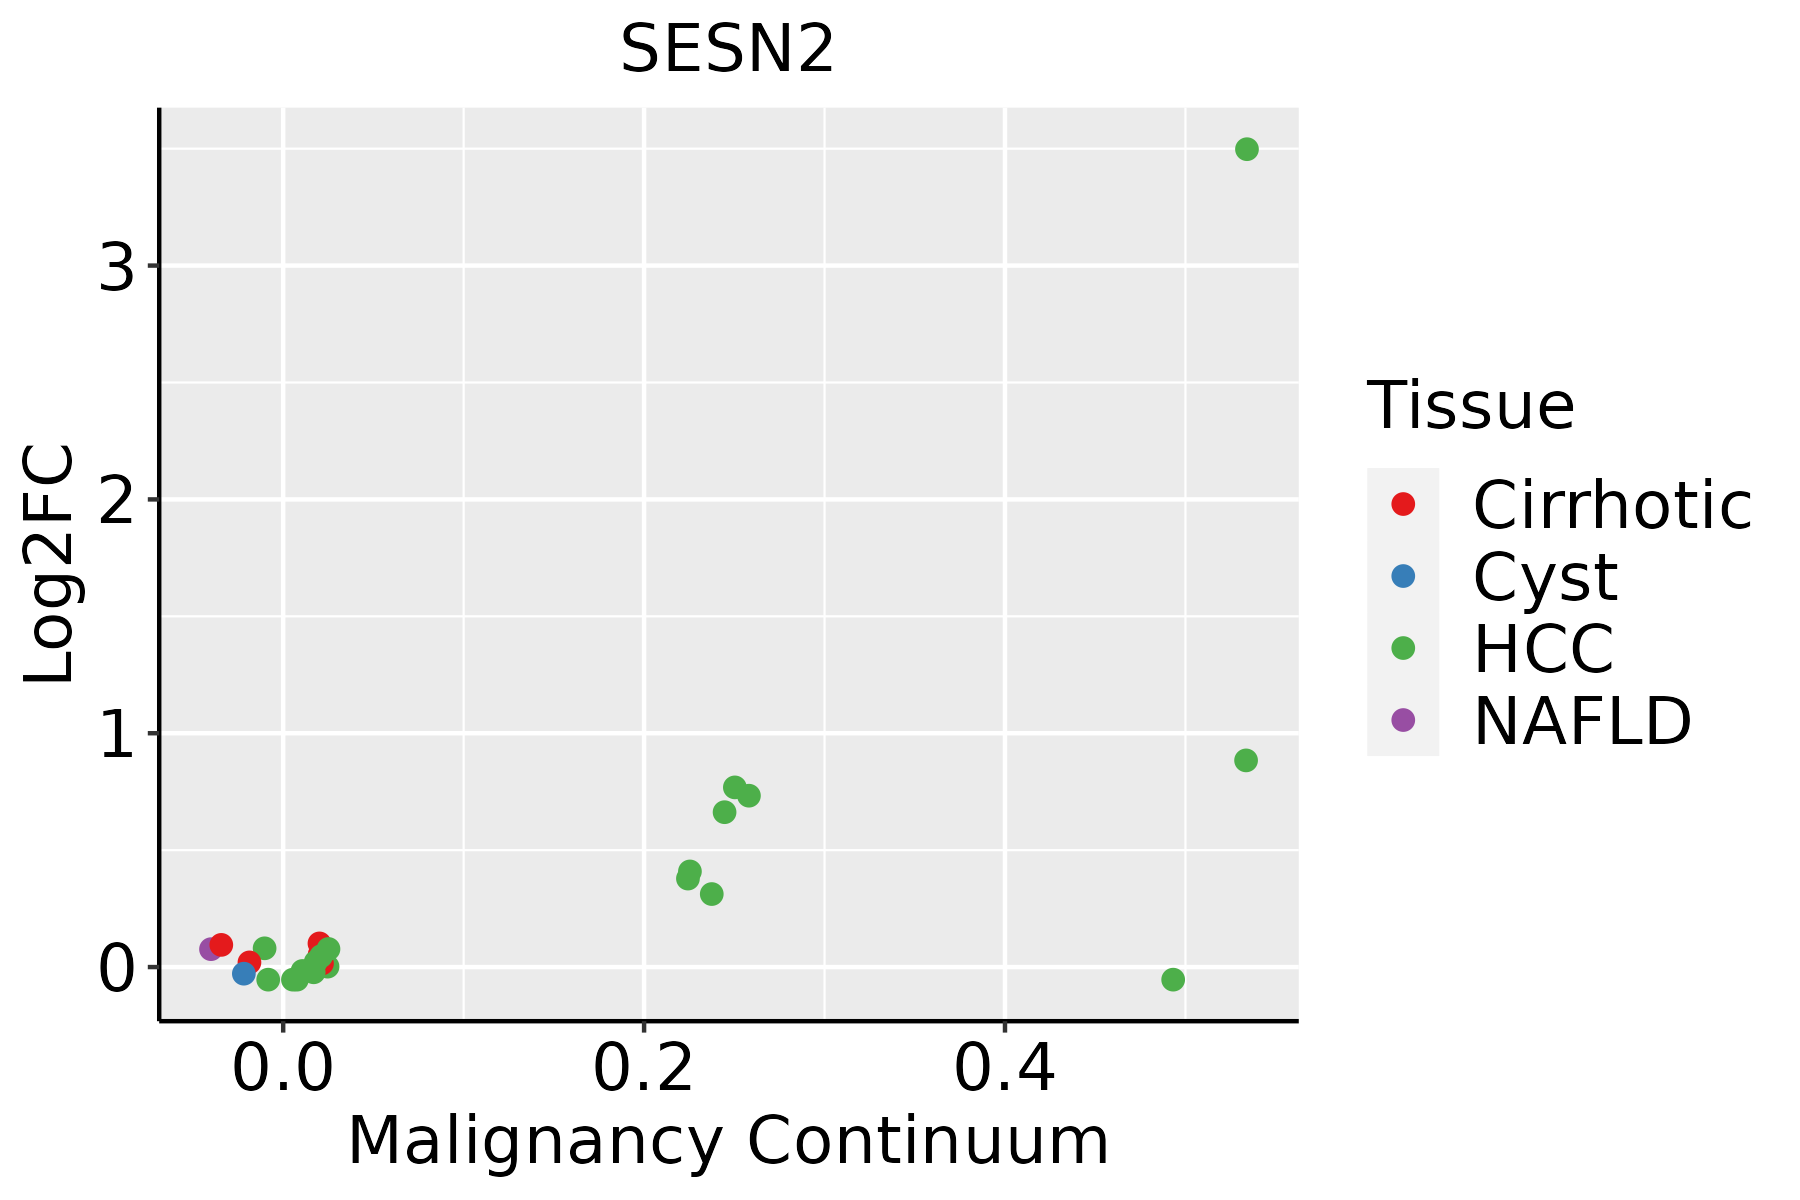 | HCC: Hepatocellular carcinoma |
| NAFLD: Non-alcoholic fatty liver disease | ||
| Prostate | 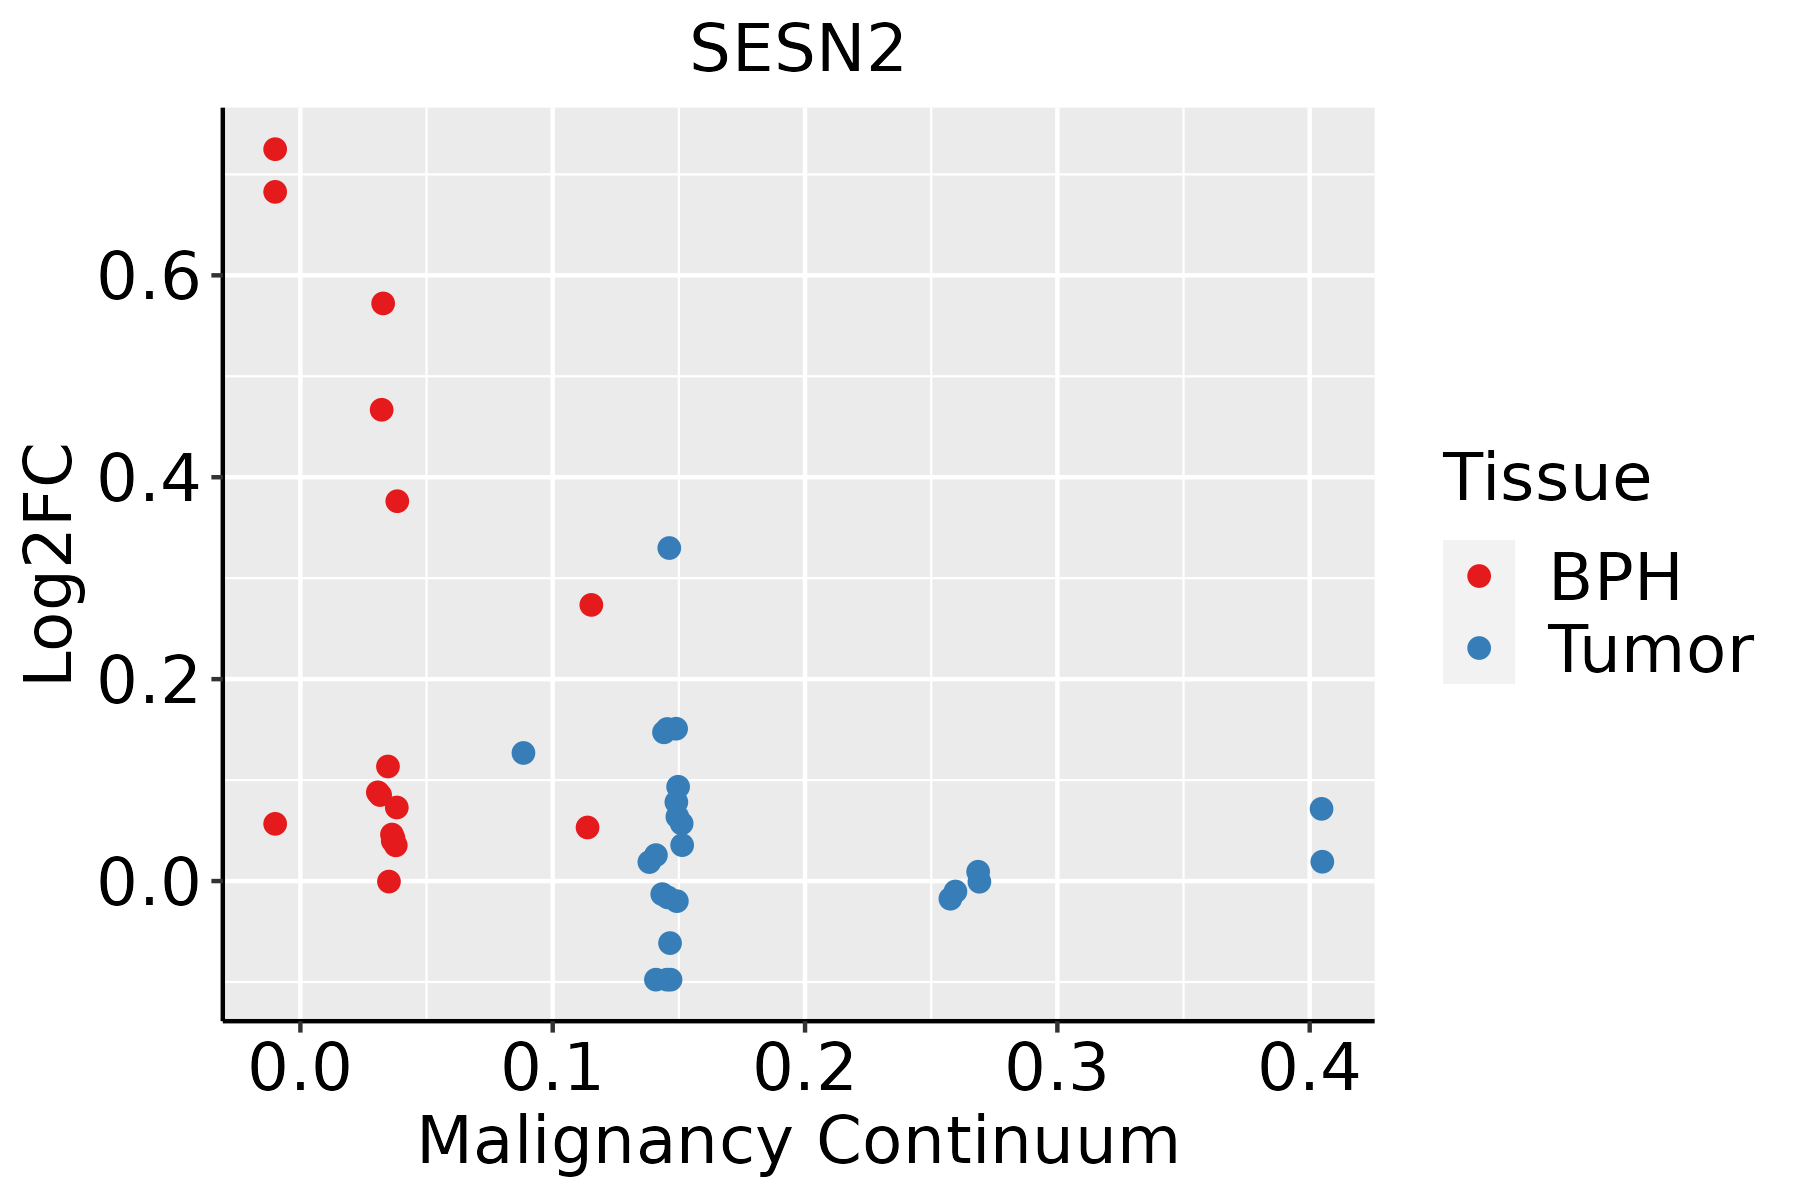 | BPH: Benign Prostatic Hyperplasia |
| ∗log2FC in expression of this searched gene in stem-like cells from each diseased tissue sample relative to stem-like cells in normal samples in each tissue plotted against the malignancy continuum. Samples are colored based on if they are from different disease stage. |
Top |
Malignant transformation related pathway analysis |
| Find out the enriched GO biological processes and KEGG pathways involved in transition from healthy to precancer to cancer |
| Tissue | Disease Stage | Enriched GO biological Processes |
| Colorectum | AD |  |
| Colorectum | SER |  |
| Colorectum | MSS |  |
| Colorectum | MSI-H |  |
| Colorectum | FAP |  |
| ∗Top 15 enriched GO BP terms are showed in the bar plot of each disease state in each tissue. Each row represents a significant GO biological process which is colored according to the -log10(p.adjust). |
| Page: 1 2 3 4 5 6 7 8 9 |
| GO ID | Tissue | Disease Stage | Description | Gene Ratio | Bg Ratio | pvalue | p.adjust | Count |
| GO:00193183 | Colorectum | FAP | hexose metabolic process | 58/2622 | 237/18723 | 1.09e-05 | 3.08e-04 | 58 |
| GO:00003024 | Colorectum | FAP | response to reactive oxygen species | 55/2622 | 222/18723 | 1.25e-05 | 3.42e-04 | 55 |
| GO:00442621 | Colorectum | FAP | cellular carbohydrate metabolic process | 66/2622 | 283/18723 | 1.53e-05 | 4.01e-04 | 66 |
| GO:00349764 | Colorectum | FAP | response to endoplasmic reticulum stress | 61/2622 | 256/18723 | 1.58e-05 | 4.10e-04 | 61 |
| GO:00061092 | Colorectum | FAP | regulation of carbohydrate metabolic process | 46/2622 | 178/18723 | 1.99e-05 | 4.90e-04 | 46 |
| GO:00302583 | Colorectum | FAP | lipid modification | 52/2622 | 212/18723 | 2.84e-05 | 6.49e-04 | 52 |
| GO:00620122 | Colorectum | FAP | regulation of small molecule metabolic process | 74/2622 | 334/18723 | 3.15e-05 | 7.13e-04 | 74 |
| GO:00345044 | Colorectum | FAP | protein localization to nucleus | 66/2622 | 290/18723 | 3.47e-05 | 7.64e-04 | 66 |
| GO:00162413 | Colorectum | FAP | regulation of macroautophagy | 38/2622 | 141/18723 | 3.78e-05 | 8.13e-04 | 38 |
| GO:00342844 | Colorectum | FAP | response to monosaccharide | 54/2622 | 225/18723 | 3.84e-05 | 8.22e-04 | 54 |
| GO:00719003 | Colorectum | FAP | regulation of protein serine/threonine kinase activity | 78/2622 | 359/18723 | 3.99e-05 | 8.48e-04 | 78 |
| GO:00066353 | Colorectum | FAP | fatty acid beta-oxidation | 24/2622 | 74/18723 | 4.23e-05 | 8.91e-04 | 24 |
| GO:00335003 | Colorectum | FAP | carbohydrate homeostasis | 60/2622 | 259/18723 | 4.49e-05 | 9.35e-04 | 60 |
| GO:00193953 | Colorectum | FAP | fatty acid oxidation | 30/2622 | 103/18723 | 5.09e-05 | 1.03e-03 | 30 |
| GO:00097494 | Colorectum | FAP | response to glucose | 51/2622 | 212/18723 | 5.82e-05 | 1.15e-03 | 51 |
| GO:00060063 | Colorectum | FAP | glucose metabolic process | 48/2622 | 196/18723 | 5.90e-05 | 1.16e-03 | 48 |
| GO:00059963 | Colorectum | FAP | monosaccharide metabolic process | 59/2622 | 257/18723 | 6.79e-05 | 1.28e-03 | 59 |
| GO:00097464 | Colorectum | FAP | response to hexose | 52/2622 | 219/18723 | 7.13e-05 | 1.32e-03 | 52 |
| GO:00425933 | Colorectum | FAP | glucose homeostasis | 59/2622 | 258/18723 | 7.62e-05 | 1.37e-03 | 59 |
| GO:19001804 | Colorectum | FAP | regulation of protein localization to nucleus | 36/2622 | 136/18723 | 8.95e-05 | 1.58e-03 | 36 |
| Page: 1 2 3 4 5 6 7 8 9 10 11 12 13 14 15 16 17 18 19 20 21 22 |
| Pathway ID | Tissue | Disease Stage | Description | Gene Ratio | Bg Ratio | pvalue | p.adjust | qvalue | Count |
| hsa04211 | Colorectum | AD | Longevity regulating pathway | 33/2092 | 89/8465 | 6.15e-03 | 2.68e-02 | 1.71e-02 | 33 |
| hsa042111 | Colorectum | AD | Longevity regulating pathway | 33/2092 | 89/8465 | 6.15e-03 | 2.68e-02 | 1.71e-02 | 33 |
| hsa042114 | Colorectum | FAP | Longevity regulating pathway | 27/1404 | 89/8465 | 8.82e-04 | 5.20e-03 | 3.16e-03 | 27 |
| hsa042115 | Colorectum | FAP | Longevity regulating pathway | 27/1404 | 89/8465 | 8.82e-04 | 5.20e-03 | 3.16e-03 | 27 |
| hsa0411524 | Esophagus | ESCC | p53 signaling pathway | 65/4205 | 74/8465 | 3.88e-12 | 6.50e-11 | 3.33e-11 | 65 |
| hsa041505 | Esophagus | ESCC | mTOR signaling pathway | 98/4205 | 156/8465 | 5.81e-04 | 1.95e-03 | 9.97e-04 | 98 |
| hsa0421114 | Esophagus | ESCC | Longevity regulating pathway | 58/4205 | 89/8465 | 2.19e-03 | 6.16e-03 | 3.16e-03 | 58 |
| hsa0411534 | Esophagus | ESCC | p53 signaling pathway | 65/4205 | 74/8465 | 3.88e-12 | 6.50e-11 | 3.33e-11 | 65 |
| hsa0415013 | Esophagus | ESCC | mTOR signaling pathway | 98/4205 | 156/8465 | 5.81e-04 | 1.95e-03 | 9.97e-04 | 98 |
| hsa0421115 | Esophagus | ESCC | Longevity regulating pathway | 58/4205 | 89/8465 | 2.19e-03 | 6.16e-03 | 3.16e-03 | 58 |
| hsa0421121 | Liver | HCC | Longevity regulating pathway | 61/4020 | 89/8465 | 4.46e-05 | 2.37e-04 | 1.32e-04 | 61 |
| hsa041502 | Liver | HCC | mTOR signaling pathway | 95/4020 | 156/8465 | 4.70e-04 | 1.99e-03 | 1.11e-03 | 95 |
| hsa041156 | Liver | HCC | p53 signaling pathway | 46/4020 | 74/8465 | 7.64e-03 | 2.08e-02 | 1.16e-02 | 46 |
| hsa0421131 | Liver | HCC | Longevity regulating pathway | 61/4020 | 89/8465 | 4.46e-05 | 2.37e-04 | 1.32e-04 | 61 |
| hsa0415011 | Liver | HCC | mTOR signaling pathway | 95/4020 | 156/8465 | 4.70e-04 | 1.99e-03 | 1.11e-03 | 95 |
| hsa0411511 | Liver | HCC | p53 signaling pathway | 46/4020 | 74/8465 | 7.64e-03 | 2.08e-02 | 1.16e-02 | 46 |
| hsa041158 | Prostate | BPH | p53 signaling pathway | 30/1718 | 74/8465 | 5.15e-05 | 3.40e-04 | 2.10e-04 | 30 |
| hsa042119 | Prostate | BPH | Longevity regulating pathway | 27/1718 | 89/8465 | 1.57e-02 | 4.42e-02 | 2.73e-02 | 27 |
| hsa0411513 | Prostate | BPH | p53 signaling pathway | 30/1718 | 74/8465 | 5.15e-05 | 3.40e-04 | 2.10e-04 | 30 |
| hsa0421112 | Prostate | BPH | Longevity regulating pathway | 27/1718 | 89/8465 | 1.57e-02 | 4.42e-02 | 2.73e-02 | 27 |
| Page: 1 |
Top |
Cell-cell communication analysis |
| Identification of potential cell-cell interactions between two cell types and their ligand-receptor pairs for different disease states |
| Ligand | Receptor | LRpair | Pathway | Tissue | Disease Stage |
| Page: 1 |
Top |
Single-cell gene regulatory network inference analysis |
| Find out the significant the regulons (TFs) and the target genes of each regulon across cell types for different disease states |
| TF | Cell Type | Tissue | Disease Stage | Target Gene | RSS | Regulon Activity |
| ∗The dot plots of a searched regulon are shown for all cell subpopulations in each disease state of each tissue based on the regulon specific score inferred using pySCENIC and by calculating the average expression. |
| Page: 1 |
Top |
Somatic mutation of malignant transformation related genes |
| Annotation of somatic variants for genes involved in malignant transformation |
| Hugo Symbol | Variant Class | Variant Classification | dbSNP RS | HGVSc | HGVSp | HGVSp Short | SWISSPROT | BIOTYPE | SIFT | PolyPhen | Tumor Sample Barcode | Tissue | Histology | Sex | Age | Stage | Therapy Types | Drugs | Outcome |
| SESN2 | SNV | Missense_Mutation | c.1056C>G | p.Ile352Met | p.I352M | P58004 | protein_coding | tolerated(0.1) | possibly_damaging(0.814) | TCGA-A8-A09G-01 | Breast | breast invasive carcinoma | Female | >=65 | III/IV | Unknown | Unknown | SD | |
| SESN2 | SNV | Missense_Mutation | c.577N>A | p.Glu193Lys | p.E193K | P58004 | protein_coding | deleterious(0) | probably_damaging(0.995) | TCGA-DS-A0VM-01 | Cervix | cervical & endocervical cancer | Female | <65 | I/II | Chemotherapy | cisplatin | PD | |
| SESN2 | SNV | Missense_Mutation | novel | c.791G>T | p.Arg264Leu | p.R264L | P58004 | protein_coding | deleterious(0.02) | possibly_damaging(0.855) | TCGA-EK-A2IP-01 | Cervix | cervical & endocervical cancer | Female | <65 | I/II | Unknown | Unknown | SD |
| SESN2 | SNV | Missense_Mutation | c.116N>A | p.Arg39Gln | p.R39Q | P58004 | protein_coding | tolerated_low_confidence(0.21) | benign(0) | TCGA-EK-A3GM-01 | Cervix | cervical & endocervical cancer | Female | >=65 | I/II | Unknown | Unknown | SD | |
| SESN2 | SNV | Missense_Mutation | c.683C>A | p.Pro228His | p.P228H | P58004 | protein_coding | tolerated(0.54) | benign(0.186) | TCGA-A6-5665-01 | Colorectum | colon adenocarcinoma | Female | >=65 | I/II | Unknown | Unknown | PD | |
| SESN2 | SNV | Missense_Mutation | c.277N>C | p.Phe93Leu | p.F93L | P58004 | protein_coding | deleterious(0.01) | benign(0.23) | TCGA-AA-3672-01 | Colorectum | colon adenocarcinoma | Female | >=65 | III/IV | Unknown | Unknown | SD | |
| SESN2 | SNV | Missense_Mutation | c.1387C>T | p.Arg463Cys | p.R463C | P58004 | protein_coding | deleterious(0) | probably_damaging(0.998) | TCGA-AA-A022-01 | Colorectum | colon adenocarcinoma | Female | >=65 | I/II | Unknown | Unknown | SD | |
| SESN2 | SNV | Missense_Mutation | c.940N>A | p.Cys314Ser | p.C314S | P58004 | protein_coding | tolerated(0.41) | benign(0.265) | TCGA-AD-6895-01 | Colorectum | colon adenocarcinoma | Male | >=65 | III/IV | Unknown | Unknown | SD | |
| SESN2 | SNV | Missense_Mutation | rs769442139 | c.308C>T | p.Thr103Met | p.T103M | P58004 | protein_coding | tolerated(0.84) | benign(0.011) | TCGA-AZ-4315-01 | Colorectum | colon adenocarcinoma | Male | <65 | I/II | Unknown | Unknown | SD |
| SESN2 | SNV | Missense_Mutation | c.904N>A | p.Asp302Asn | p.D302N | P58004 | protein_coding | tolerated(0.06) | possibly_damaging(0.892) | TCGA-G4-6628-01 | Colorectum | colon adenocarcinoma | Male | >=65 | I/II | Unknown | Unknown | SD |
| Page: 1 2 3 4 5 6 |
Top |
Related drugs of malignant transformation related genes |
| Identification of chemicals and drugs interact with genes involved in malignant transfromation |
| (DGIdb 4.0) |
| Entrez ID | Symbol | Category | Interaction Types | Drug Claim Name | Drug Name | PMIDs |
| Page: 1 |

Copyright 2023-Present -The University of Texas Health Science Center at Houston |