| Tissue | Expression Dynamics | Abbreviation |
| Colorectum (GSE201348) |  | FAP: Familial adenomatous polyposis |
| CRC: Colorectal cancer |
| Colorectum (HTA11) |  | AD: Adenomas |
| SER: Sessile serrated lesions |
| MSI-H: Microsatellite-high colorectal cancer |
| MSS: Microsatellite stable colorectal cancer |
| Esophagus | 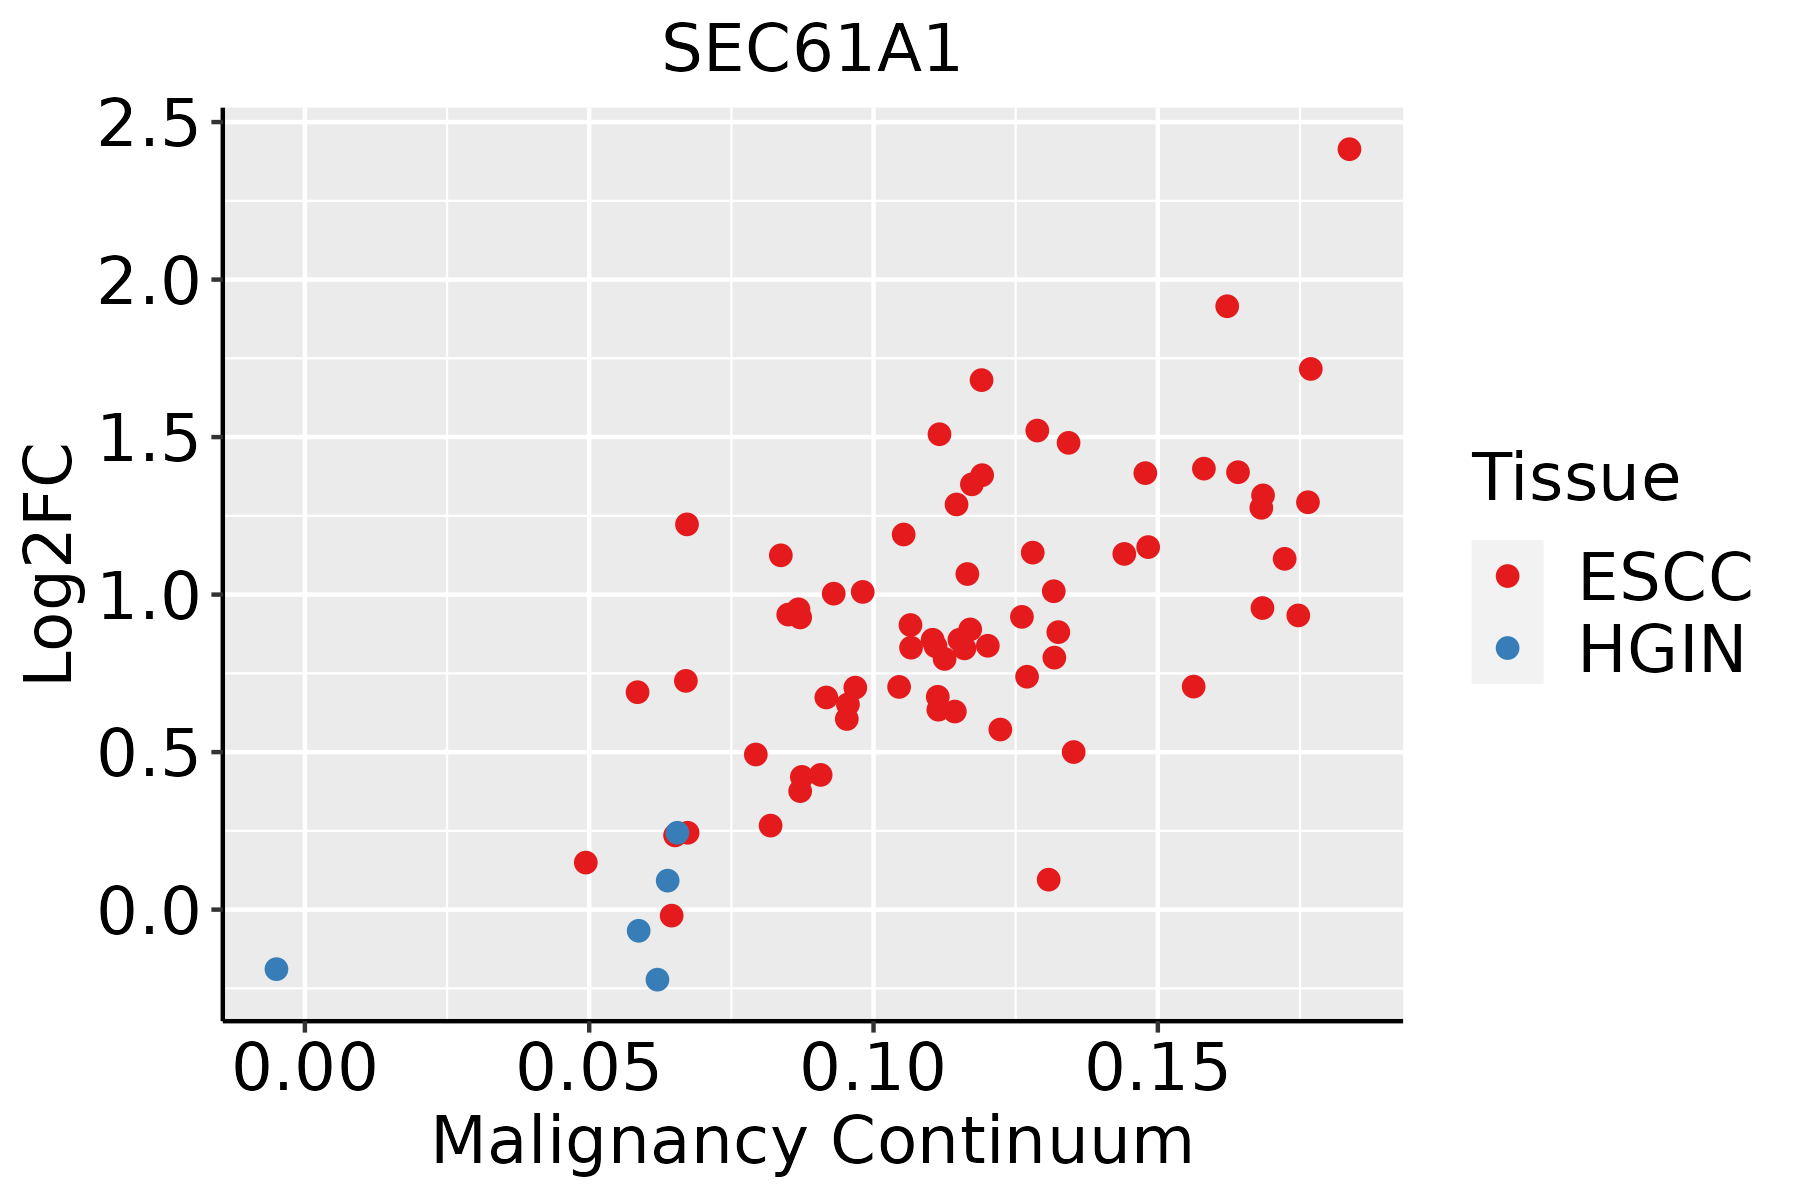 | ESCC: Esophageal squamous cell carcinoma |
| HGIN: High-grade intraepithelial neoplasias |
| LGIN: Low-grade intraepithelial neoplasias |
| Liver |  | HCC: Hepatocellular carcinoma |
| NAFLD: Non-alcoholic fatty liver disease |
| Oral Cavity |  | EOLP: Erosive Oral lichen planus |
| LP: leukoplakia |
| NEOLP: Non-erosive oral lichen planus |
| OSCC: Oral squamous cell carcinoma |
| Prostate | 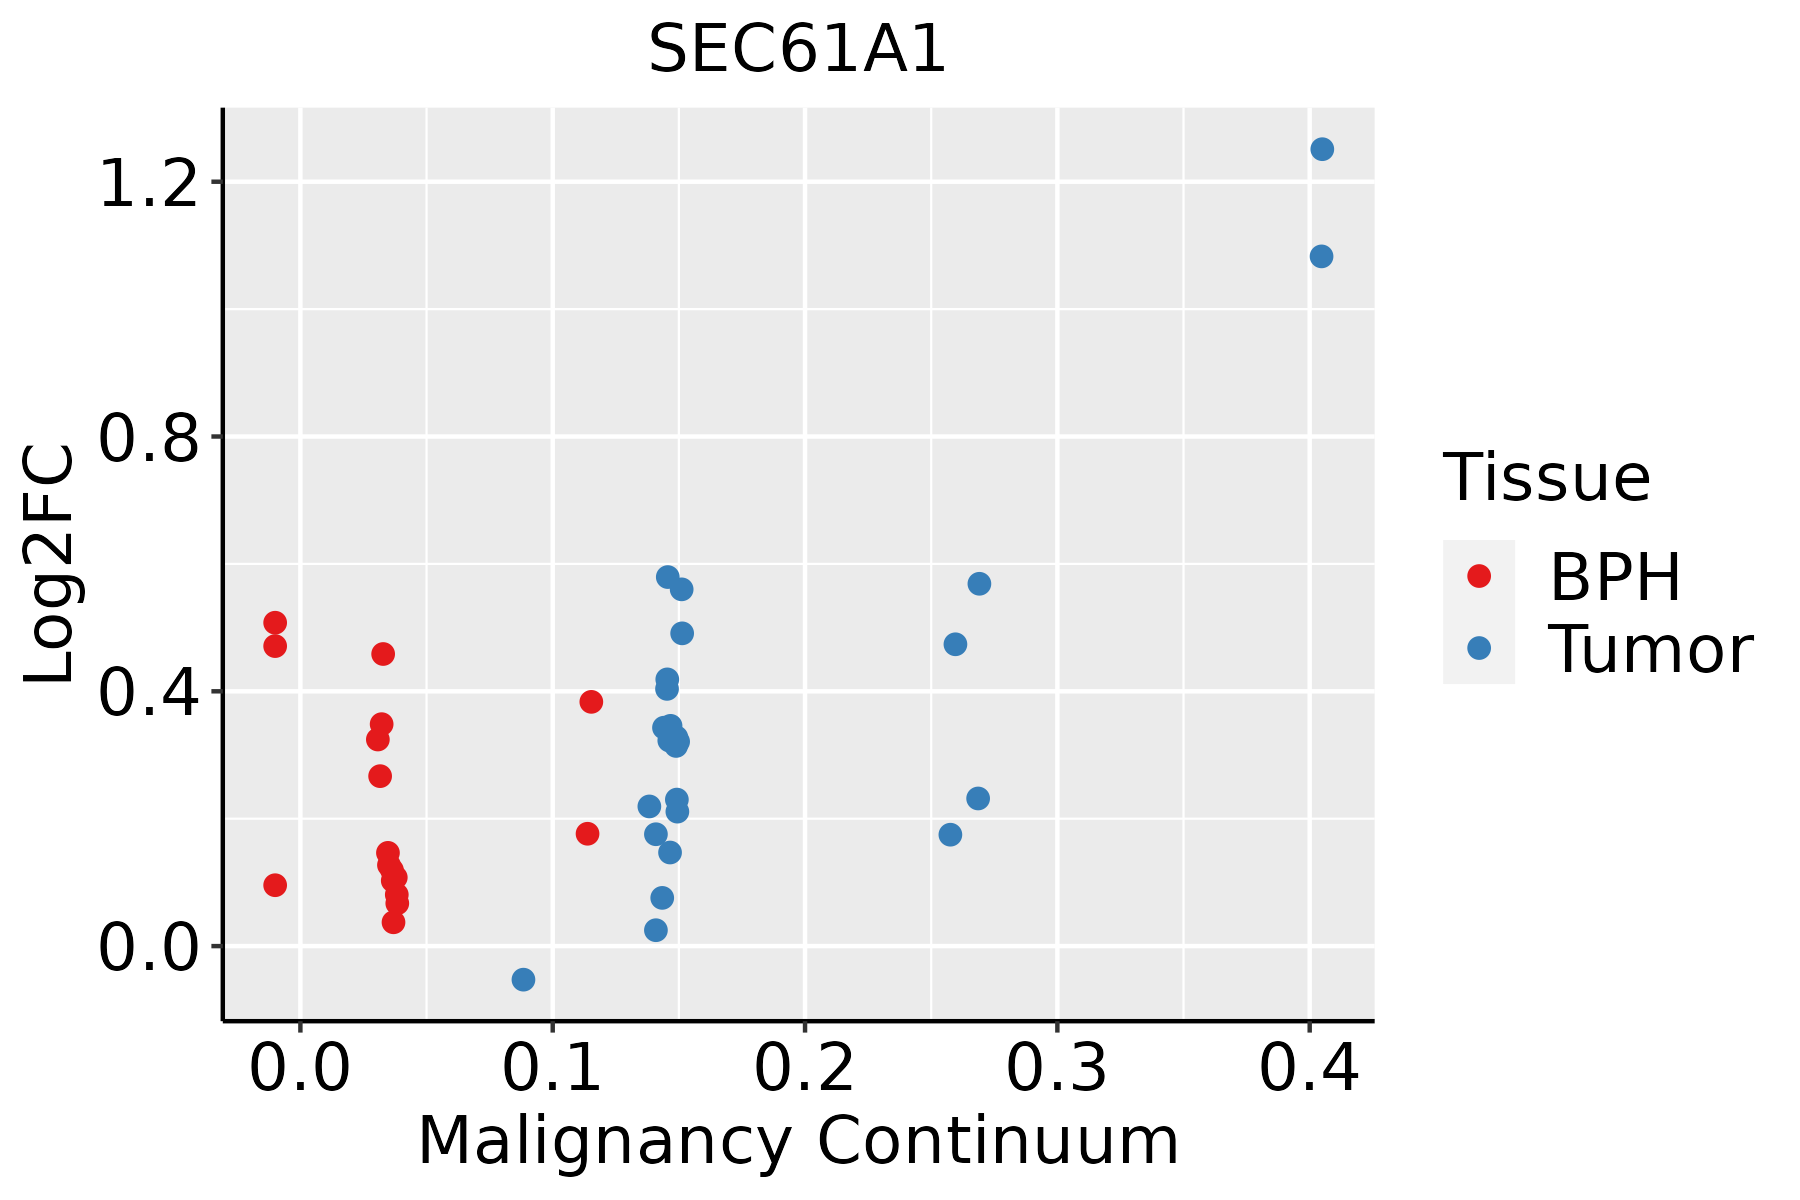 | BPH: Benign Prostatic Hyperplasia |
| Skin | 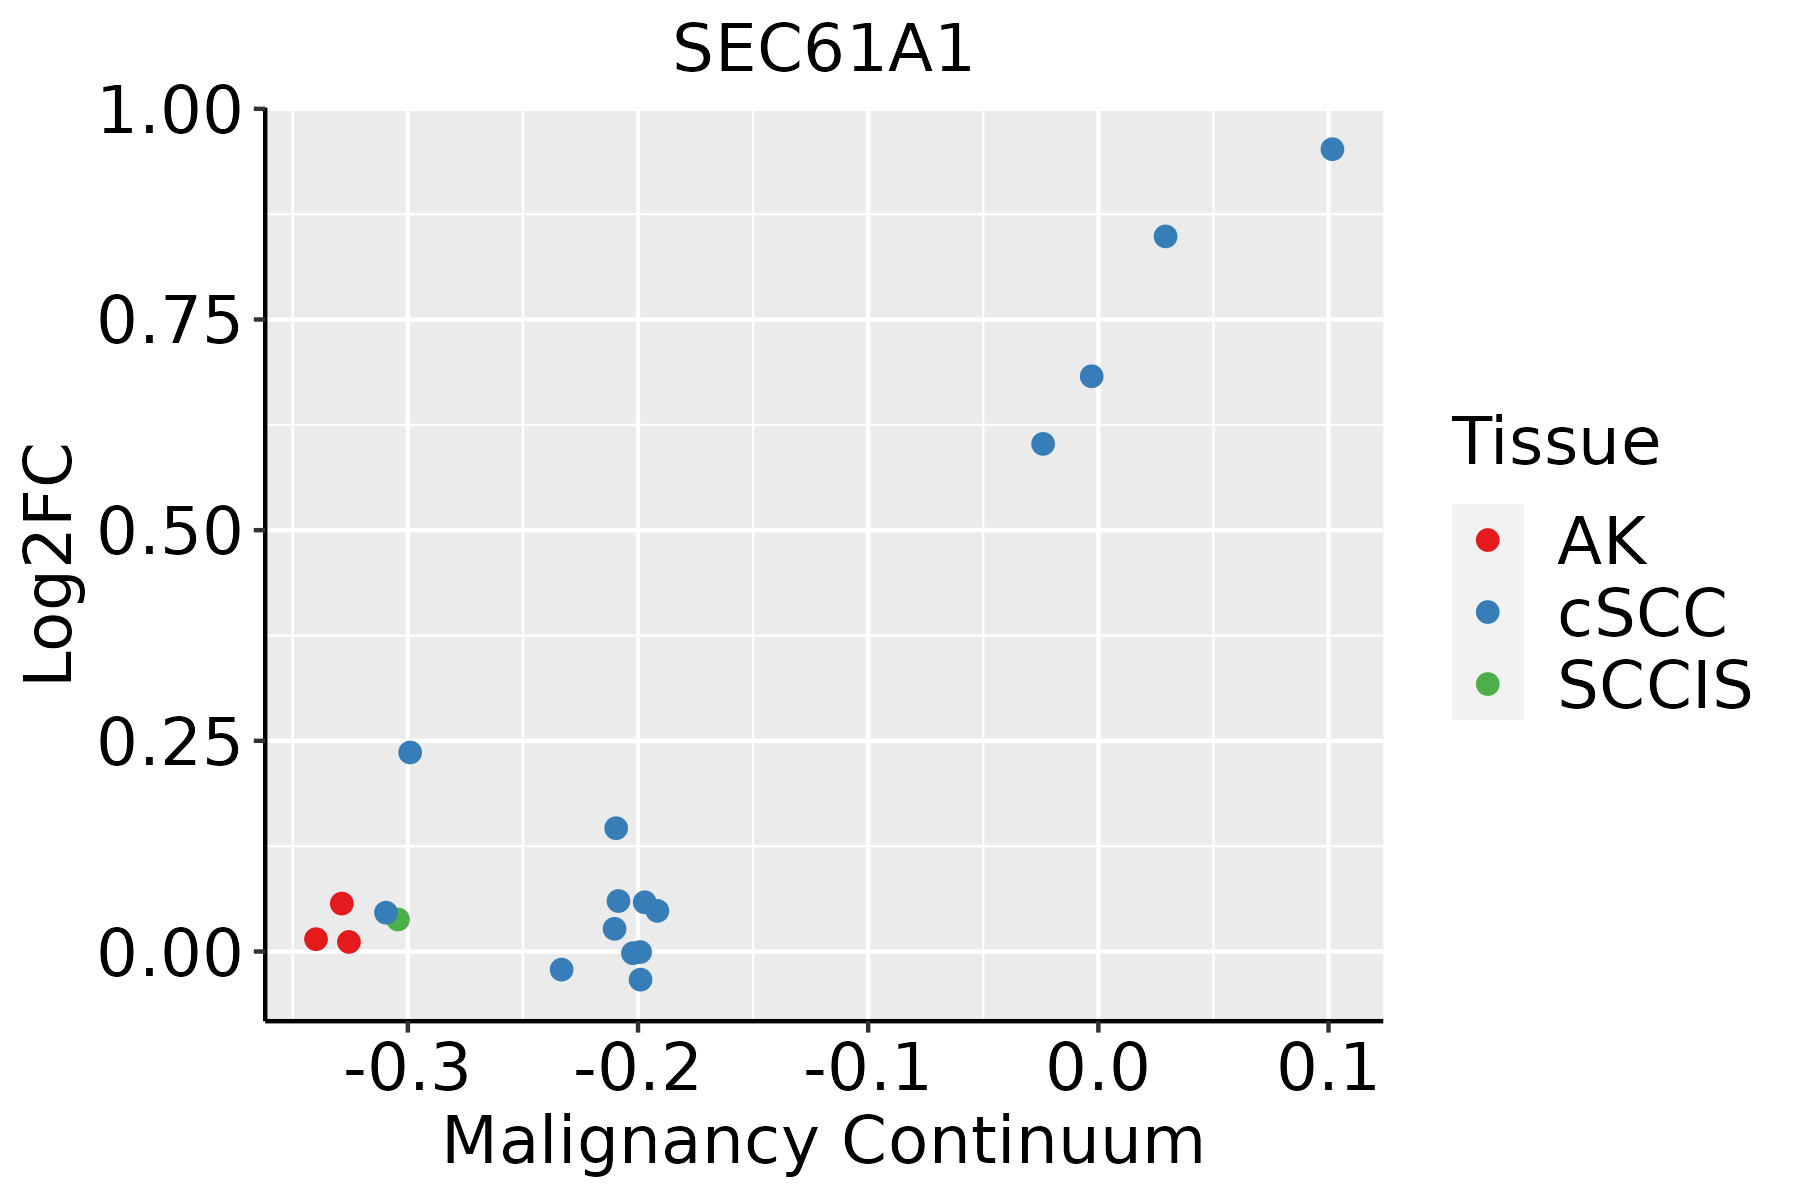 | AK: Actinic keratosis |
| cSCC: Cutaneous squamous cell carcinoma |
| SCCIS:squamous cell carcinoma in situ |
| Thyroid | 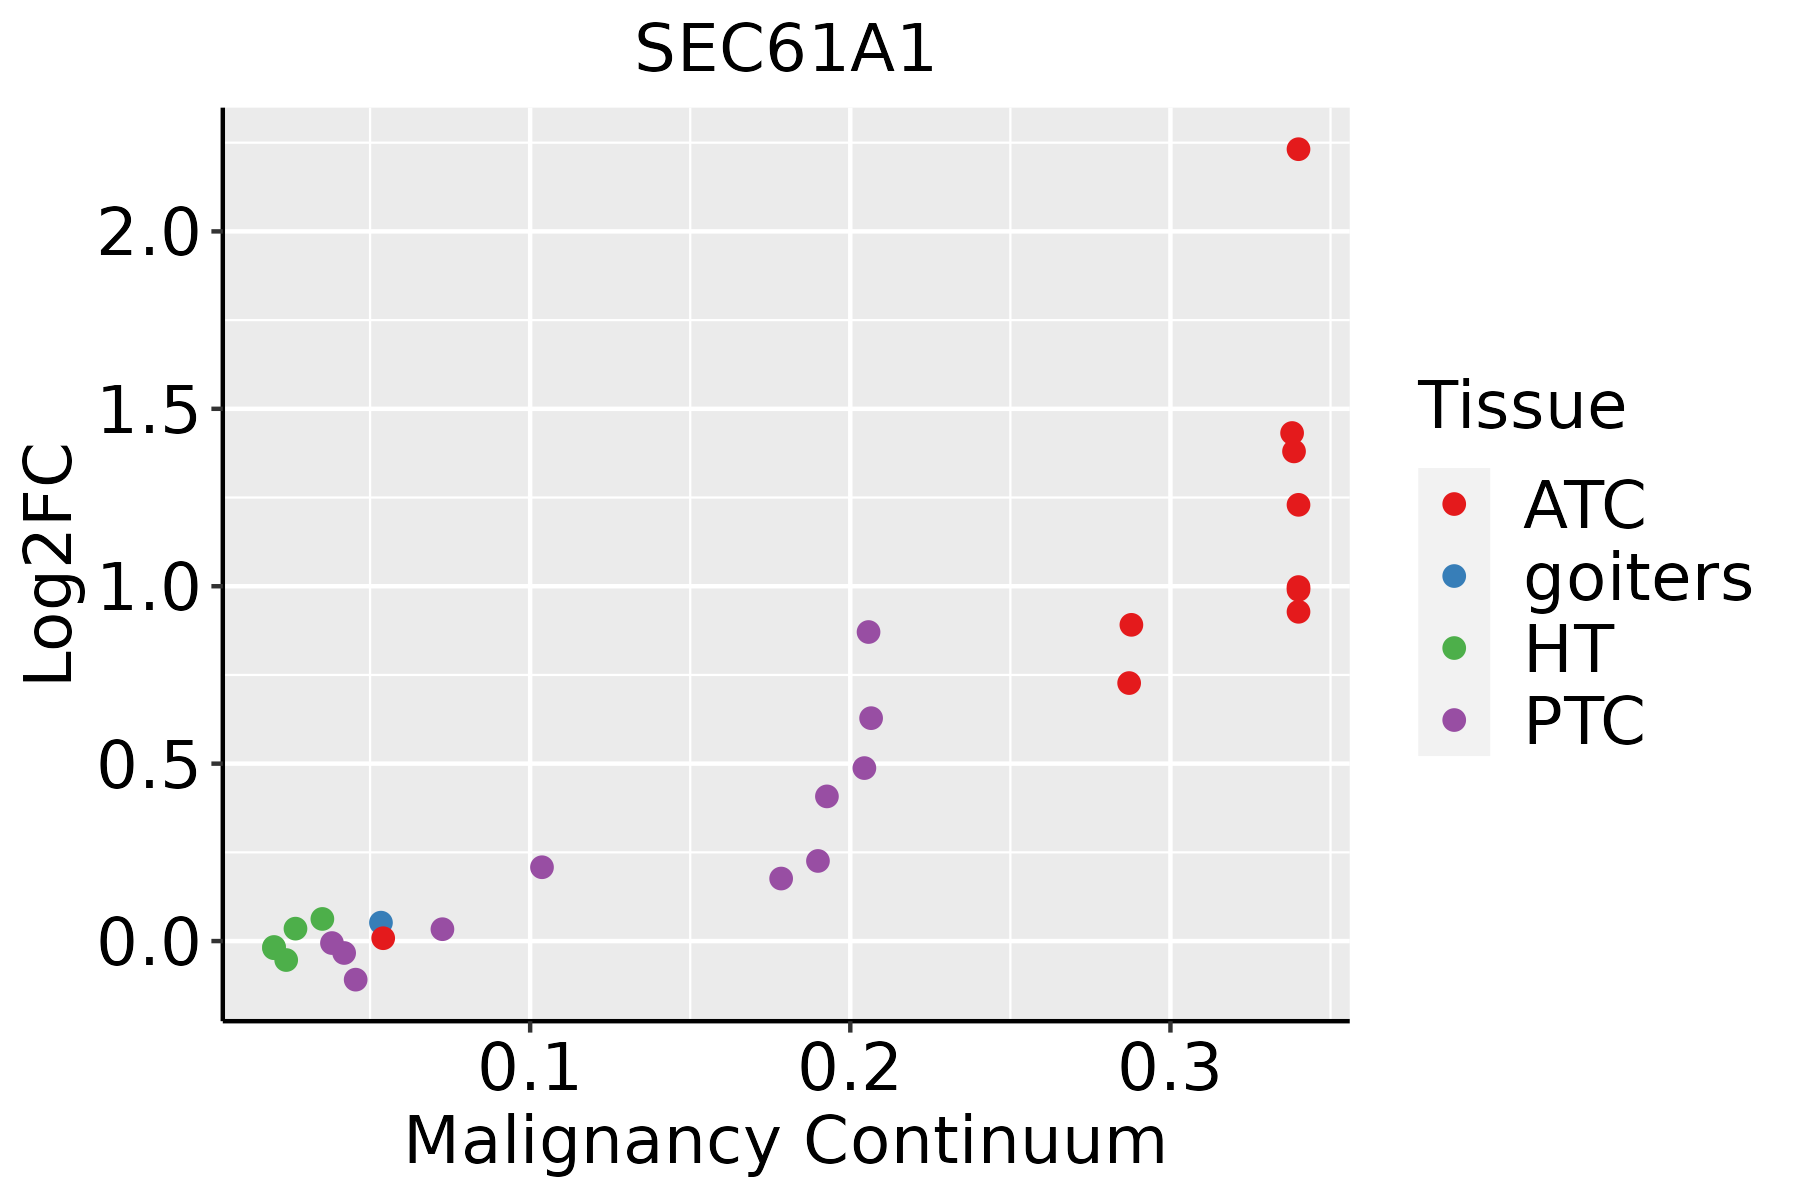 | ATC: Anaplastic thyroid cancer |
| HT: Hashimoto's thyroiditis |
| PTC: Papillary thyroid cancer |
| GO ID | Tissue | Disease Stage | Description | Gene Ratio | Bg Ratio | pvalue | p.adjust | Count |
| GO:007097216 | Prostate | Tumor | protein localization to endoplasmic reticulum | 36/3246 | 74/18723 | 5.66e-10 | 2.95e-08 | 36 |
| GO:007259913 | Prostate | Tumor | establishment of protein localization to endoplasmic reticulum | 23/3246 | 46/18723 | 3.87e-07 | 8.56e-06 | 23 |
| GO:009015017 | Prostate | Tumor | establishment of protein localization to membrane | 77/3246 | 260/18723 | 6.46e-07 | 1.33e-05 | 77 |
| GO:004504713 | Prostate | Tumor | protein targeting to ER | 21/3246 | 42/18723 | 1.24e-06 | 2.31e-05 | 21 |
| GO:000165513 | Prostate | Tumor | urogenital system development | 90/3246 | 338/18723 | 1.08e-05 | 1.56e-04 | 90 |
| GO:000661312 | Prostate | Tumor | cotranslational protein targeting to membrane | 15/3246 | 31/18723 | 6.78e-05 | 7.21e-04 | 15 |
| GO:000182213 | Prostate | Tumor | kidney development | 74/3246 | 293/18723 | 3.68e-04 | 2.87e-03 | 74 |
| GO:007200113 | Prostate | Tumor | renal system development | 75/3246 | 302/18723 | 5.74e-04 | 4.13e-03 | 75 |
| GO:000702912 | Prostate | Tumor | endoplasmic reticulum organization | 27/3246 | 87/18723 | 1.24e-03 | 7.83e-03 | 27 |
| GO:000662015 | Prostate | Tumor | posttranslational protein targeting to endoplasmic reticulum membrane | 7/3246 | 12/18723 | 1.64e-03 | 9.79e-03 | 7 |
| GO:007180614 | Prostate | Tumor | protein transmembrane transport | 19/3246 | 59/18723 | 3.94e-03 | 2.00e-02 | 19 |
| GO:003434113 | Prostate | Tumor | response to interferon-gamma | 37/3246 | 141/18723 | 5.07e-03 | 2.46e-02 | 37 |
| GO:007200613 | Prostate | Tumor | nephron development | 37/3246 | 142/18723 | 5.73e-03 | 2.67e-02 | 37 |
| GO:00066141 | Prostate | Tumor | SRP-dependent cotranslational protein targeting to membrane | 10/3246 | 26/18723 | 8.67e-03 | 3.76e-02 | 10 |
| GO:006500212 | Prostate | Tumor | intracellular protein transmembrane transport | 16/3246 | 51/18723 | 1.02e-02 | 4.29e-02 | 16 |
| GO:007259427 | Skin | cSCC | establishment of protein localization to organelle | 213/4864 | 422/18723 | 1.40e-27 | 5.15e-25 | 213 |
| GO:000660527 | Skin | cSCC | protein targeting | 153/4864 | 314/18723 | 2.62e-18 | 3.36e-16 | 153 |
| GO:009015024 | Skin | cSCC | establishment of protein localization to membrane | 123/4864 | 260/18723 | 8.34e-14 | 5.18e-12 | 123 |
| GO:0070972110 | Skin | cSCC | protein localization to endoplasmic reticulum | 41/4864 | 74/18723 | 7.13e-08 | 1.78e-06 | 41 |
| GO:007180610 | Skin | cSCC | protein transmembrane transport | 33/4864 | 59/18723 | 9.93e-07 | 1.78e-05 | 33 |
| Pathway ID | Tissue | Disease Stage | Description | Gene Ratio | Bg Ratio | pvalue | p.adjust | qvalue | Count |
| hsa04141 | Colorectum | AD | Protein processing in endoplasmic reticulum | 80/2092 | 174/8465 | 5.96e-10 | 1.25e-08 | 7.96e-09 | 80 |
| hsa05110 | Colorectum | AD | Vibrio cholerae infection | 29/2092 | 50/8465 | 5.10e-07 | 7.12e-06 | 4.54e-06 | 29 |
| hsa03060 | Colorectum | AD | Protein export | 14/2092 | 23/8465 | 2.43e-04 | 1.90e-03 | 1.21e-03 | 14 |
| hsa041411 | Colorectum | AD | Protein processing in endoplasmic reticulum | 80/2092 | 174/8465 | 5.96e-10 | 1.25e-08 | 7.96e-09 | 80 |
| hsa051101 | Colorectum | AD | Vibrio cholerae infection | 29/2092 | 50/8465 | 5.10e-07 | 7.12e-06 | 4.54e-06 | 29 |
| hsa030601 | Colorectum | AD | Protein export | 14/2092 | 23/8465 | 2.43e-04 | 1.90e-03 | 1.21e-03 | 14 |
| hsa041412 | Colorectum | SER | Protein processing in endoplasmic reticulum | 60/1580 | 174/8465 | 4.20e-07 | 7.33e-06 | 5.32e-06 | 60 |
| hsa051102 | Colorectum | SER | Vibrio cholerae infection | 24/1580 | 50/8465 | 2.17e-06 | 3.13e-05 | 2.28e-05 | 24 |
| hsa041413 | Colorectum | SER | Protein processing in endoplasmic reticulum | 60/1580 | 174/8465 | 4.20e-07 | 7.33e-06 | 5.32e-06 | 60 |
| hsa051103 | Colorectum | SER | Vibrio cholerae infection | 24/1580 | 50/8465 | 2.17e-06 | 3.13e-05 | 2.28e-05 | 24 |
| hsa041414 | Colorectum | MSS | Protein processing in endoplasmic reticulum | 75/1875 | 174/8465 | 3.78e-10 | 8.44e-09 | 5.17e-09 | 75 |
| hsa041415 | Colorectum | MSS | Protein processing in endoplasmic reticulum | 75/1875 | 174/8465 | 3.78e-10 | 8.44e-09 | 5.17e-09 | 75 |
| hsa041416 | Colorectum | MSI-H | Protein processing in endoplasmic reticulum | 46/797 | 174/8465 | 4.53e-11 | 9.78e-10 | 8.19e-10 | 46 |
| hsa051106 | Colorectum | MSI-H | Vibrio cholerae infection | 18/797 | 50/8465 | 2.77e-07 | 5.61e-06 | 4.70e-06 | 18 |
| hsa030604 | Colorectum | MSI-H | Protein export | 11/797 | 23/8465 | 2.26e-06 | 3.65e-05 | 3.06e-05 | 11 |
| hsa04145 | Colorectum | MSI-H | Phagosome | 27/797 | 152/8465 | 8.74e-04 | 1.01e-02 | 8.48e-03 | 27 |
| hsa041417 | Colorectum | MSI-H | Protein processing in endoplasmic reticulum | 46/797 | 174/8465 | 4.53e-11 | 9.78e-10 | 8.19e-10 | 46 |
| hsa051107 | Colorectum | MSI-H | Vibrio cholerae infection | 18/797 | 50/8465 | 2.77e-07 | 5.61e-06 | 4.70e-06 | 18 |
| hsa030605 | Colorectum | MSI-H | Protein export | 11/797 | 23/8465 | 2.26e-06 | 3.65e-05 | 3.06e-05 | 11 |
| hsa041451 | Colorectum | MSI-H | Phagosome | 27/797 | 152/8465 | 8.74e-04 | 1.01e-02 | 8.48e-03 | 27 |
| Hugo Symbol | Variant Class | Variant Classification | dbSNP RS | HGVSc | HGVSp | HGVSp Short | SWISSPROT | BIOTYPE | SIFT | PolyPhen | Tumor Sample Barcode | Tissue | Histology | Sex | Age | Stage | Therapy Types | Drugs | Outcome |
| SEC61A1 | SNV | Missense_Mutation | | c.729N>A | p.Met243Ile | p.M243I | P61619 | protein_coding | tolerated(0.2) | benign(0.003) | TCGA-A2-A0YL-01 | Breast | breast invasive carcinoma | Female | <65 | III/IV | Chemotherapy | cytoxan | SD |
| SEC61A1 | SNV | Missense_Mutation | | c.584N>G | p.Ala195Gly | p.A195G | P61619 | protein_coding | deleterious(0.03) | benign(0.104) | TCGA-A8-A08L-01 | Breast | breast invasive carcinoma | Female | >=65 | III/IV | Unknown | Unknown | SD |
| SEC61A1 | SNV | Missense_Mutation | | c.691N>T | p.Arg231Trp | p.R231W | P61619 | protein_coding | deleterious(0.03) | probably_damaging(0.926) | TCGA-AC-A23H-01 | Breast | breast invasive carcinoma | Female | >=65 | I/II | Unknown | Unknown | PD |
| SEC61A1 | SNV | Missense_Mutation | novel | c.1157C>T | p.Ser386Phe | p.S386F | P61619 | protein_coding | deleterious(0) | probably_damaging(0.98) | TCGA-AR-A2LE-01 | Breast | breast invasive carcinoma | Female | >=65 | I/II | Hormone Therapy | tamoxiphen | PD |
| SEC61A1 | SNV | Missense_Mutation | novel | c.791N>C | p.Asp264Ala | p.D264A | P61619 | protein_coding | tolerated(0.11) | benign(0.026) | TCGA-BH-A0AW-01 | Breast | breast invasive carcinoma | Female | <65 | I/II | Chemotherapy | carboplatin | SD |
| SEC61A1 | SNV | Missense_Mutation | | c.1253N>T | p.Pro418Leu | p.P418L | P61619 | protein_coding | deleterious(0.01) | possibly_damaging(0.869) | TCGA-D8-A140-01 | Breast | breast invasive carcinoma | Female | <65 | I/II | Chemotherapy | doxorubicin+cyclophosphamid | SD |
| SEC61A1 | insertion | Frame_Shift_Ins | novel | c.1392_1393insTGGACATGTGTTGTTTCTTTCCATGCAGGGCATC | p.Gln465TrpfsTer73 | p.Q465Wfs*73 | P61619 | protein_coding | | | TCGA-B6-A0IA-01 | Breast | breast invasive carcinoma | Female | <65 | I/II | Unknown | Unknown | SD |
| SEC61A1 | insertion | Nonsense_Mutation | novel | c.946_947insGAATTTGCCTGCTAATCACCATTCAGGTAATTATTATGCTAACA | p.Leu316Ter | p.L316* | P61619 | protein_coding | | | TCGA-BH-A0BD-01 | Breast | breast invasive carcinoma | Female | <65 | I/II | Chemotherapy | doxorubicin | SD |
| SEC61A1 | SNV | Missense_Mutation | | c.706N>T | p.Arg236Cys | p.R236C | P61619 | protein_coding | deleterious(0) | probably_damaging(1) | TCGA-A6-2686-01 | Colorectum | colon adenocarcinoma | Female | >=65 | I/II | Unknown | Unknown | SD |
| SEC61A1 | SNV | Missense_Mutation | novel | c.98N>C | p.Leu33Pro | p.L33P | P61619 | protein_coding | deleterious(0) | possibly_damaging(0.861) | TCGA-AA-3947-01 | Colorectum | colon adenocarcinoma | Female | <65 | I/II | Unknown | Unknown | SD |


