| Tissue | Expression Dynamics | Abbreviation |
| Breast | 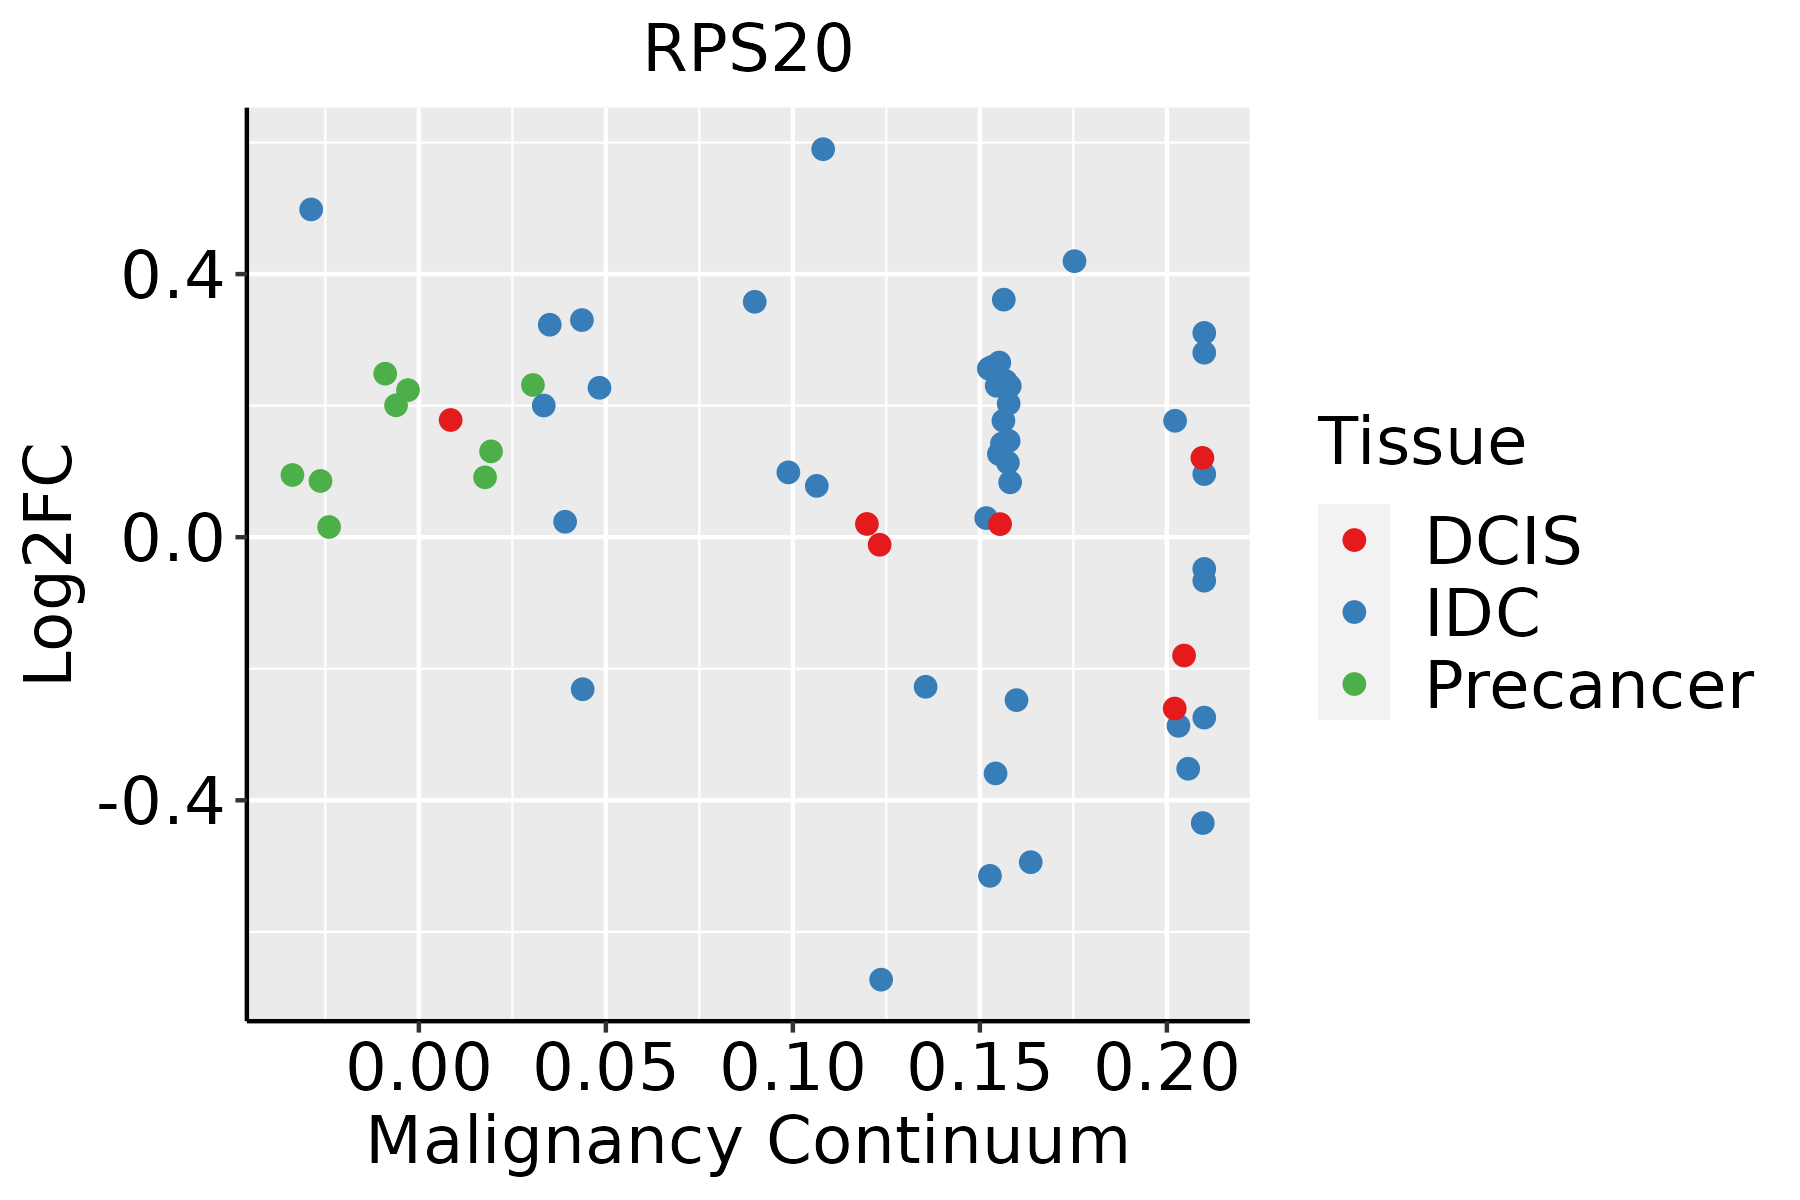 | IDC: Invasive ductal carcinoma |
| DCIS: Ductal carcinoma in situ |
| Precancer(BRCA1-mut): Precancerous lesion from BRCA1 mutation carriers |
| Cervix | 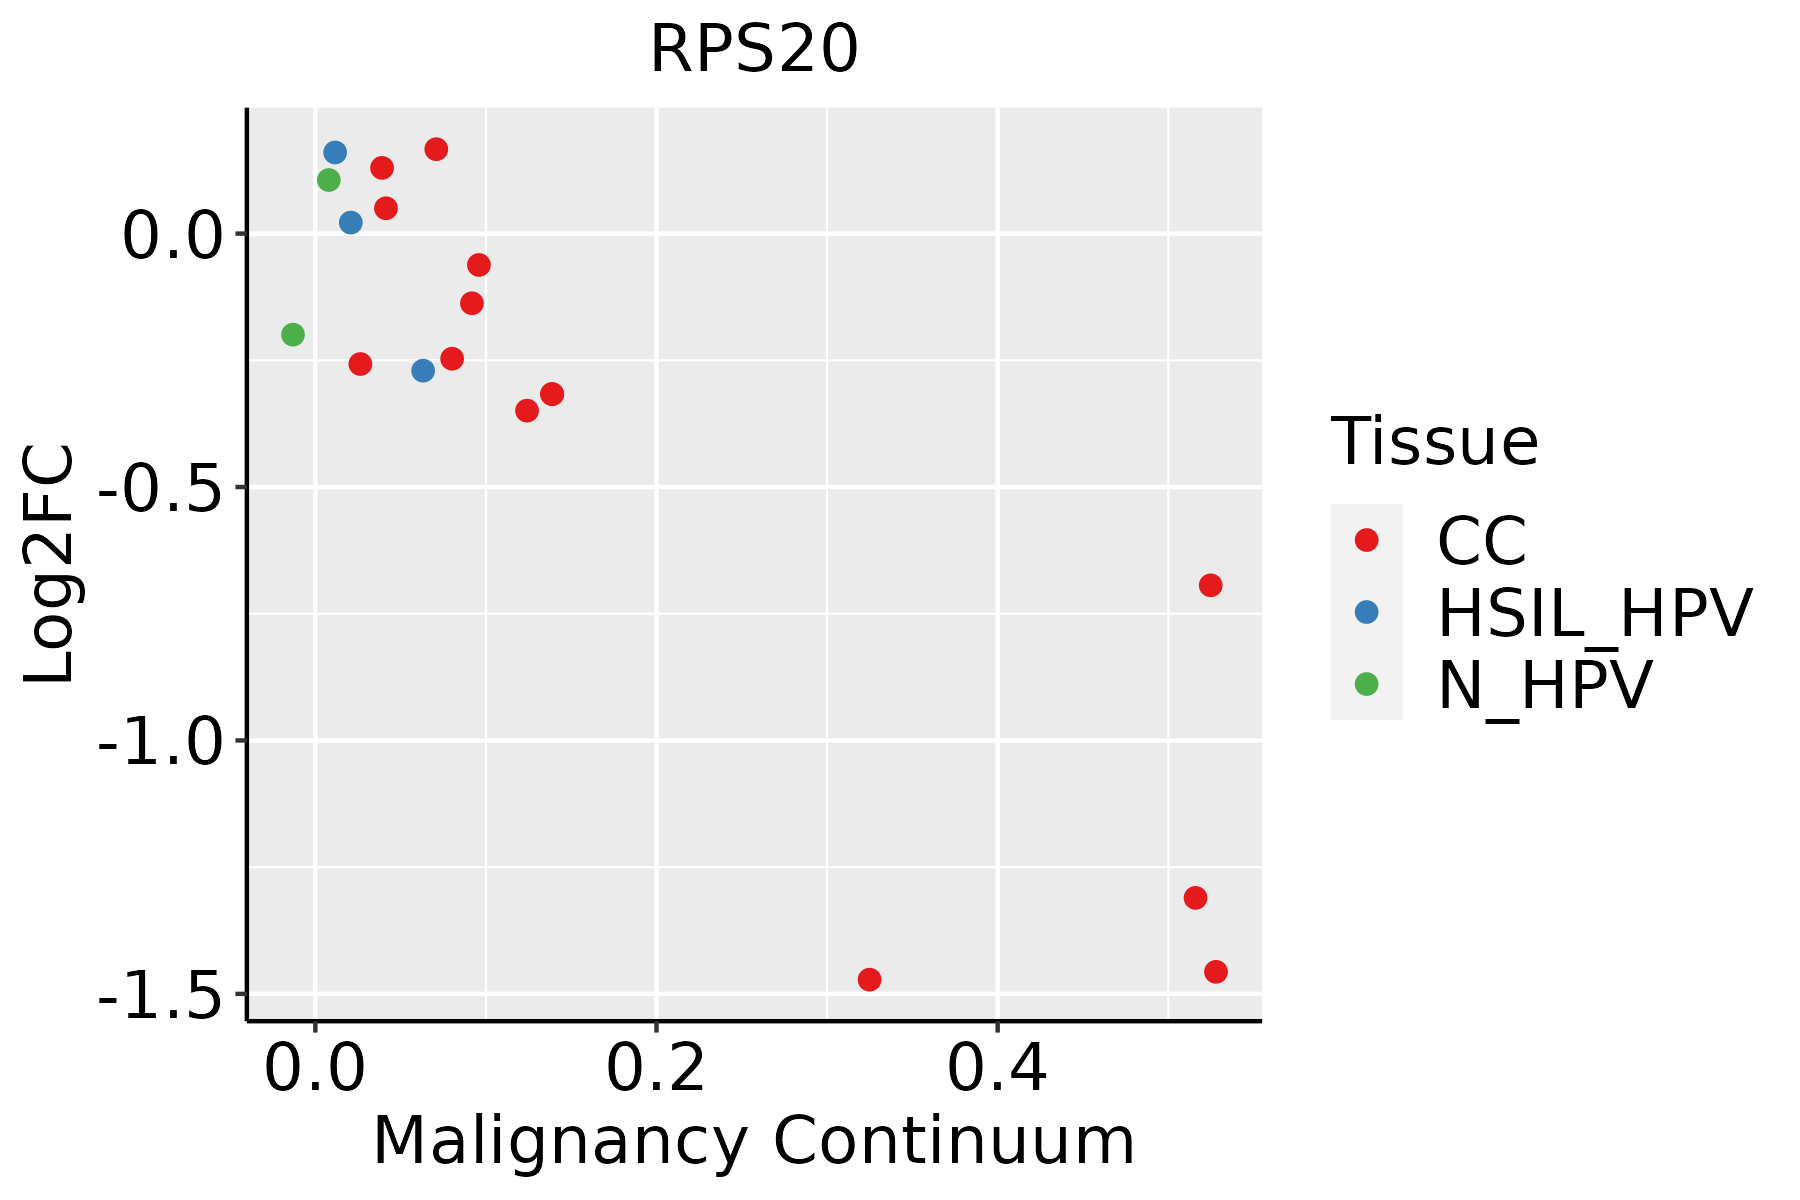 | CC: Cervix cancer |
| HSIL_HPV: HPV-infected high-grade squamous intraepithelial lesions |
| N_HPV: HPV-infected normal cervix |
| Colorectum (GSE201348) |  | FAP: Familial adenomatous polyposis |
| CRC: Colorectal cancer |
| Colorectum (HTA11) | 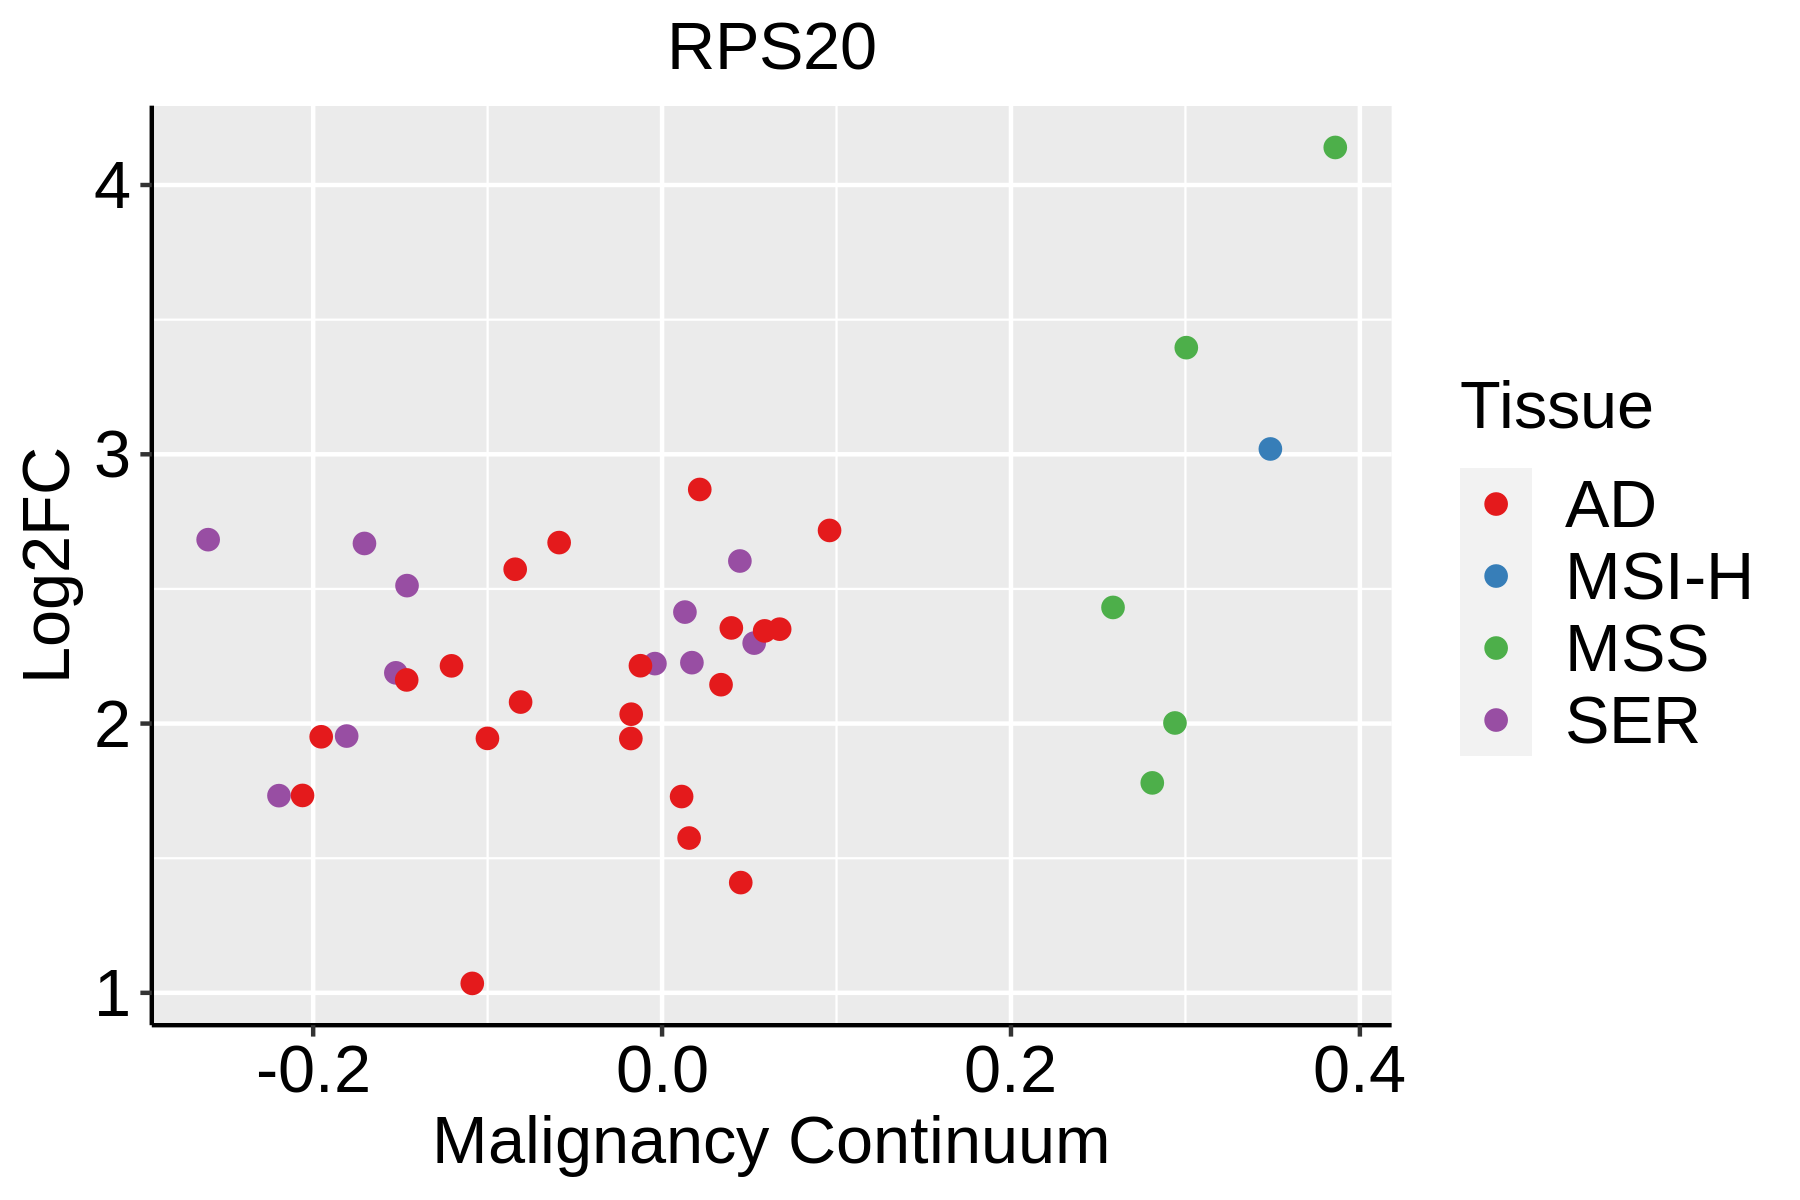 | AD: Adenomas |
| SER: Sessile serrated lesions |
| MSI-H: Microsatellite-high colorectal cancer |
| MSS: Microsatellite stable colorectal cancer |
| Endometrium | 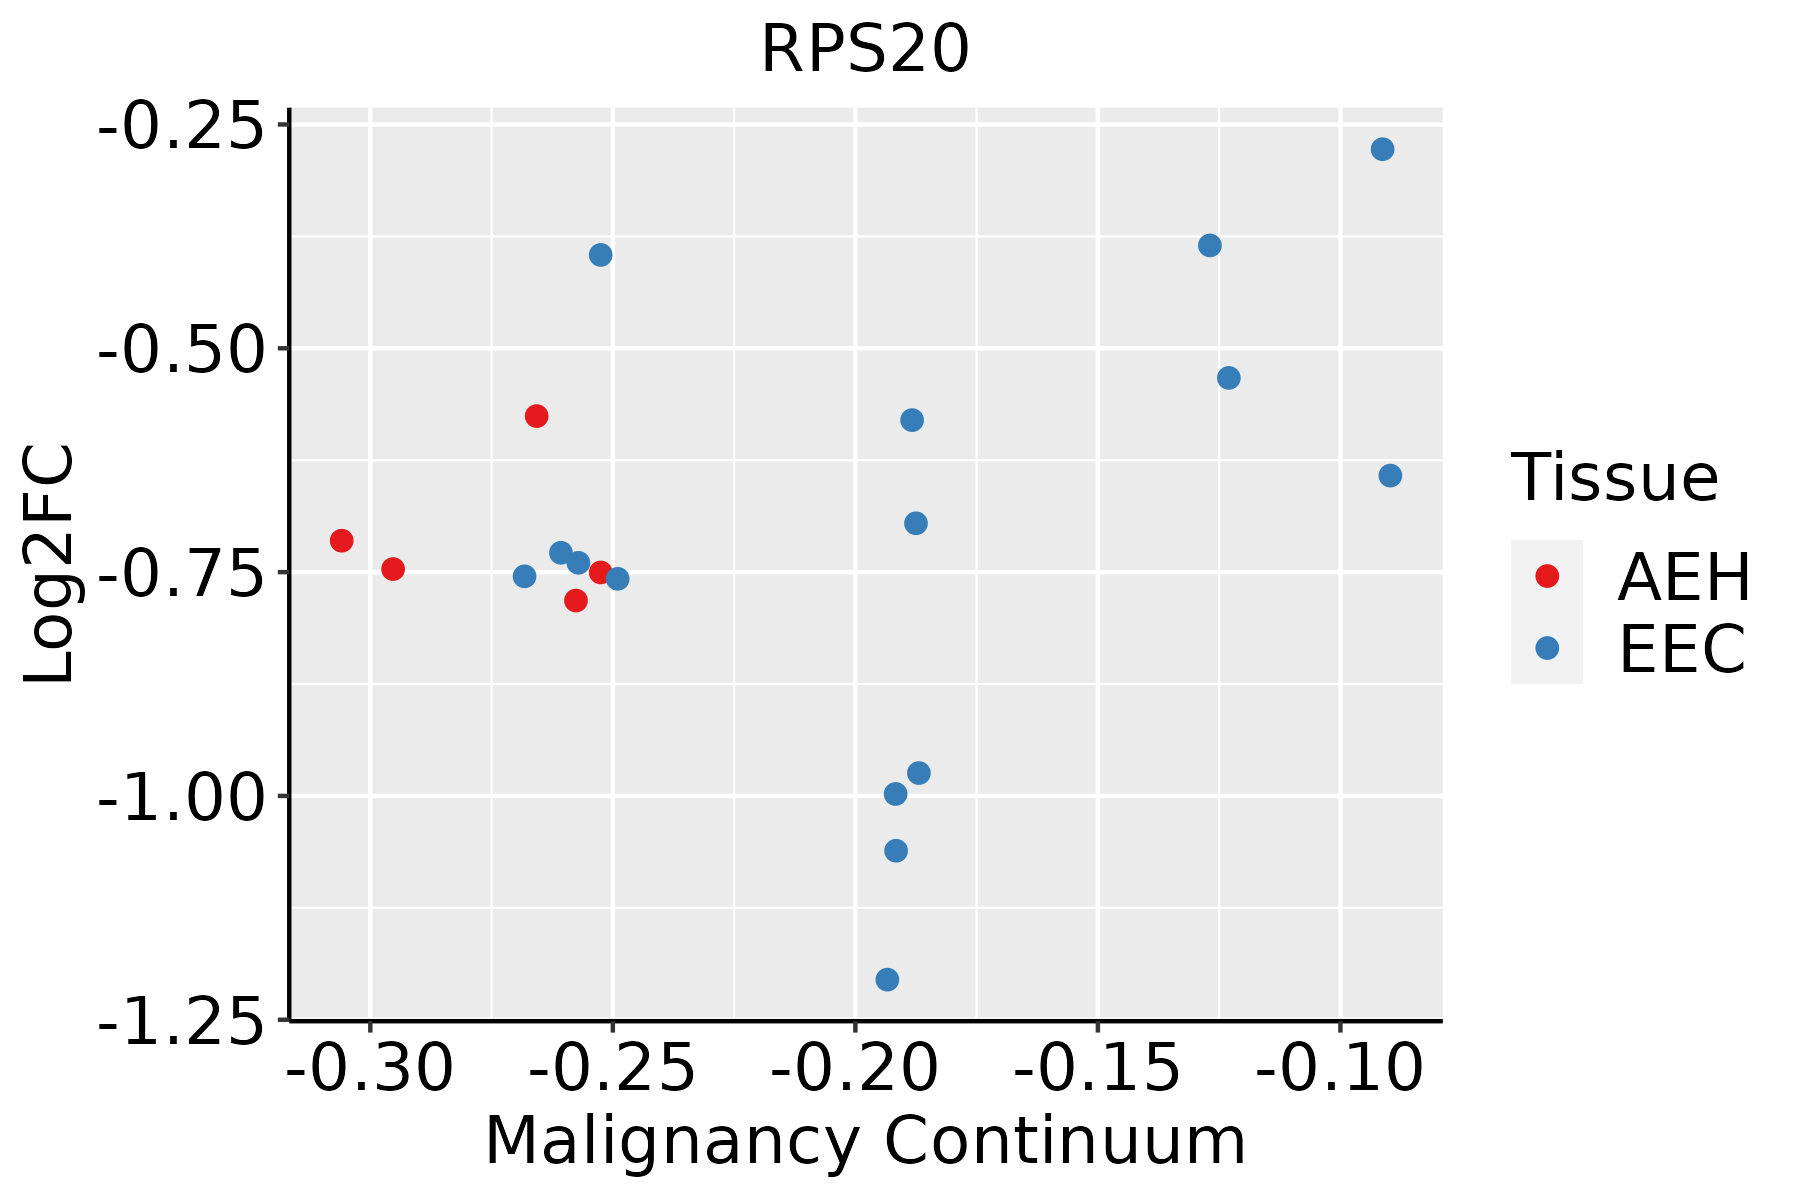 | AEH: Atypical endometrial hyperplasia |
| EEC: Endometrioid Cancer |
| Esophagus | 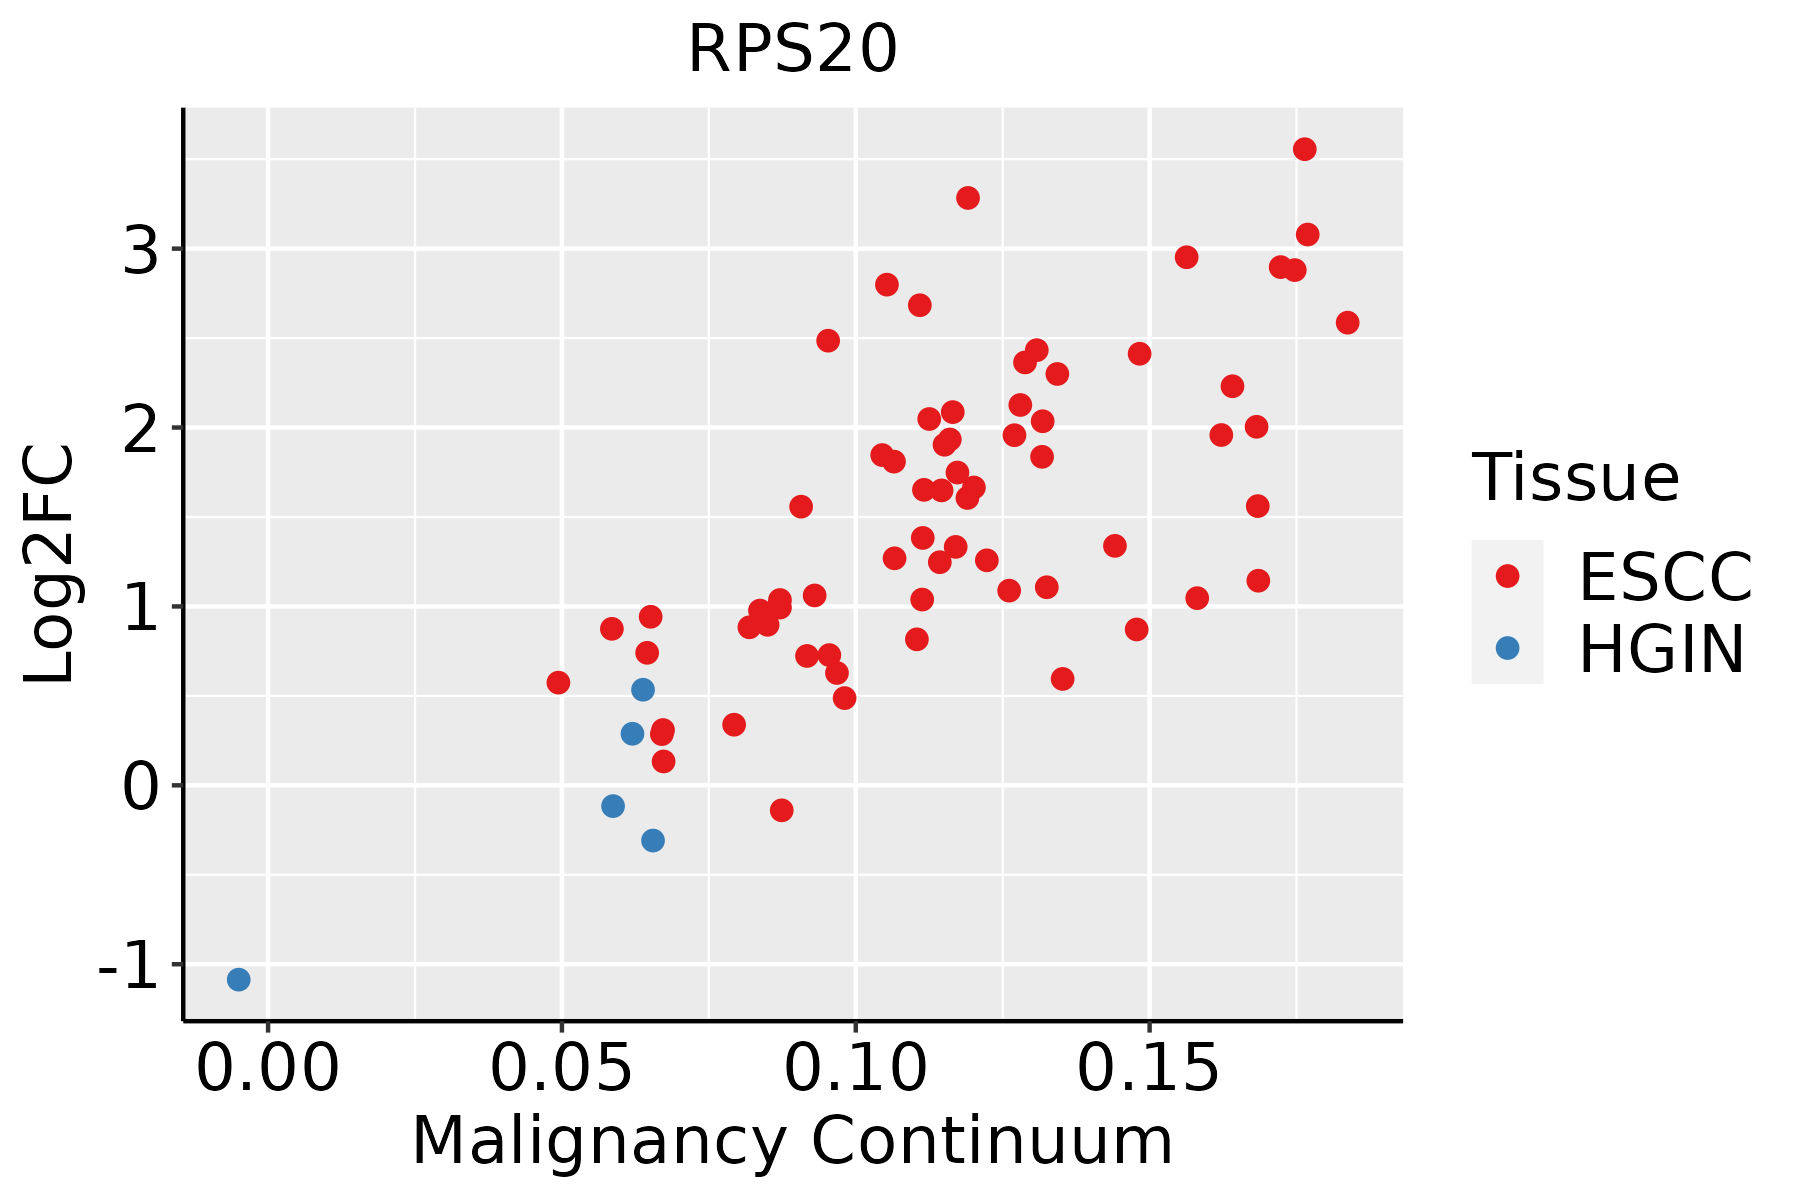 | ESCC: Esophageal squamous cell carcinoma |
| HGIN: High-grade intraepithelial neoplasias |
| LGIN: Low-grade intraepithelial neoplasias |
| GC |  | CAG: Chronic atrophic gastritis |
| CAG with IM: Chronic atrophic gastritis with intestinal metaplasia |
| CSG: Chronic superficial gastritis |
| GC: Gastric cancer |
| SIM: Severe intestinal metaplasia |
| WIM: Wild intestinal metaplasia |
| Liver | 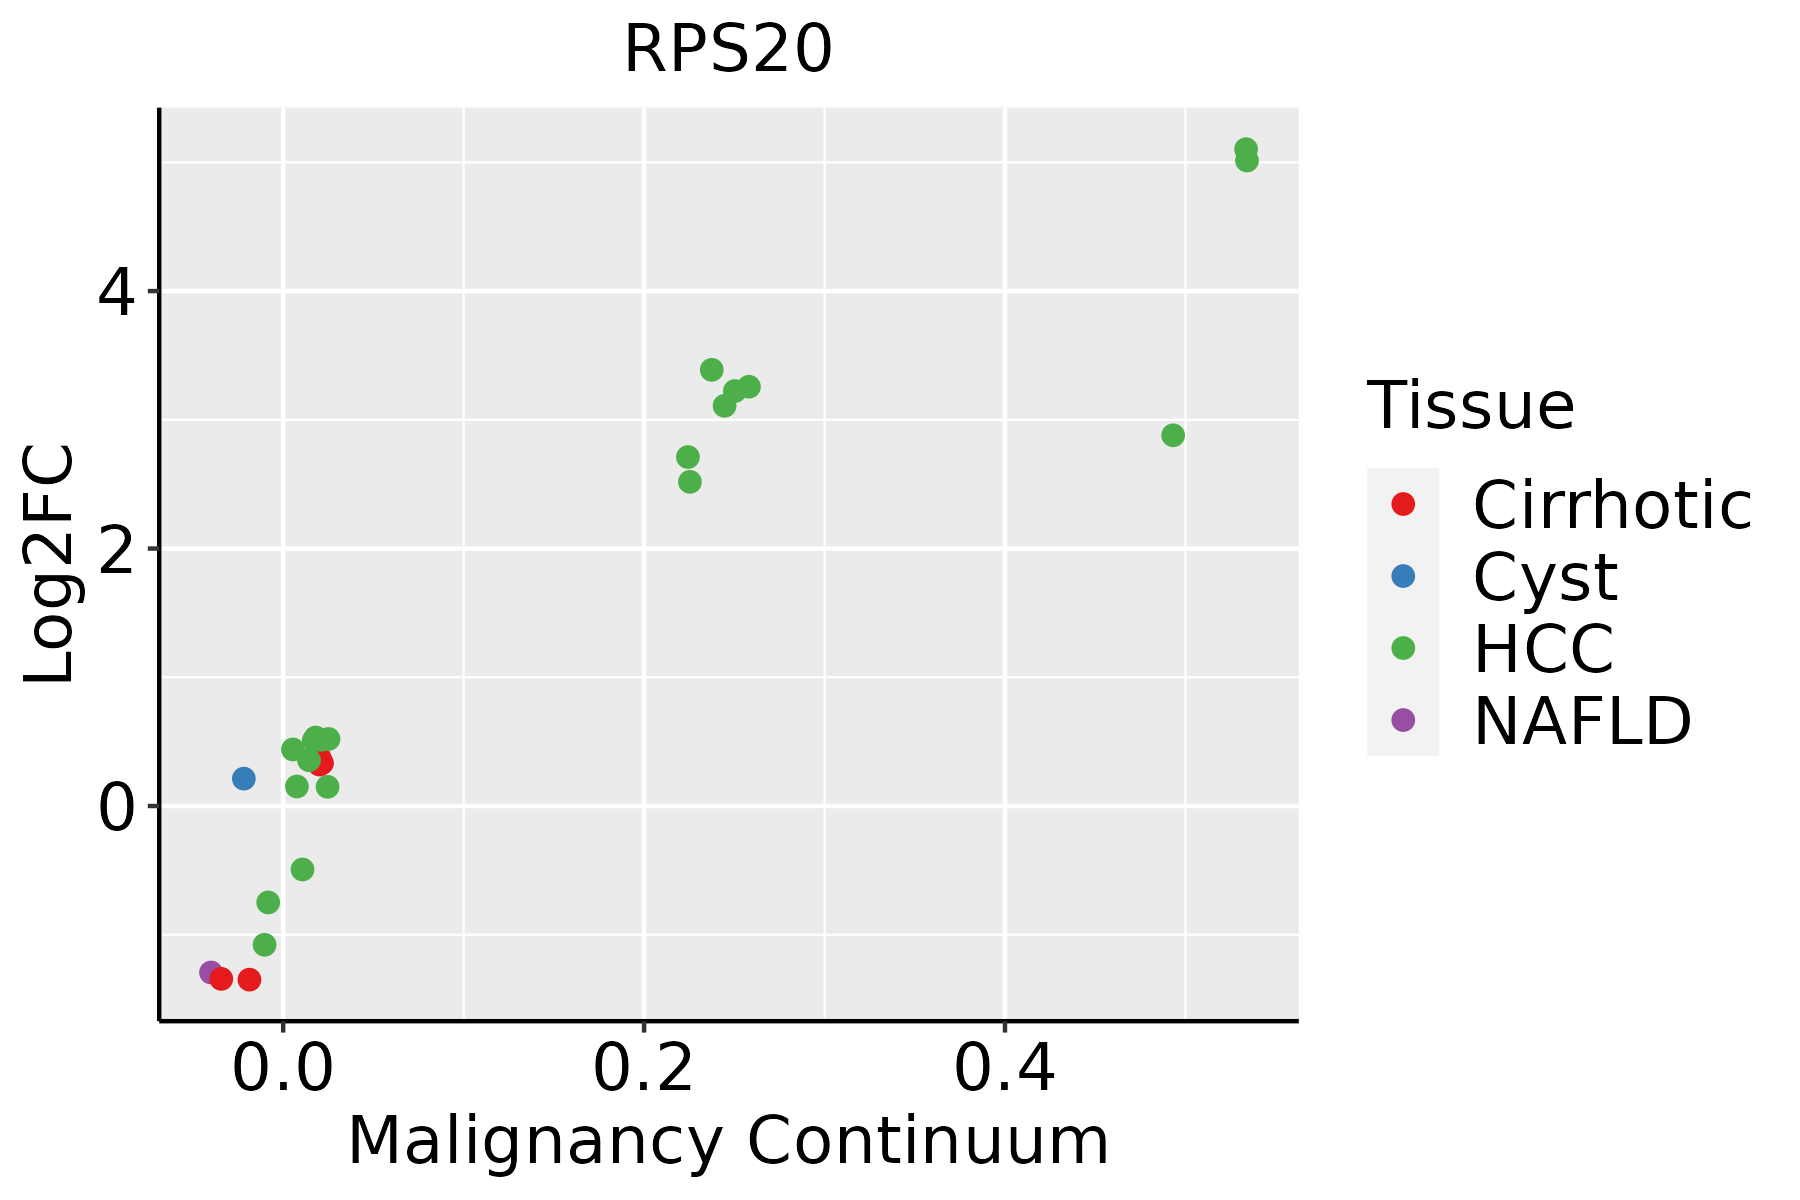 | HCC: Hepatocellular carcinoma |
| NAFLD: Non-alcoholic fatty liver disease |
| Lung | 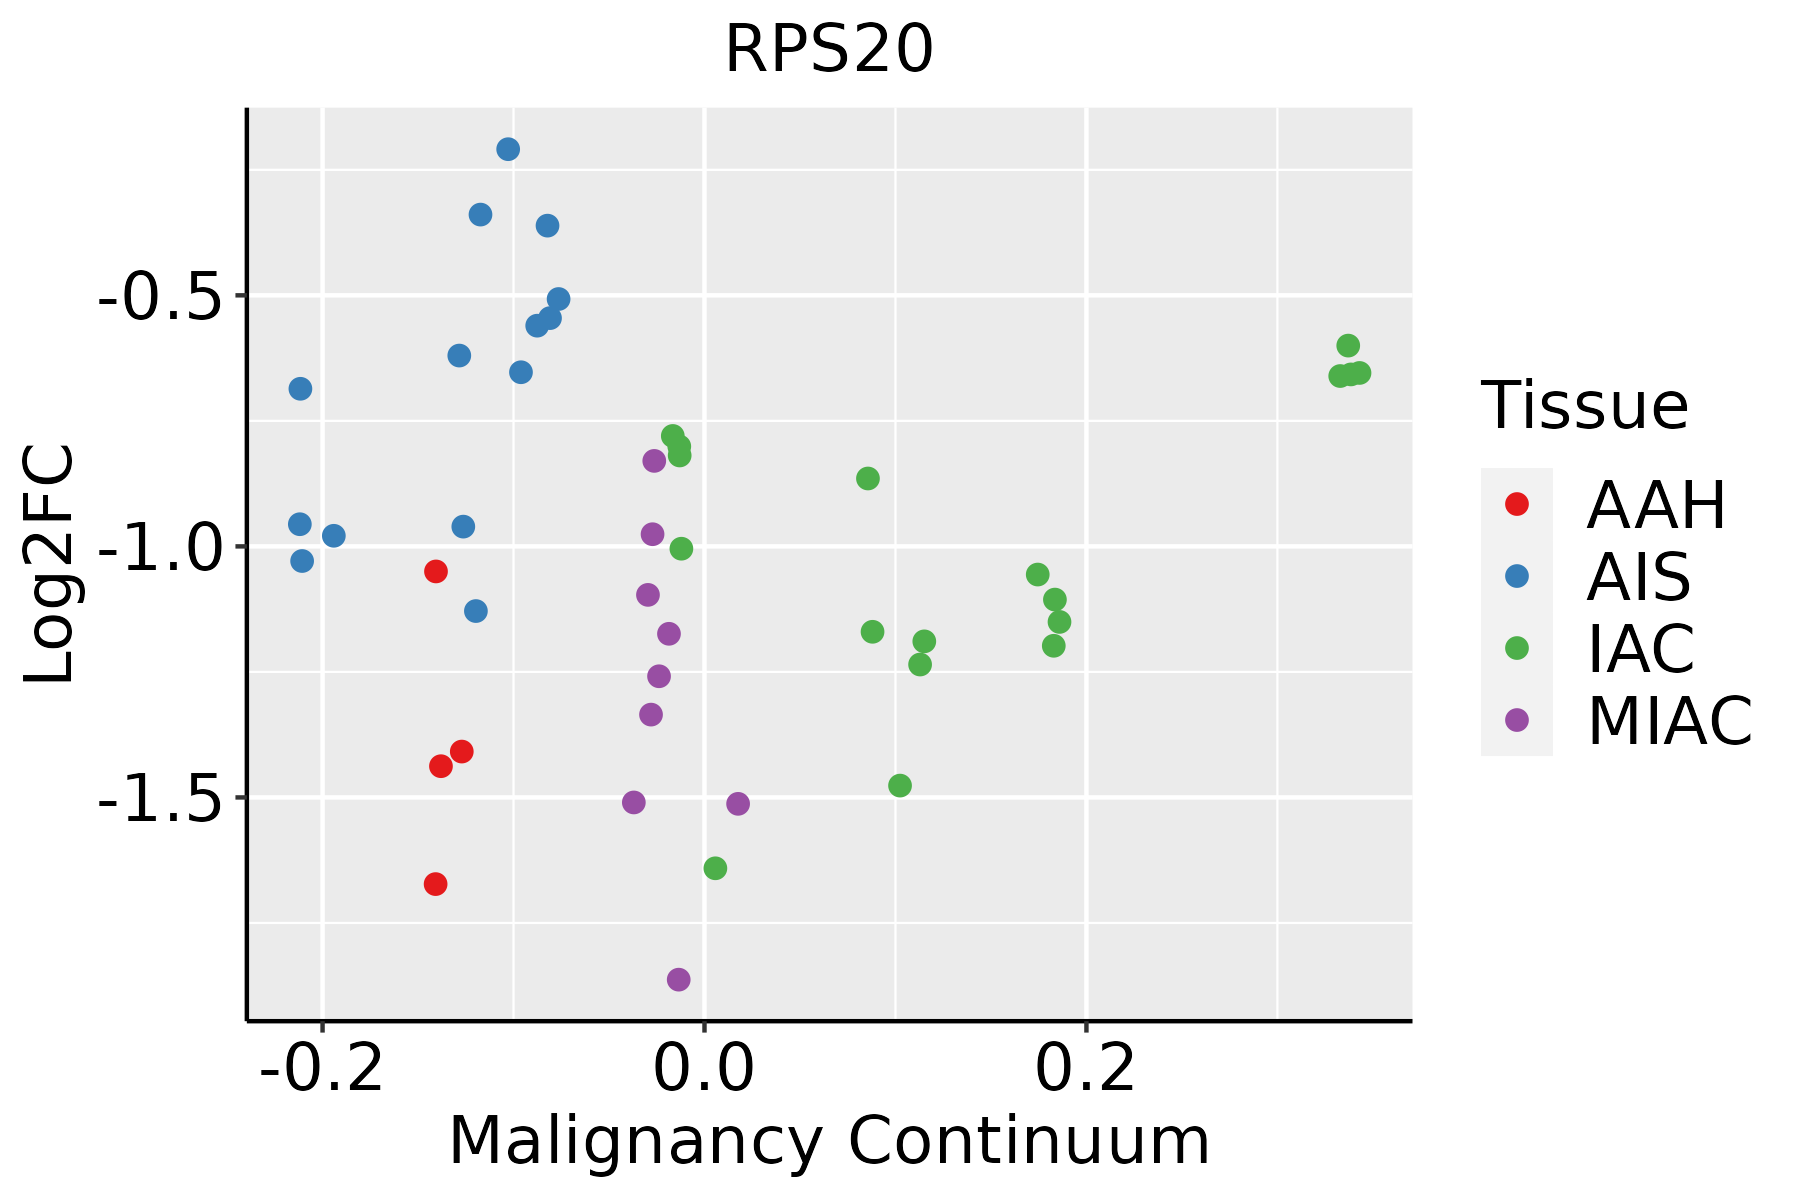 | AAH: Atypical adenomatous hyperplasia |
| AIS: Adenocarcinoma in situ |
| IAC: Invasive lung adenocarcinoma |
| MIA: Minimally invasive adenocarcinoma |
| Oral Cavity | 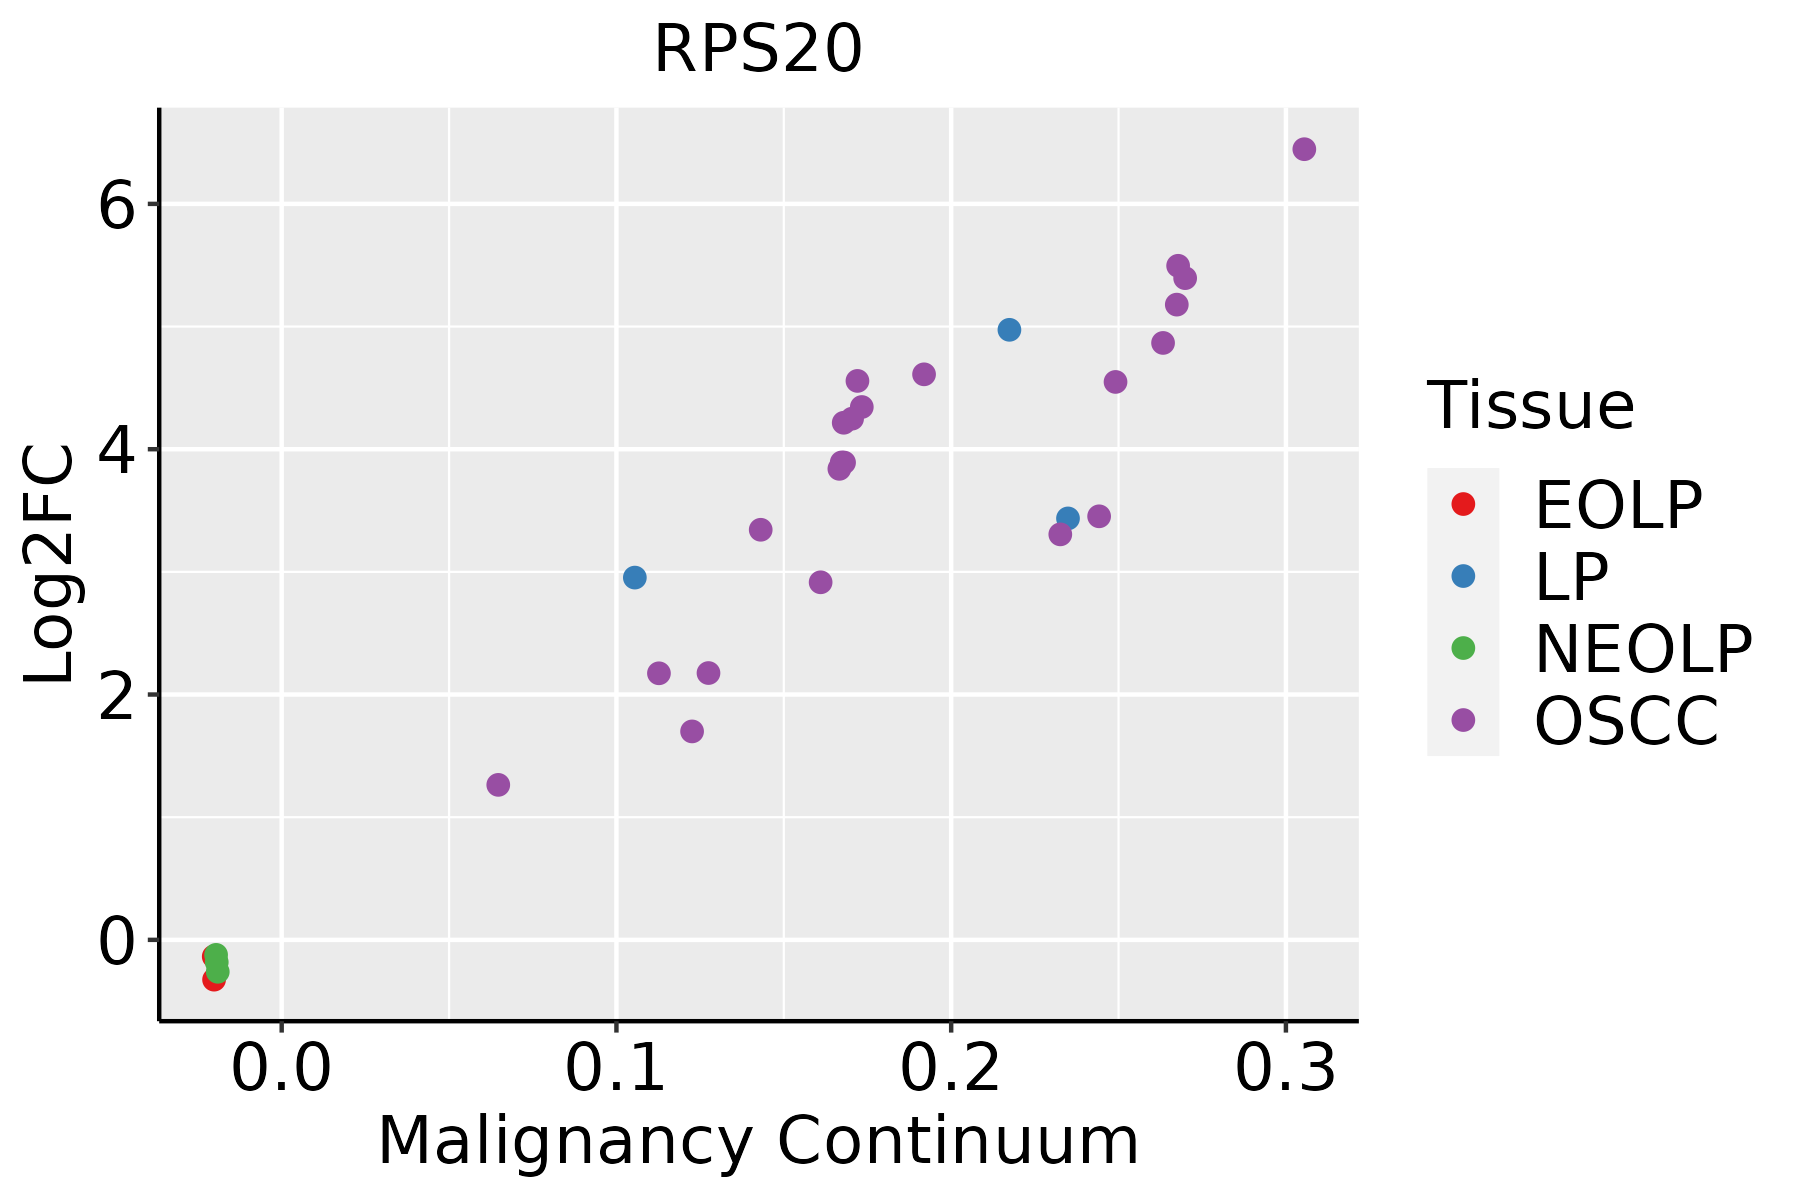 | EOLP: Erosive Oral lichen planus |
| LP: leukoplakia |
| NEOLP: Non-erosive oral lichen planus |
| OSCC: Oral squamous cell carcinoma |
| Prostate | 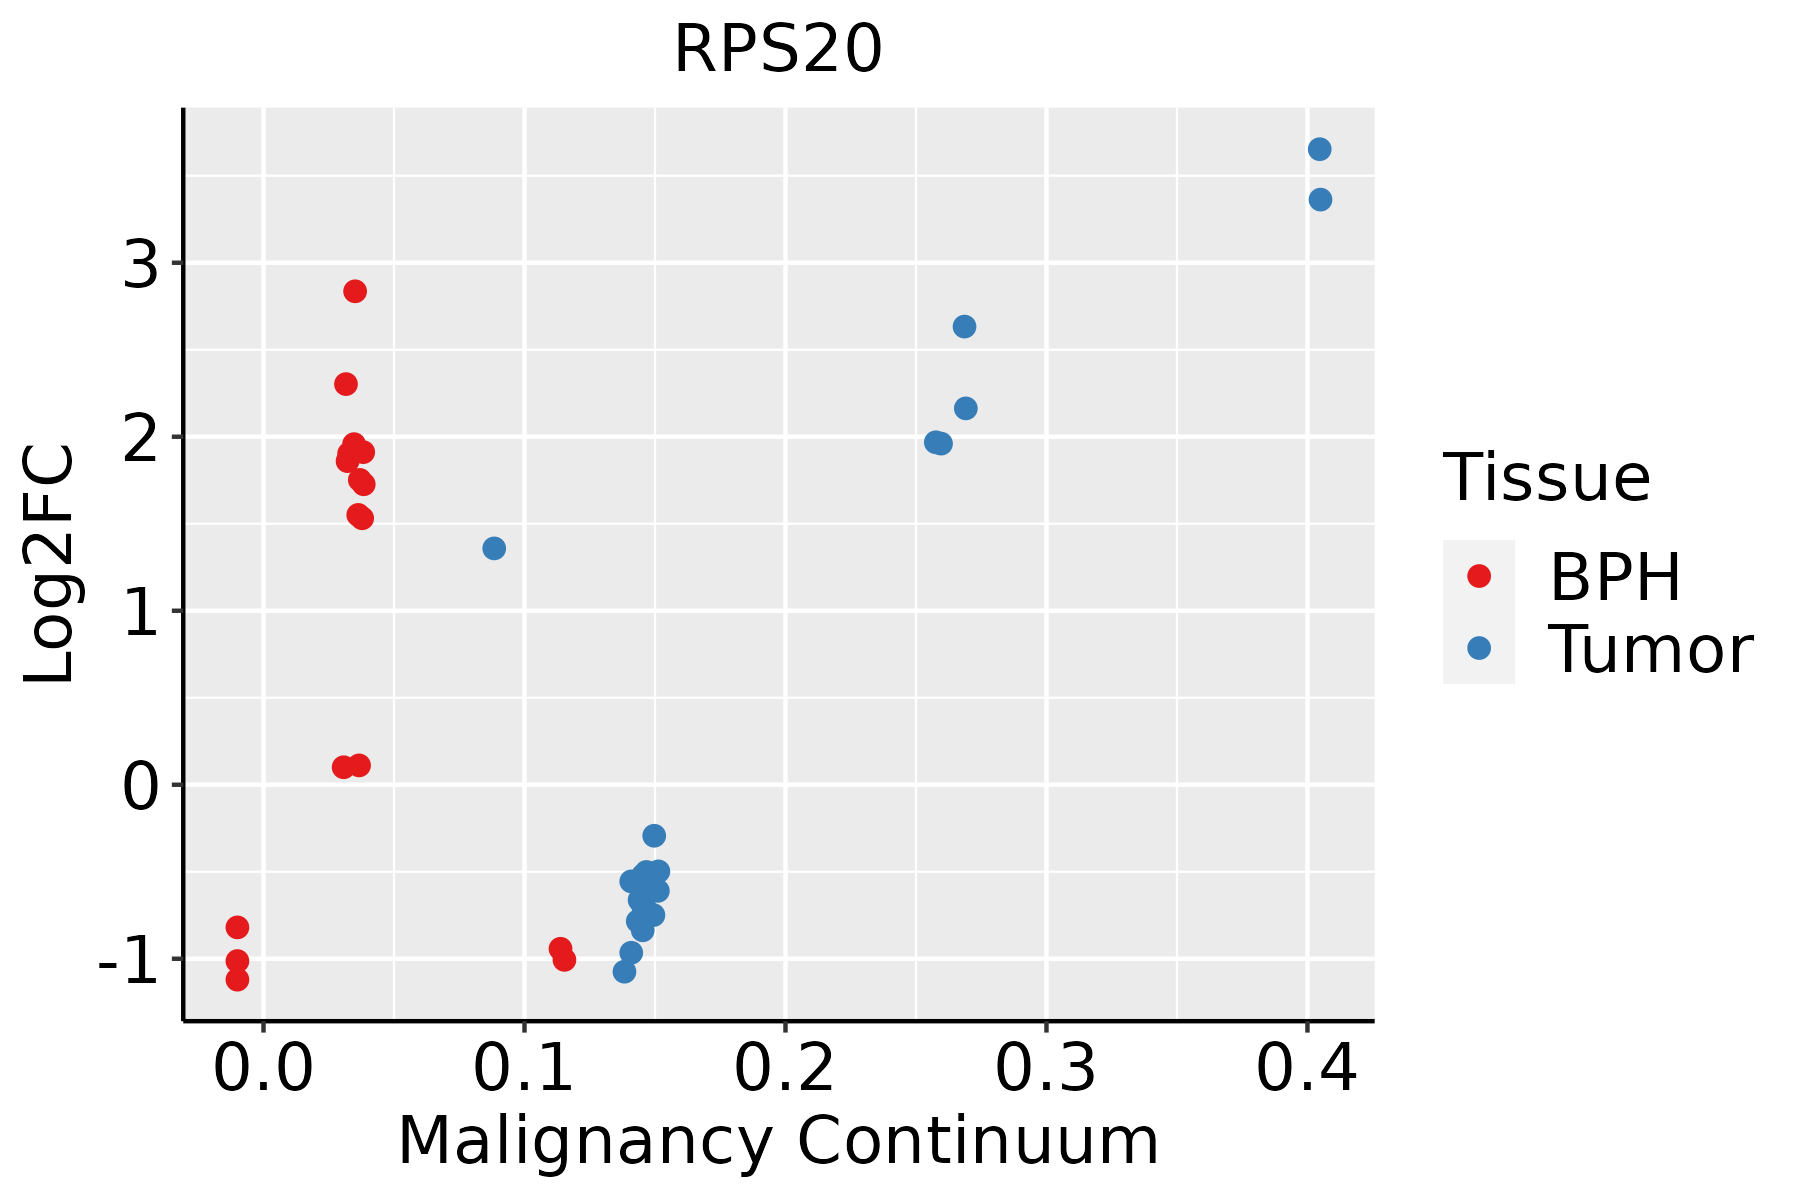 | BPH: Benign Prostatic Hyperplasia |
| Skin | 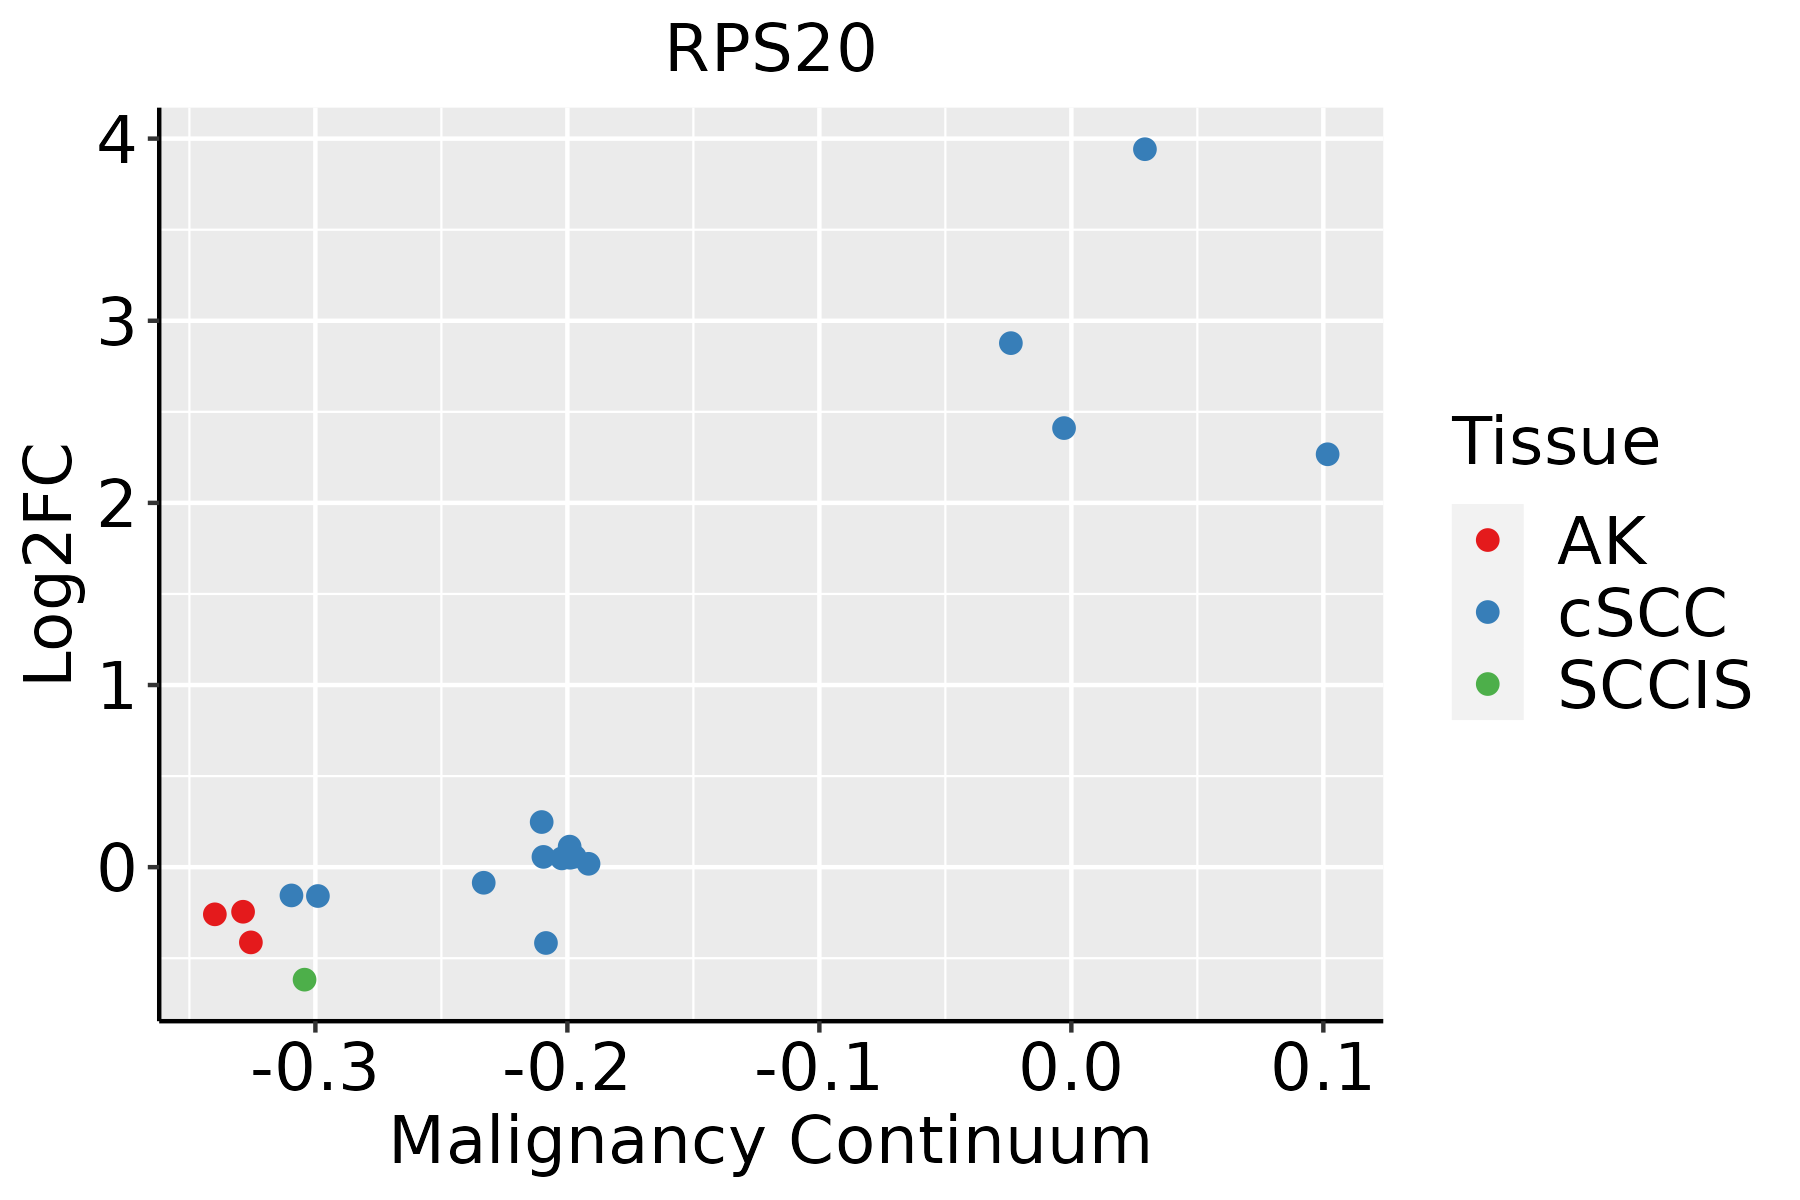 | AK: Actinic keratosis |
| cSCC: Cutaneous squamous cell carcinoma |
| SCCIS:squamous cell carcinoma in situ |
| Thyroid | 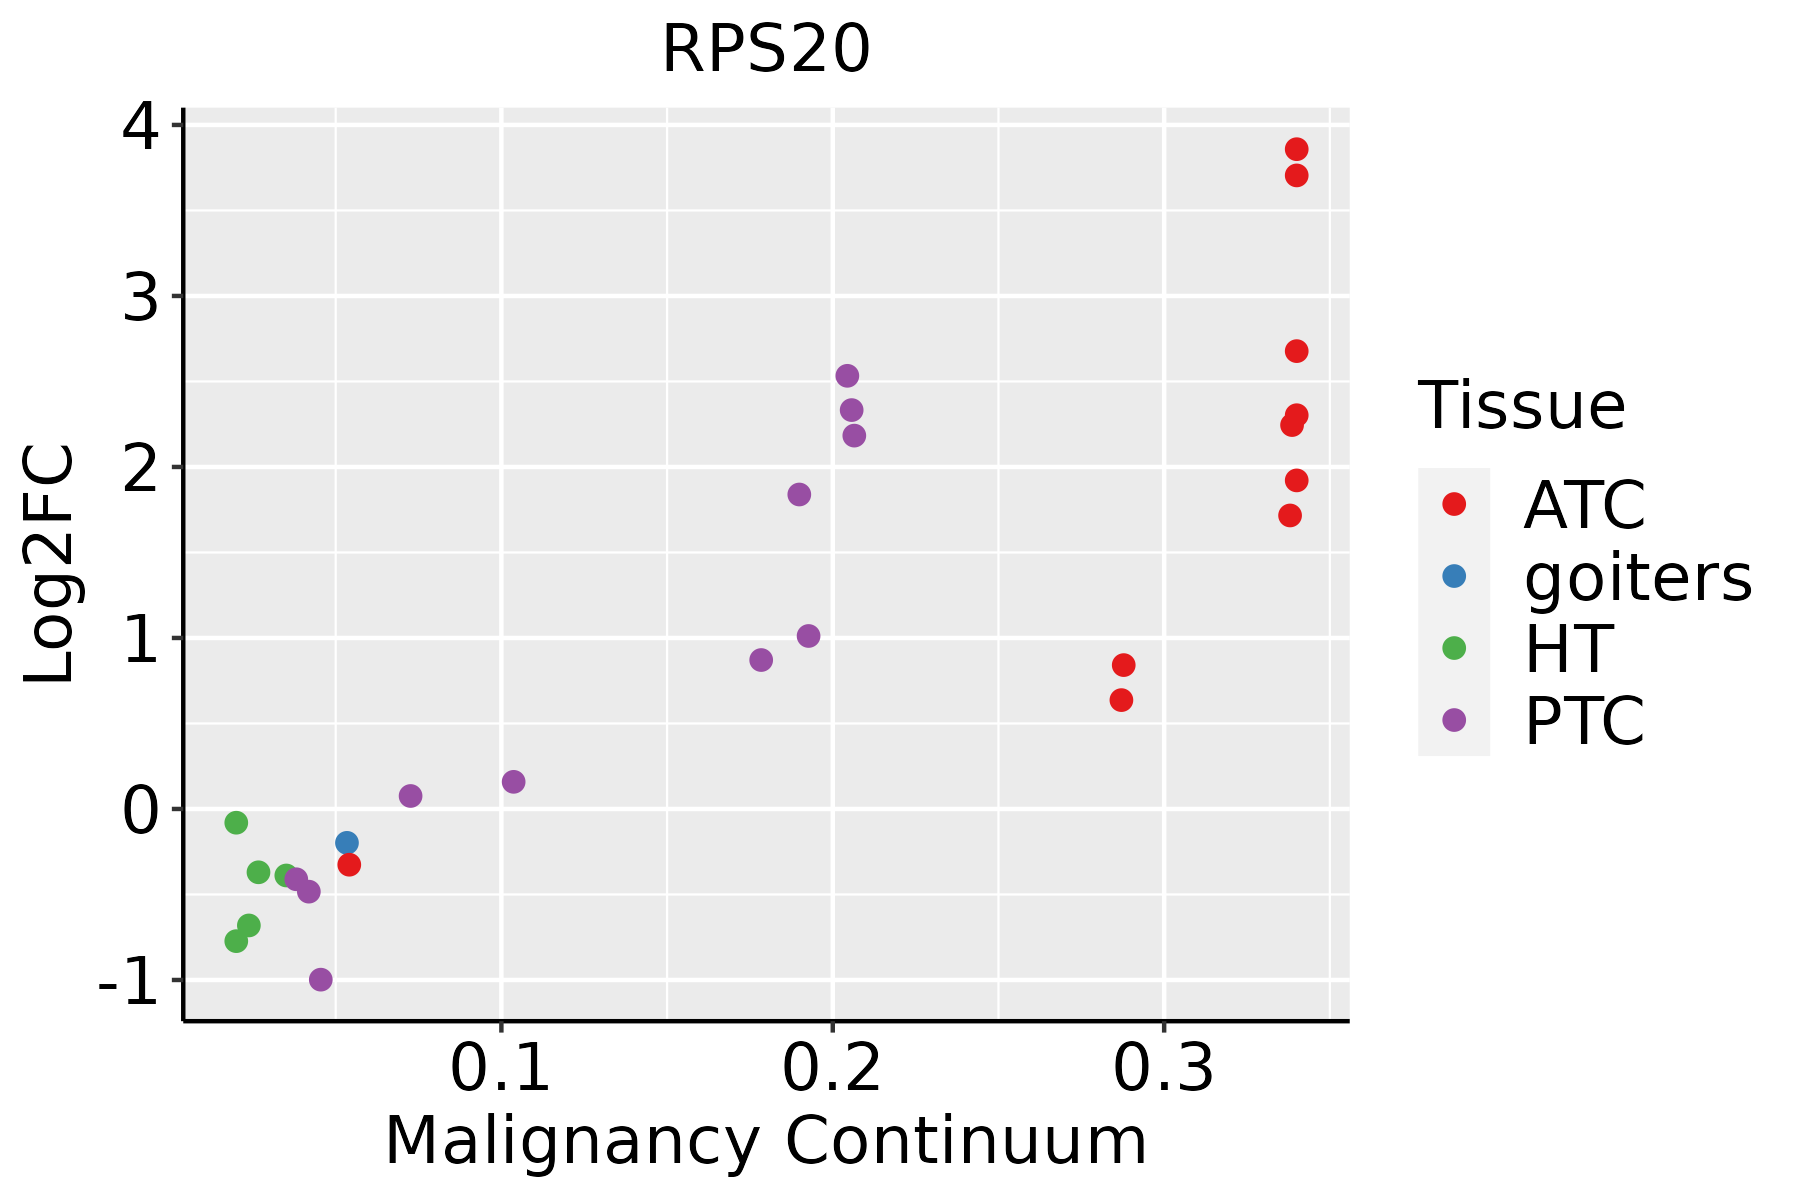 | ATC: Anaplastic thyroid cancer |
| HT: Hashimoto's thyroiditis |
| PTC: Papillary thyroid cancer |
| GO ID | Tissue | Disease Stage | Description | Gene Ratio | Bg Ratio | pvalue | p.adjust | Count |
| GO:190332016 | Endometrium | AEH | regulation of protein modification by small protein conjugation or removal | 67/2100 | 242/18723 | 1.10e-12 | 2.26e-10 | 67 |
| GO:003139616 | Endometrium | AEH | regulation of protein ubiquitination | 57/2100 | 210/18723 | 1.24e-10 | 1.40e-08 | 57 |
| GO:003139716 | Endometrium | AEH | negative regulation of protein ubiquitination | 28/2100 | 83/18723 | 4.36e-08 | 2.40e-06 | 28 |
| GO:190332116 | Endometrium | AEH | negative regulation of protein modification by small protein conjugation or removal | 30/2100 | 95/18723 | 7.94e-08 | 4.04e-06 | 30 |
| GO:190179816 | Endometrium | AEH | positive regulation of signal transduction by p53 class mediator | 11/2100 | 25/18723 | 3.42e-05 | 6.06e-04 | 11 |
| GO:007233116 | Endometrium | AEH | signal transduction by p53 class mediator | 36/2100 | 163/18723 | 4.88e-05 | 7.95e-04 | 36 |
| GO:190179616 | Endometrium | AEH | regulation of signal transduction by p53 class mediator | 24/2100 | 93/18723 | 6.73e-05 | 1.04e-03 | 24 |
| GO:005144416 | Endometrium | AEH | negative regulation of ubiquitin-protein transferase activity | 9/2100 | 19/18723 | 8.91e-05 | 1.30e-03 | 9 |
| GO:190466716 | Endometrium | AEH | negative regulation of ubiquitin protein ligase activity | 7/2100 | 12/18723 | 1.05e-04 | 1.51e-03 | 7 |
| GO:005134816 | Endometrium | AEH | negative regulation of transferase activity | 51/2100 | 268/18723 | 1.06e-04 | 1.52e-03 | 51 |
| GO:190466610 | Endometrium | AEH | regulation of ubiquitin protein ligase activity | 9/2100 | 23/18723 | 5.19e-04 | 5.27e-03 | 9 |
| GO:00514388 | Endometrium | AEH | regulation of ubiquitin-protein transferase activity | 15/2100 | 53/18723 | 5.25e-04 | 5.31e-03 | 15 |
| GO:000218117 | Endometrium | EEC | cytoplasmic translation | 104/2168 | 148/18723 | 2.53e-63 | 1.52e-59 | 104 |
| GO:190332017 | Endometrium | EEC | regulation of protein modification by small protein conjugation or removal | 72/2168 | 242/18723 | 1.45e-14 | 4.36e-12 | 72 |
| GO:003139617 | Endometrium | EEC | regulation of protein ubiquitination | 62/2168 | 210/18723 | 1.42e-12 | 2.76e-10 | 62 |
| GO:003139717 | Endometrium | EEC | negative regulation of protein ubiquitination | 31/2168 | 83/18723 | 1.05e-09 | 9.13e-08 | 31 |
| GO:190332117 | Endometrium | EEC | negative regulation of protein modification by small protein conjugation or removal | 33/2168 | 95/18723 | 2.68e-09 | 2.01e-07 | 33 |
| GO:190179617 | Endometrium | EEC | regulation of signal transduction by p53 class mediator | 27/2168 | 93/18723 | 4.07e-06 | 1.06e-04 | 27 |
| GO:007233117 | Endometrium | EEC | signal transduction by p53 class mediator | 39/2168 | 163/18723 | 7.00e-06 | 1.63e-04 | 39 |
| GO:190179817 | Endometrium | EEC | positive regulation of signal transduction by p53 class mediator | 11/2168 | 25/18723 | 4.62e-05 | 7.45e-04 | 11 |
| Pathway ID | Tissue | Disease Stage | Description | Gene Ratio | Bg Ratio | pvalue | p.adjust | qvalue | Count |
| hsa0301018 | Breast | Precancer | Ribosome | 80/684 | 167/8465 | 7.33e-44 | 2.32e-41 | 1.77e-41 | 80 |
| hsa0517118 | Breast | Precancer | Coronavirus disease - COVID-19 | 81/684 | 232/8465 | 3.74e-32 | 2.36e-30 | 1.81e-30 | 81 |
| hsa0301019 | Breast | Precancer | Ribosome | 80/684 | 167/8465 | 7.33e-44 | 2.32e-41 | 1.77e-41 | 80 |
| hsa0517119 | Breast | Precancer | Coronavirus disease - COVID-19 | 81/684 | 232/8465 | 3.74e-32 | 2.36e-30 | 1.81e-30 | 81 |
| hsa0301024 | Breast | IDC | Ribosome | 83/867 | 167/8465 | 6.07e-39 | 9.87e-37 | 7.38e-37 | 83 |
| hsa0517124 | Breast | IDC | Coronavirus disease - COVID-19 | 86/867 | 232/8465 | 1.50e-28 | 9.72e-27 | 7.27e-27 | 86 |
| hsa0301034 | Breast | IDC | Ribosome | 83/867 | 167/8465 | 6.07e-39 | 9.87e-37 | 7.38e-37 | 83 |
| hsa0517134 | Breast | IDC | Coronavirus disease - COVID-19 | 86/867 | 232/8465 | 1.50e-28 | 9.72e-27 | 7.27e-27 | 86 |
| hsa0301044 | Breast | DCIS | Ribosome | 82/846 | 167/8465 | 8.69e-39 | 1.40e-36 | 1.03e-36 | 82 |
| hsa0517144 | Breast | DCIS | Coronavirus disease - COVID-19 | 86/846 | 232/8465 | 2.42e-29 | 1.56e-27 | 1.15e-27 | 86 |
| hsa0301054 | Breast | DCIS | Ribosome | 82/846 | 167/8465 | 8.69e-39 | 1.40e-36 | 1.03e-36 | 82 |
| hsa0517154 | Breast | DCIS | Coronavirus disease - COVID-19 | 86/846 | 232/8465 | 2.42e-29 | 1.56e-27 | 1.15e-27 | 86 |
| hsa0517120 | Cervix | CC | Coronavirus disease - COVID-19 | 111/1267 | 232/8465 | 1.82e-33 | 5.90e-31 | 3.49e-31 | 111 |
| hsa0301020 | Cervix | CC | Ribosome | 85/1267 | 167/8465 | 3.17e-28 | 5.14e-26 | 3.04e-26 | 85 |
| hsa05171110 | Cervix | CC | Coronavirus disease - COVID-19 | 111/1267 | 232/8465 | 1.82e-33 | 5.90e-31 | 3.49e-31 | 111 |
| hsa03010110 | Cervix | CC | Ribosome | 85/1267 | 167/8465 | 3.17e-28 | 5.14e-26 | 3.04e-26 | 85 |
| hsa0301025 | Cervix | HSIL_HPV | Ribosome | 80/459 | 167/8465 | 9.61e-58 | 2.82e-55 | 2.28e-55 | 80 |
| hsa0517125 | Cervix | HSIL_HPV | Coronavirus disease - COVID-19 | 91/459 | 232/8465 | 2.14e-56 | 3.13e-54 | 2.53e-54 | 91 |
| hsa0301035 | Cervix | HSIL_HPV | Ribosome | 80/459 | 167/8465 | 9.61e-58 | 2.82e-55 | 2.28e-55 | 80 |
| hsa0517135 | Cervix | HSIL_HPV | Coronavirus disease - COVID-19 | 91/459 | 232/8465 | 2.14e-56 | 3.13e-54 | 2.53e-54 | 91 |
| Hugo Symbol | Variant Class | Variant Classification | dbSNP RS | HGVSc | HGVSp | HGVSp Short | SWISSPROT | BIOTYPE | SIFT | PolyPhen | Tumor Sample Barcode | Tissue | Histology | Sex | Age | Stage | Therapy Types | Drugs | Outcome |
| RPS20 | SNV | Missense_Mutation | | c.40N>A | p.Glu14Lys | p.E14K | P60866 | protein_coding | tolerated(0.08) | benign(0.101) | TCGA-D8-A27G-01 | Breast | breast invasive carcinoma | Female | >=65 | I/II | Unknown | Unknown | SD |
| RPS20 | SNV | Missense_Mutation | | c.235C>T | p.Arg79Cys | p.R79C | P60866 | protein_coding | deleterious(0.04) | benign(0.168) | TCGA-AA-A00N-01 | Colorectum | colon adenocarcinoma | Male | >=65 | I/II | Unknown | Unknown | PD |
| RPS20 | SNV | Missense_Mutation | | c.254N>G | p.His85Arg | p.H85R | P60866 | protein_coding | deleterious(0.01) | probably_damaging(0.991) | TCGA-AP-A0LM-01 | Endometrium | uterine corpus endometrioid carcinoma | Female | <65 | III/IV | Chemotherapy | cisplatin | SD |
| RPS20 | SNV | Missense_Mutation | novel | c.325G>A | p.Gly109Arg | p.G109R | P60866 | protein_coding | deleterious(0.01) | probably_damaging(0.958) | TCGA-AP-A1DV-01 | Endometrium | uterine corpus endometrioid carcinoma | Female | <65 | I/II | Unknown | Unknown | SD |
| RPS20 | SNV | Missense_Mutation | rs371598524 | c.403N>A | p.Glu135Lys | p.E135K | P60866 | protein_coding | deleterious_low_confidence(0.04) | possibly_damaging(0.905) | TCGA-AX-A2HC-01 | Endometrium | uterine corpus endometrioid carcinoma | Female | <65 | III/IV | Chemotherapy | paclitaxel | PD |
| RPS20 | SNV | Missense_Mutation | | c.340G>A | p.Glu114Lys | p.E114K | P60866 | protein_coding | tolerated(0.08) | benign(0.185) | TCGA-B5-A0JY-01 | Endometrium | uterine corpus endometrioid carcinoma | Female | <65 | III/IV | Chemotherapy | doxorubicin | SD |
| RPS20 | SNV | Missense_Mutation | | c.197G>T | p.Arg66Ile | p.R66I | P60866 | protein_coding | deleterious(0) | probably_damaging(0.988) | TCGA-B5-A0JY-01 | Endometrium | uterine corpus endometrioid carcinoma | Female | <65 | III/IV | Chemotherapy | doxorubicin | SD |
| RPS20 | SNV | Missense_Mutation | novel | c.304A>G | p.Thr102Ala | p.T102A | P60866 | protein_coding | deleterious(0.04) | possibly_damaging(0.852) | TCGA-FI-A2D5-01 | Endometrium | uterine corpus endometrioid carcinoma | Female | <65 | III/IV | Chemotherapy | carboplatinum | PD |
| RPS20 | SNV | Missense_Mutation | novel | c.190N>G | p.Thr64Ala | p.T64A | P60866 | protein_coding | deleterious(0.02) | possibly_damaging(0.896) | TCGA-FI-A2F4-01 | Endometrium | uterine corpus endometrioid carcinoma | Female | <65 | I/II | Unknown | Unknown | SD |
| RPS20 | SNV | Missense_Mutation | | c.232N>A | p.Asp78Asn | p.D78N | P60866 | protein_coding | deleterious(0.02) | probably_damaging(0.984) | TCGA-49-AARN-01 | Lung | lung adenocarcinoma | Female | <65 | I/II | Unknown | Unknown | SD |


