
|
|||||
|
 | |
| |
| |
| |
| |
| |
|
Gene: RPL7L1 |
Gene summary for RPL7L1 |
| Gene information | Species | Human | Gene symbol | RPL7L1 | Gene ID | 285855 |
| Gene name | ribosomal protein L7 like 1 | |
| Gene Alias | dJ475N16.4 | |
| Cytomap | 6p21.1 | |
| Gene Type | protein-coding | GO ID | GO:0000463 | UniProtAcc | A0A024RD36 |
Top |
Malignant transformation analysis |
| Identification of the aberrant gene expression in precancerous and cancerous lesions by comparing the gene expression of stem-like cells in diseased tissues with normal stem cells |
| Entrez ID | Symbol | Replicates | Species | Organ | Tissue | Adj P-value | Log2FC | Malignancy |
| 285855 | RPL7L1 | HTA11_1938_2000001011 | Human | Colorectum | AD | 3.19e-09 | 5.62e-01 | -0.0811 |
| 285855 | RPL7L1 | HTA11_78_2000001011 | Human | Colorectum | AD | 3.91e-05 | 3.59e-01 | -0.1088 |
| 285855 | RPL7L1 | HTA11_347_2000001011 | Human | Colorectum | AD | 7.28e-12 | 5.08e-01 | -0.1954 |
| 285855 | RPL7L1 | HTA11_83_2000001011 | Human | Colorectum | SER | 8.26e-08 | 4.90e-01 | -0.1526 |
| 285855 | RPL7L1 | HTA11_696_2000001011 | Human | Colorectum | AD | 2.20e-02 | 3.38e-01 | -0.1464 |
| 285855 | RPL7L1 | HTA11_1391_2000001011 | Human | Colorectum | AD | 6.94e-11 | 5.38e-01 | -0.059 |
| 285855 | RPL7L1 | HTA11_866_3004761011 | Human | Colorectum | AD | 8.85e-03 | 2.82e-01 | 0.096 |
| 285855 | RPL7L1 | HTA11_7663_2000001011 | Human | Colorectum | SER | 1.99e-04 | 5.94e-01 | 0.0131 |
| 285855 | RPL7L1 | HTA11_7696_3000711011 | Human | Colorectum | AD | 7.73e-09 | 4.07e-01 | 0.0674 |
| 285855 | RPL7L1 | HTA11_99999965062_69753 | Human | Colorectum | MSI-H | 7.11e-05 | 1.16e+00 | 0.3487 |
| 285855 | RPL7L1 | HTA11_99999965104_69814 | Human | Colorectum | MSS | 6.57e-15 | 7.82e-01 | 0.281 |
| 285855 | RPL7L1 | HTA11_99999971662_82457 | Human | Colorectum | MSS | 2.70e-17 | 7.04e-01 | 0.3859 |
| 285855 | RPL7L1 | HTA11_99999973899_84307 | Human | Colorectum | MSS | 6.07e-03 | 4.32e-01 | 0.2585 |
| 285855 | RPL7L1 | HTA11_99999974143_84620 | Human | Colorectum | MSS | 1.48e-05 | 3.60e-01 | 0.3005 |
| 285855 | RPL7L1 | A015-C-203 | Human | Colorectum | FAP | 1.38e-03 | -3.24e-02 | -0.1294 |
| 285855 | RPL7L1 | A015-C-104 | Human | Colorectum | FAP | 2.71e-04 | 2.70e-03 | -0.1899 |
| 285855 | RPL7L1 | AEH-subject1 | Human | Endometrium | AEH | 1.79e-22 | -3.74e-01 | -0.3059 |
| 285855 | RPL7L1 | AEH-subject2 | Human | Endometrium | AEH | 4.43e-05 | -2.72e-01 | -0.2525 |
| 285855 | RPL7L1 | AEH-subject3 | Human | Endometrium | AEH | 3.53e-14 | -2.86e-01 | -0.2576 |
| 285855 | RPL7L1 | AEH-subject4 | Human | Endometrium | AEH | 2.35e-07 | -3.31e-01 | -0.2657 |
| Page: 1 2 3 4 5 6 7 8 9 |
| Tissue | Expression Dynamics | Abbreviation |
| Colorectum (GSE201348) |  | FAP: Familial adenomatous polyposis |
| CRC: Colorectal cancer | ||
| Colorectum (HTA11) |  | AD: Adenomas |
| SER: Sessile serrated lesions | ||
| MSI-H: Microsatellite-high colorectal cancer | ||
| MSS: Microsatellite stable colorectal cancer | ||
| Endometrium |  | AEH: Atypical endometrial hyperplasia |
| EEC: Endometrioid Cancer | ||
| Esophagus |  | ESCC: Esophageal squamous cell carcinoma |
| HGIN: High-grade intraepithelial neoplasias | ||
| LGIN: Low-grade intraepithelial neoplasias | ||
| Liver | 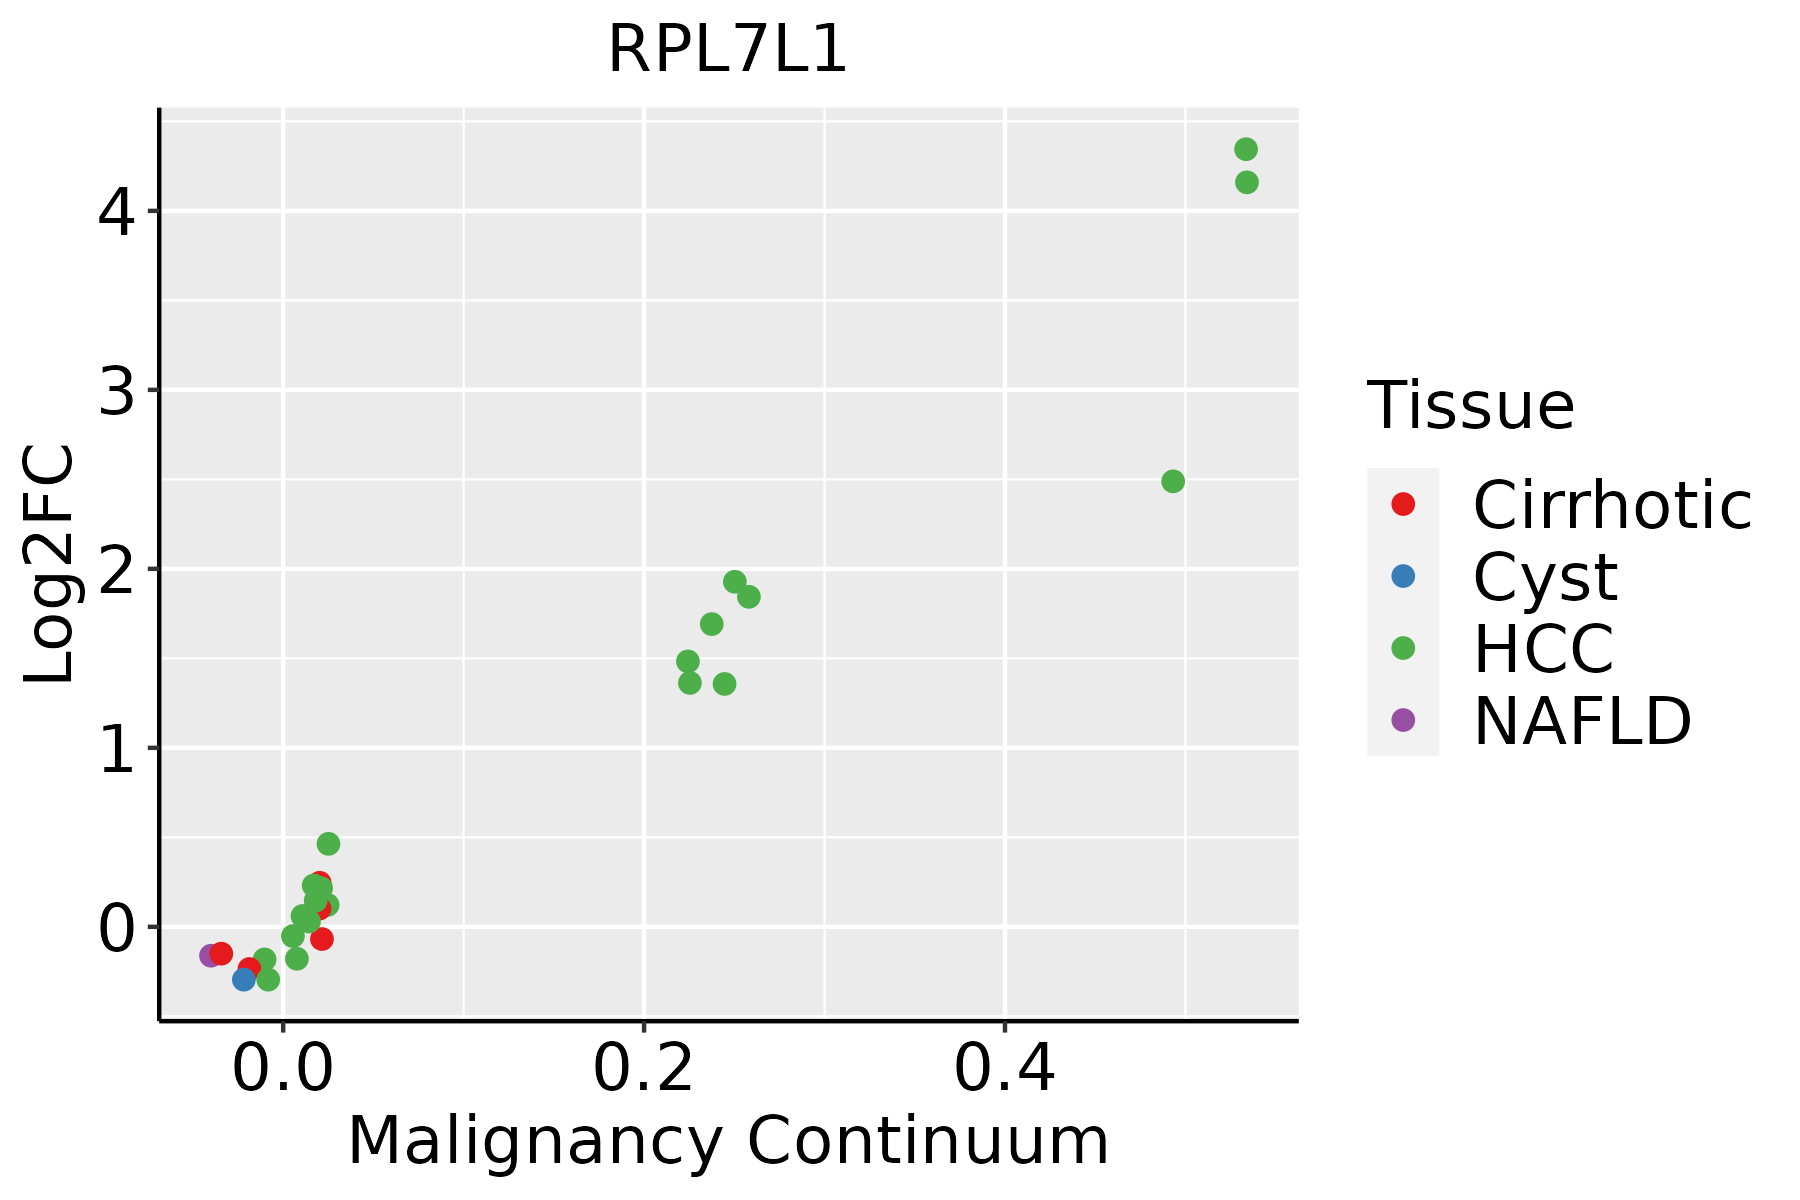 | HCC: Hepatocellular carcinoma |
| NAFLD: Non-alcoholic fatty liver disease | ||
| Oral Cavity | 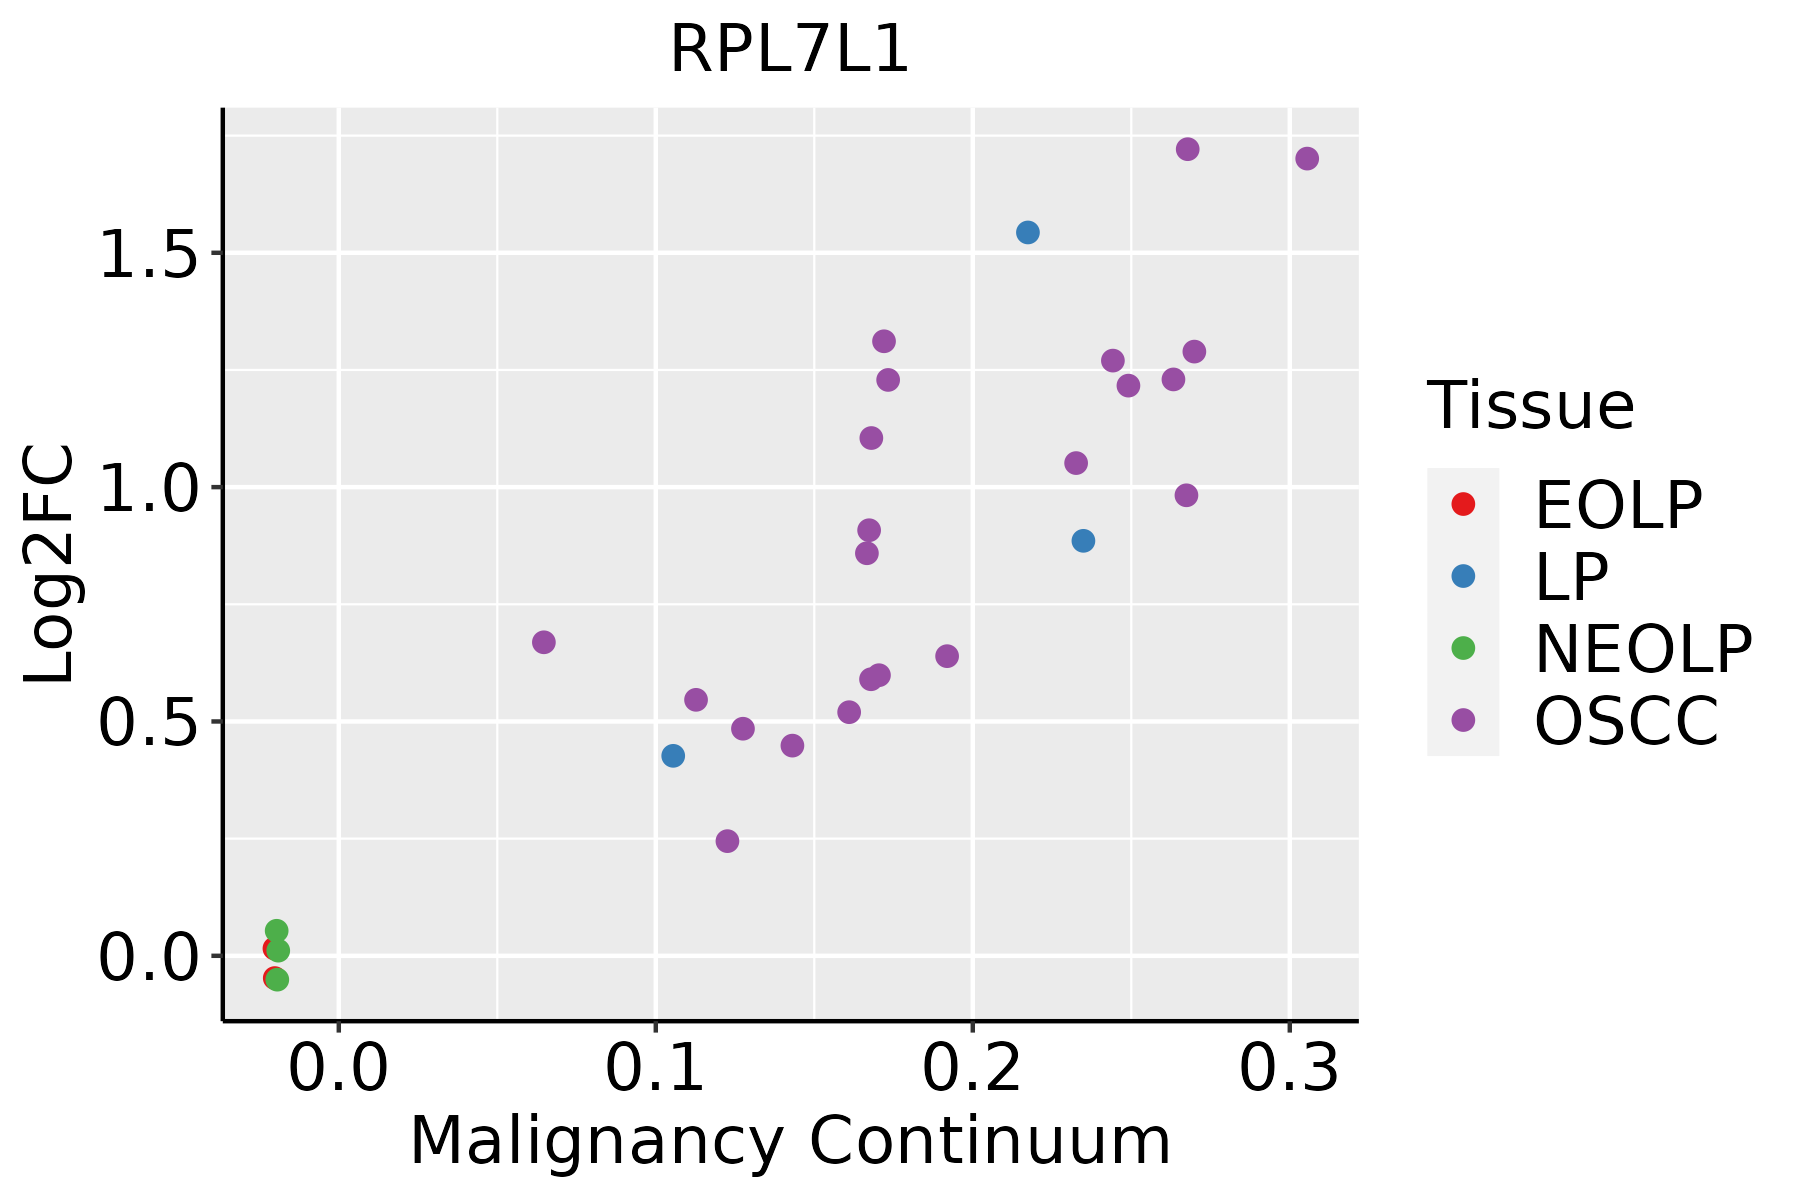 | EOLP: Erosive Oral lichen planus |
| LP: leukoplakia | ||
| NEOLP: Non-erosive oral lichen planus | ||
| OSCC: Oral squamous cell carcinoma | ||
| Prostate | 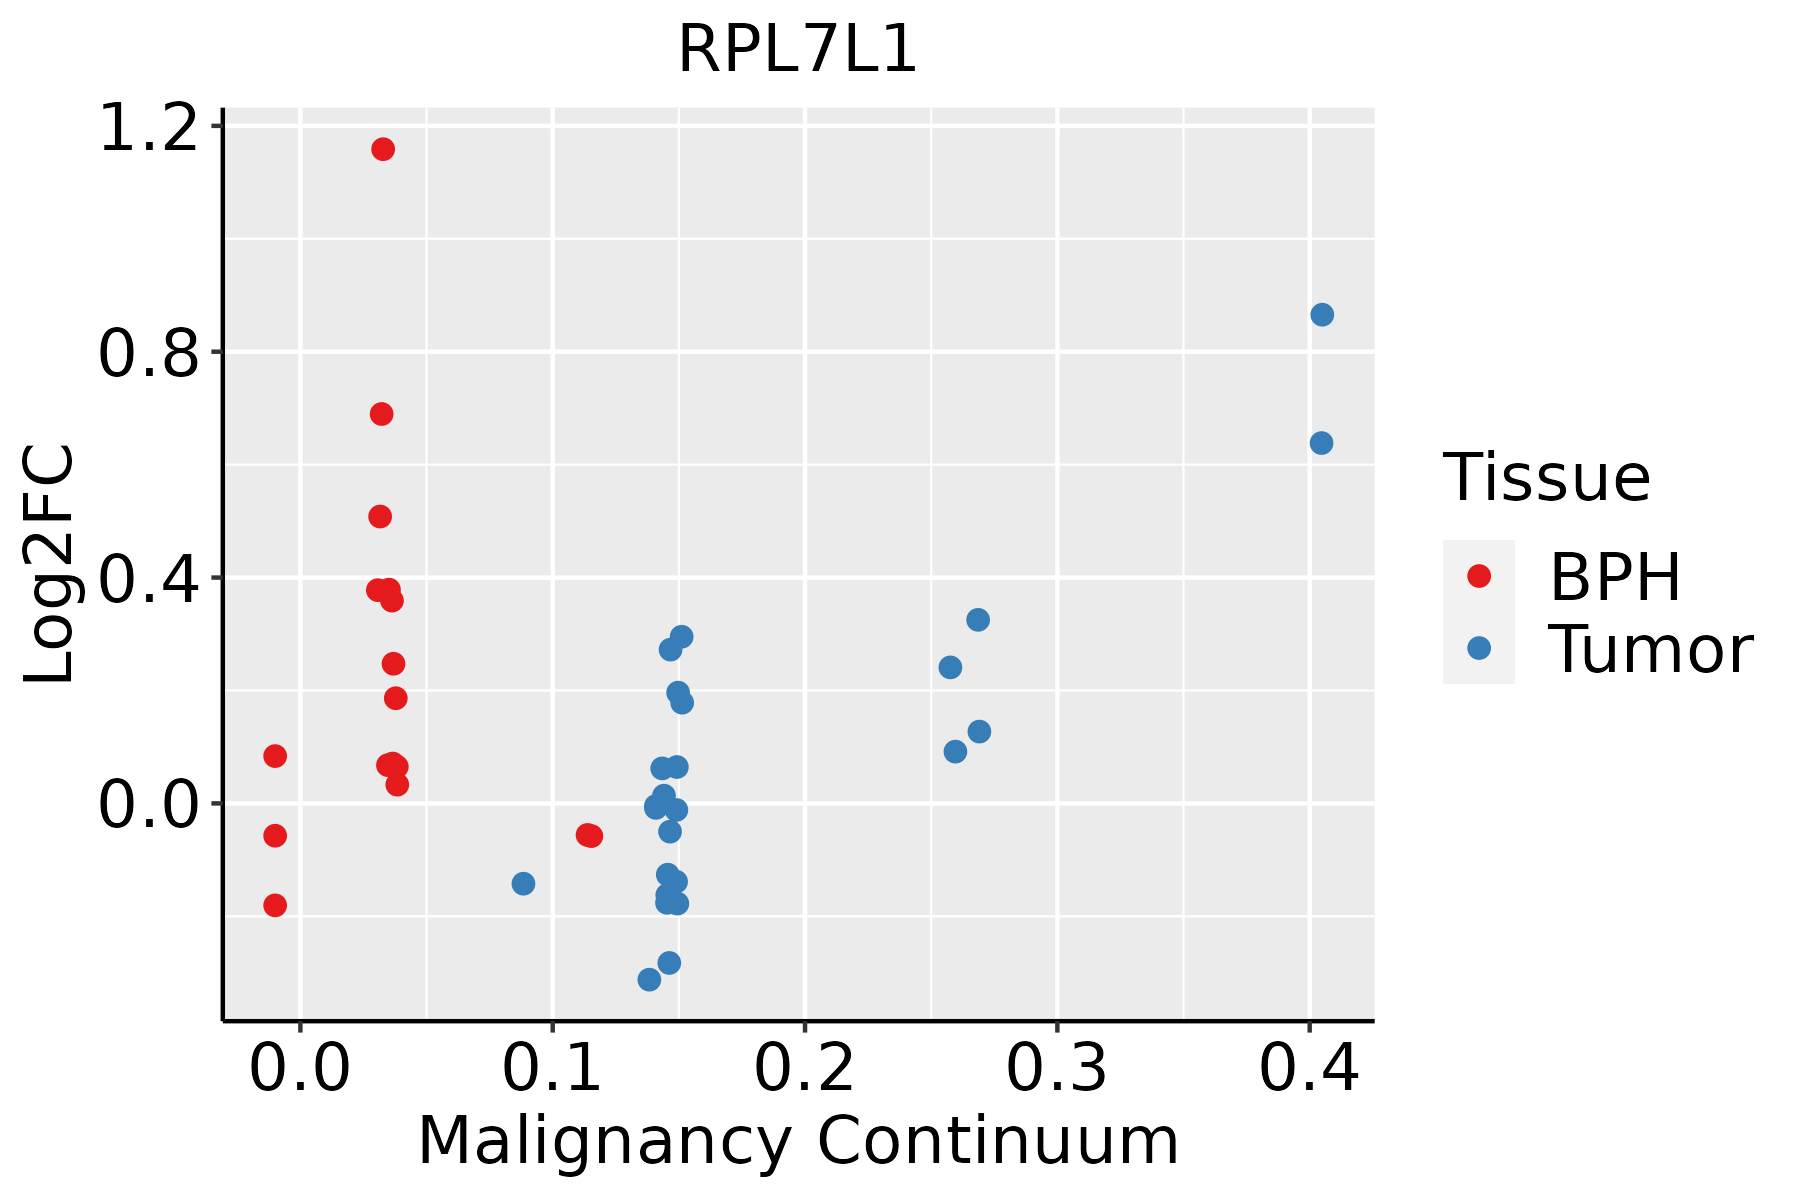 | BPH: Benign Prostatic Hyperplasia |
| Skin |  | AK: Actinic keratosis |
| cSCC: Cutaneous squamous cell carcinoma | ||
| SCCIS:squamous cell carcinoma in situ | ||
| Thyroid | 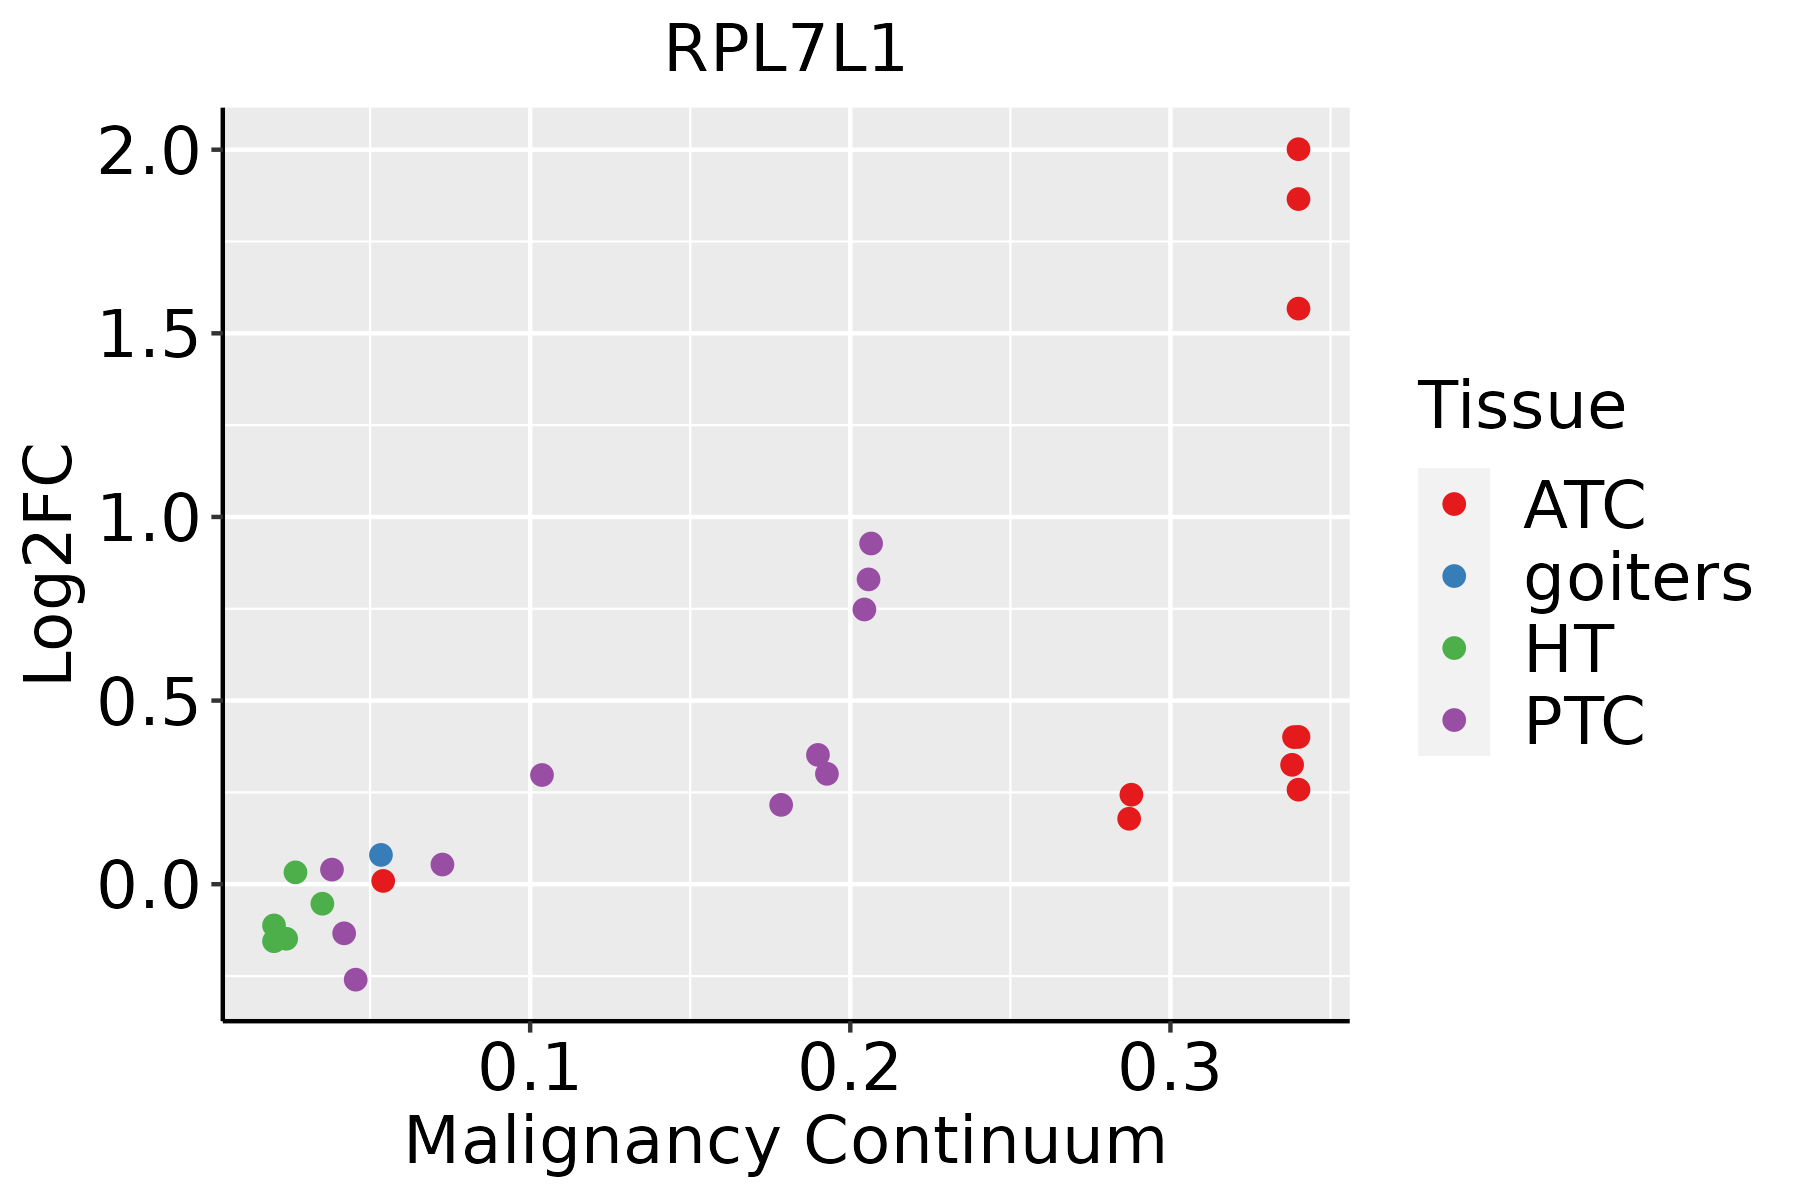 | ATC: Anaplastic thyroid cancer |
| HT: Hashimoto's thyroiditis | ||
| PTC: Papillary thyroid cancer |
| ∗log2FC in expression of this searched gene in stem-like cells from each diseased tissue sample relative to stem-like cells in normal samples in each tissue plotted against the malignancy continuum. Samples are colored based on if they are from different disease stage. |
Top |
Malignant transformation related pathway analysis |
| Find out the enriched GO biological processes and KEGG pathways involved in transition from healthy to precancer to cancer |
| Tissue | Disease Stage | Enriched GO biological Processes |
| Colorectum | AD |  |
| Colorectum | SER |  |
| Colorectum | MSS |  |
| Colorectum | MSI-H |  |
| Colorectum | FAP |  |
| ∗Top 15 enriched GO BP terms are showed in the bar plot of each disease state in each tissue. Each row represents a significant GO biological process which is colored according to the -log10(p.adjust). |
| Page: 1 2 3 4 5 6 7 8 9 |
| GO ID | Tissue | Disease Stage | Description | Gene Ratio | Bg Ratio | pvalue | p.adjust | Count |
| GO:000182512 | Skin | cSCC | blastocyst formation | 21/4864 | 38/18723 | 1.17e-04 | 1.08e-03 | 21 |
| GO:00004635 | Skin | cSCC | maturation of LSU-rRNA from tricistronic rRNA transcript (SSU-rRNA, 5.8S rRNA, LSU-rRNA) | 11/4864 | 15/18723 | 1.67e-04 | 1.45e-03 | 11 |
| GO:0022613113 | Thyroid | PTC | ribonucleoprotein complex biogenesis | 292/5968 | 463/18723 | 3.24e-44 | 2.05e-40 | 292 |
| GO:0042254113 | Thyroid | PTC | ribosome biogenesis | 202/5968 | 299/18723 | 3.47e-37 | 5.47e-34 | 202 |
| GO:0006364112 | Thyroid | PTC | rRNA processing | 156/5968 | 225/18723 | 5.58e-31 | 5.03e-28 | 156 |
| GO:0016072112 | Thyroid | PTC | rRNA metabolic process | 160/5968 | 236/18723 | 5.68e-30 | 3.58e-27 | 160 |
| GO:003447018 | Thyroid | PTC | ncRNA processing | 215/5968 | 395/18723 | 7.14e-21 | 1.22e-18 | 215 |
| GO:0042273113 | Thyroid | PTC | ribosomal large subunit biogenesis | 57/5968 | 72/18723 | 1.79e-16 | 1.51e-14 | 57 |
| GO:00346608 | Thyroid | PTC | ncRNA metabolic process | 239/5968 | 485/18723 | 5.54e-16 | 4.26e-14 | 239 |
| GO:0001701111 | Thyroid | PTC | in utero embryonic development | 175/5968 | 367/18723 | 1.40e-10 | 4.73e-09 | 175 |
| GO:00004709 | Thyroid | PTC | maturation of LSU-rRNA | 23/5968 | 28/18723 | 5.91e-08 | 1.25e-06 | 23 |
| GO:00004636 | Thyroid | PTC | maturation of LSU-rRNA from tricistronic rRNA transcript (SSU-rRNA, 5.8S rRNA, LSU-rRNA) | 12/5968 | 15/18723 | 1.75e-04 | 1.33e-03 | 12 |
| GO:000182513 | Thyroid | PTC | blastocyst formation | 22/5968 | 38/18723 | 8.19e-04 | 5.07e-03 | 22 |
| GO:00018246 | Thyroid | PTC | blastocyst development | 49/5968 | 106/18723 | 1.37e-03 | 7.72e-03 | 49 |
| GO:002261334 | Thyroid | ATC | ribonucleoprotein complex biogenesis | 292/6293 | 463/18723 | 3.05e-39 | 9.63e-36 | 292 |
| GO:004225434 | Thyroid | ATC | ribosome biogenesis | 203/6293 | 299/18723 | 3.63e-34 | 4.59e-31 | 203 |
| GO:000636432 | Thyroid | ATC | rRNA processing | 157/6293 | 225/18723 | 9.02e-29 | 5.70e-26 | 157 |
| GO:001607232 | Thyroid | ATC | rRNA metabolic process | 161/6293 | 236/18723 | 1.02e-27 | 5.89e-25 | 161 |
| GO:003447021 | Thyroid | ATC | ncRNA processing | 216/6293 | 395/18723 | 3.14e-18 | 3.98e-16 | 216 |
| GO:004227335 | Thyroid | ATC | ribosomal large subunit biogenesis | 57/6293 | 72/18723 | 2.56e-15 | 1.82e-13 | 57 |
| Page: 1 2 3 4 5 6 7 8 9 |
| Pathway ID | Tissue | Disease Stage | Description | Gene Ratio | Bg Ratio | pvalue | p.adjust | qvalue | Count |
| Page: 1 |
Top |
Cell-cell communication analysis |
| Identification of potential cell-cell interactions between two cell types and their ligand-receptor pairs for different disease states |
| Ligand | Receptor | LRpair | Pathway | Tissue | Disease Stage |
| Page: 1 |
Top |
Single-cell gene regulatory network inference analysis |
| Find out the significant the regulons (TFs) and the target genes of each regulon across cell types for different disease states |
| TF | Cell Type | Tissue | Disease Stage | Target Gene | RSS | Regulon Activity |
| ∗The dot plots of a searched regulon are shown for all cell subpopulations in each disease state of each tissue based on the regulon specific score inferred using pySCENIC and by calculating the average expression. |
| Page: 1 |
Top |
Somatic mutation of malignant transformation related genes |
| Annotation of somatic variants for genes involved in malignant transformation |
| Hugo Symbol | Variant Class | Variant Classification | dbSNP RS | HGVSc | HGVSp | HGVSp Short | SWISSPROT | BIOTYPE | SIFT | PolyPhen | Tumor Sample Barcode | Tissue | Histology | Sex | Age | Stage | Therapy Types | Drugs | Outcome |
| RPL7L1 | SNV | Missense_Mutation | c.341G>T | p.Arg114Ile | p.R114I | Q6DKI1 | protein_coding | deleterious(0) | possibly_damaging(0.495) | TCGA-IR-A3LA-01 | Cervix | cervical & endocervical cancer | Female | <65 | I/II | Chemotherapy | cisplatin | CR | |
| RPL7L1 | SNV | Missense_Mutation | c.494G>C | p.Gly165Ala | p.G165A | Q6DKI1 | protein_coding | deleterious(0.01) | possibly_damaging(0.782) | TCGA-JX-A3Q0-01 | Cervix | cervical & endocervical cancer | Female | <65 | III/IV | Unknown | Unknown | SD | |
| RPL7L1 | SNV | Missense_Mutation | novel | c.270N>C | p.Leu90Phe | p.L90F | Q6DKI1 | protein_coding | deleterious(0.04) | benign(0.361) | TCGA-VS-A94Z-01 | Cervix | cervical & endocervical cancer | Female | <65 | I/II | Chemotherapy | cisplatin | CR |
| RPL7L1 | SNV | Missense_Mutation | novel | c.372N>G | p.Ile124Met | p.I124M | Q6DKI1 | protein_coding | deleterious(0.02) | benign(0.277) | TCGA-AA-3984-01 | Colorectum | colon adenocarcinoma | Female | <65 | I/II | Unknown | Unknown | SD |
| RPL7L1 | SNV | Missense_Mutation | novel | c.230G>C | p.Arg77Pro | p.R77P | Q6DKI1 | protein_coding | deleterious(0.01) | possibly_damaging(0.809) | TCGA-AM-5820-01 | Colorectum | colon adenocarcinoma | Female | <65 | I/II | Unknown | Unknown | SD |
| RPL7L1 | SNV | Missense_Mutation | rs377107940 | c.422N>A | p.Arg141His | p.R141H | Q6DKI1 | protein_coding | tolerated(0.06) | benign(0.021) | TCGA-AZ-4313-01 | Colorectum | colon adenocarcinoma | Female | <65 | I/II | Unknown | Unknown | SD |
| RPL7L1 | insertion | Frame_Shift_Ins | novel | c.397_398insC | p.Gln135ProfsTer38 | p.Q135Pfs*38 | Q6DKI1 | protein_coding | TCGA-AA-3877-01 | Colorectum | colon adenocarcinoma | Female | >=65 | I/II | Unknown | Unknown | SD | ||
| RPL7L1 | deletion | Frame_Shift_Del | novel | c.233delT | p.Leu78ProfsTer4 | p.L78Pfs*4 | Q6DKI1 | protein_coding | TCGA-AM-5820-01 | Colorectum | colon adenocarcinoma | Female | <65 | I/II | Unknown | Unknown | SD | ||
| RPL7L1 | SNV | Missense_Mutation | rs191520270 | c.301N>T | p.Arg101Cys | p.R101C | Q6DKI1 | protein_coding | tolerated(0.06) | benign(0.031) | TCGA-A5-A0G2-01 | Endometrium | uterine corpus endometrioid carcinoma | Female | <65 | III/IV | Unknown | Unknown | SD |
| RPL7L1 | SNV | Missense_Mutation | c.630N>C | p.Glu210Asp | p.E210D | Q6DKI1 | protein_coding | tolerated(0.09) | benign(0.005) | TCGA-AJ-A3BD-01 | Endometrium | uterine corpus endometrioid carcinoma | Female | <65 | III/IV | Chemotherapy | carboplatin | CR |
| Page: 1 2 |
Top |
Related drugs of malignant transformation related genes |
| Identification of chemicals and drugs interact with genes involved in malignant transfromation |
| (DGIdb 4.0) |
| Entrez ID | Symbol | Category | Interaction Types | Drug Claim Name | Drug Name | PMIDs |
| Page: 1 |

Copyright 2023-Present -The University of Texas Health Science Center at Houston |