Schematic overview of the cellular and molecular mechanisms involved in the cancer progression, including the proposed cellular and molecular mechanisms in cancer cells trajectory. AT1: alveolar type 1 cells; AT2: alveolar type 2 cells; AAH: atypical adenomatous hyperplasia; AIS: adenocarcinoma in situ; MIA: minimally invasive adenocarcinoma; IA: invasive adenocarcinoma; EMT: epithelial-mesenchymal transition

Home

Download

Statistics

Help

Contact

Center for Computational Systems Medicine
leaf

Gene summary

leaf

Malignant transformation analysis

leaf

Malignant transformation related pathway analysis

leaf

Cell-cell communication analysis

leaf

Single-cell gene regulatory network inference analysis

leaf

Somatic mutation of malignant transformation related genes

leaf

Related drugs of malignant transformation related genes

Gene: RNF40

Gene summary for RNF40

check button Gene summary.

Gene informationSpeciesHuman
Gene symbol

RNF40

Gene ID

9810

Gene namering finger protein 40
Gene AliasBRE1B
Cytomap16p11.2
Gene Typeprotein-coding
GO ID

GO:0000209

UniProtAcc

A8K6K1


Top

Malignant transformation analysis

check button Identification of the aberrant gene expression in precancerous and cancerous lesions by comparing the gene expression of stem-like cells in diseased tissues with normal stem cells
check button Malignant transformation involving gene list.
Entrez IDSymbolReplicatesSpeciesOrganTissueAdj P-valueLog2FCMalignancy
9810RNF40LZE2THumanEsophagusESCC5.07e-033.92e-010.082
9810RNF40LZE4THumanEsophagusESCC2.20e-091.97e-010.0811
9810RNF40LZE7THumanEsophagusESCC9.74e-104.62e-010.0667
9810RNF40LZE8THumanEsophagusESCC2.10e-102.83e-010.067
9810RNF40LZE20THumanEsophagusESCC5.29e-041.34e-010.0662
9810RNF40LZE22D1HumanEsophagusHGIN2.88e-028.90e-020.0595
9810RNF40LZE22THumanEsophagusESCC2.43e-042.62e-010.068
9810RNF40LZE24THumanEsophagusESCC5.49e-359.65e-010.0596
9810RNF40LZE21THumanEsophagusESCC5.07e-042.70e-010.0655
9810RNF40LZE6THumanEsophagusESCC2.88e-051.77e-010.0845
9810RNF40P1T-EHumanEsophagusESCC1.44e-165.40e-010.0875
9810RNF40P2T-EHumanEsophagusESCC4.83e-387.07e-010.1177
9810RNF40P4T-EHumanEsophagusESCC6.65e-214.18e-010.1323
9810RNF40P5T-EHumanEsophagusESCC9.89e-161.88e-010.1327
9810RNF40P8T-EHumanEsophagusESCC6.92e-224.55e-010.0889
9810RNF40P9T-EHumanEsophagusESCC3.22e-122.47e-010.1131
9810RNF40P10T-EHumanEsophagusESCC6.13e-161.95e-010.116
9810RNF40P11T-EHumanEsophagusESCC5.15e-196.53e-010.1426
9810RNF40P12T-EHumanEsophagusESCC5.30e-346.67e-010.1122
9810RNF40P15T-EHumanEsophagusESCC1.21e-315.18e-010.1149
Page: 1 2 3 4 5 

check button Transcriptomic changes along malignancy continuum.
TissueExpression DynamicsAbbreviation
EsophagusThe image shows the transcriptomic changes along malignancy continuum.log2FC in expression of this searched gene in stem-like cells from each diseased tissue sample relative to stem-like cells in normal samples in each tissue plotted against the malignancy continuum. Samples are colored based on if they are from different disease stage.
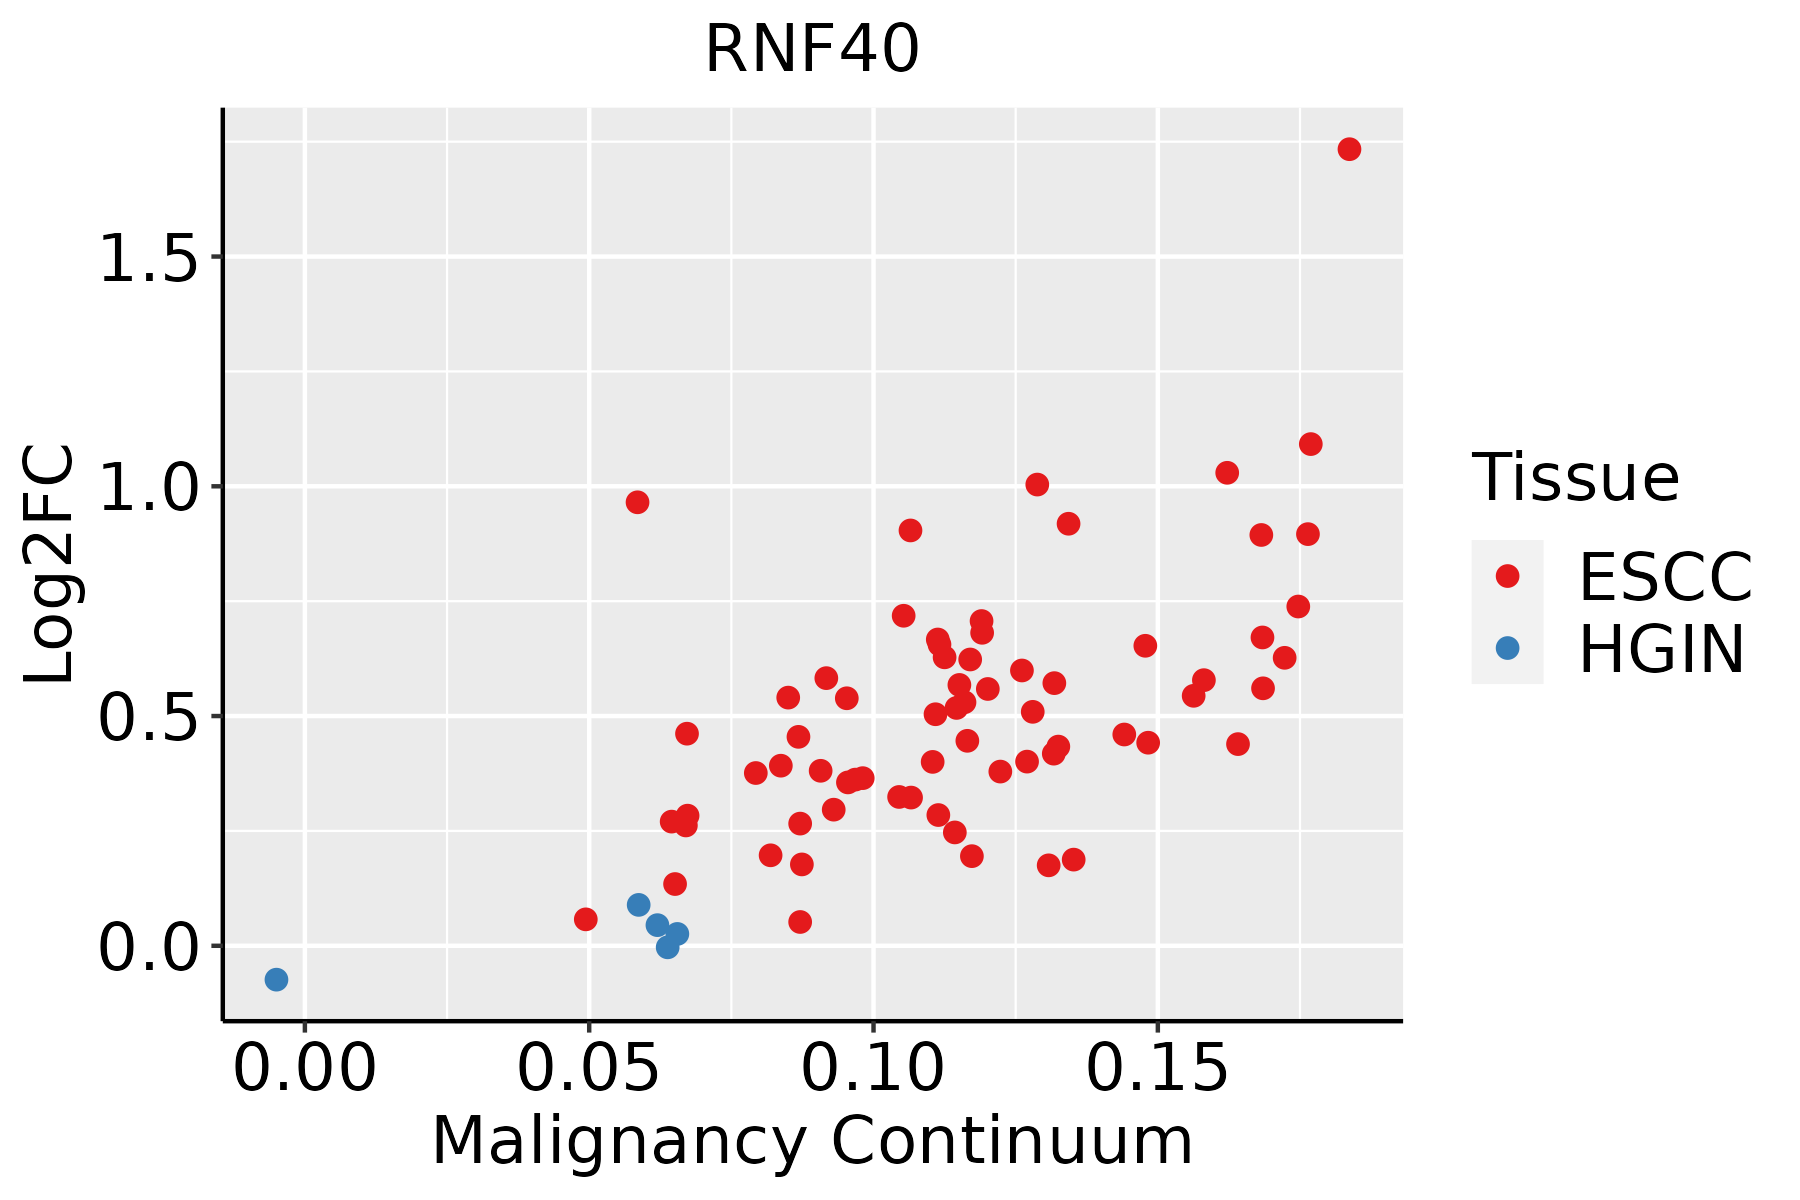
ESCC: Esophageal squamous cell carcinoma
HGIN: High-grade intraepithelial neoplasias
LGIN: Low-grade intraepithelial neoplasias
LiverThe image shows the transcriptomic changes along malignancy continuum.log2FC in expression of this searched gene in stem-like cells from each diseased tissue sample relative to stem-like cells in normal samples in each tissue plotted against the malignancy continuum. Samples are colored based on if they are from different disease stage.HCC: Hepatocellular carcinoma
NAFLD: Non-alcoholic fatty liver disease
Oral CavityThe image shows the transcriptomic changes along malignancy continuum.log2FC in expression of this searched gene in stem-like cells from each diseased tissue sample relative to stem-like cells in normal samples in each tissue plotted against the malignancy continuum. Samples are colored based on if they are from different disease stage.
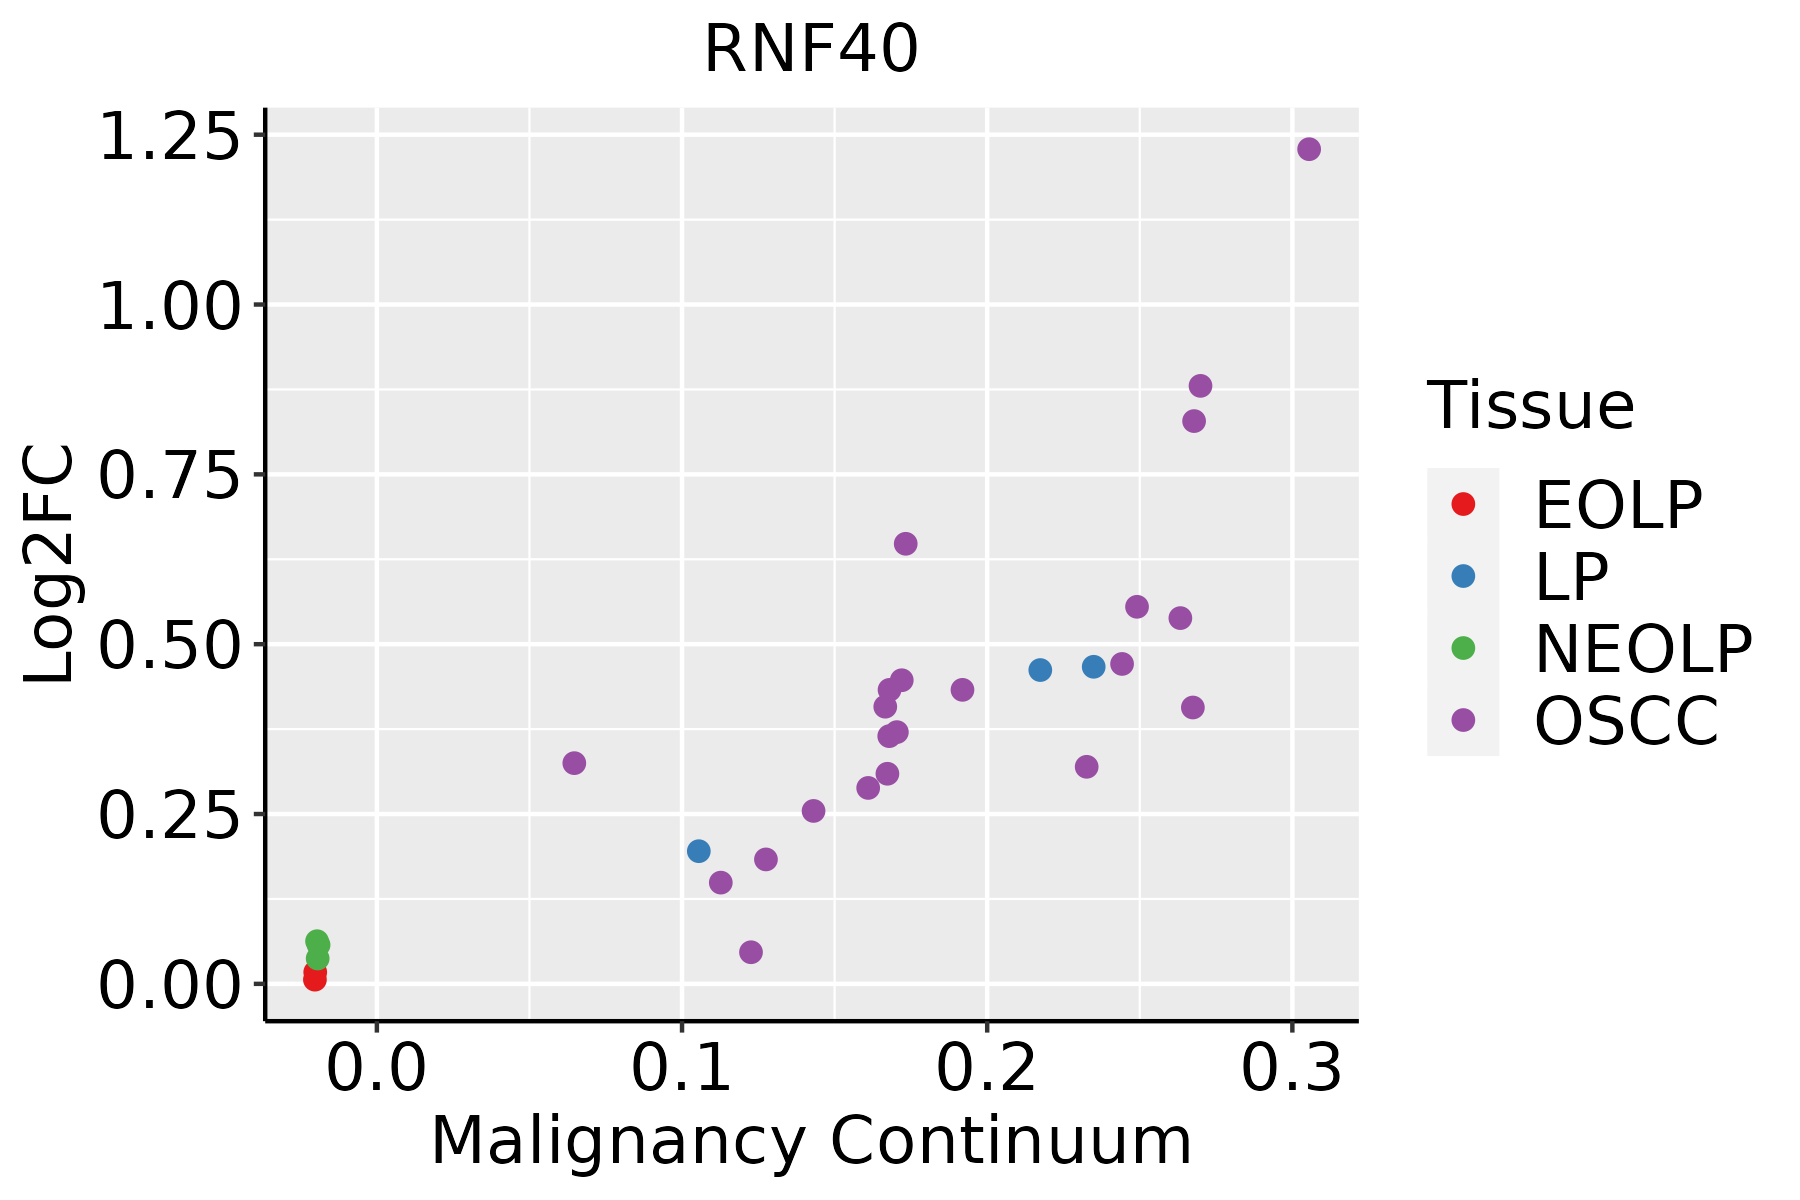
EOLP: Erosive Oral lichen planus
LP: leukoplakia
NEOLP: Non-erosive oral lichen planus
OSCC: Oral squamous cell carcinoma
SkinThe image shows the transcriptomic changes along malignancy continuum.log2FC in expression of this searched gene in stem-like cells from each diseased tissue sample relative to stem-like cells in normal samples in each tissue plotted against the malignancy continuum. Samples are colored based on if they are from different disease stage.
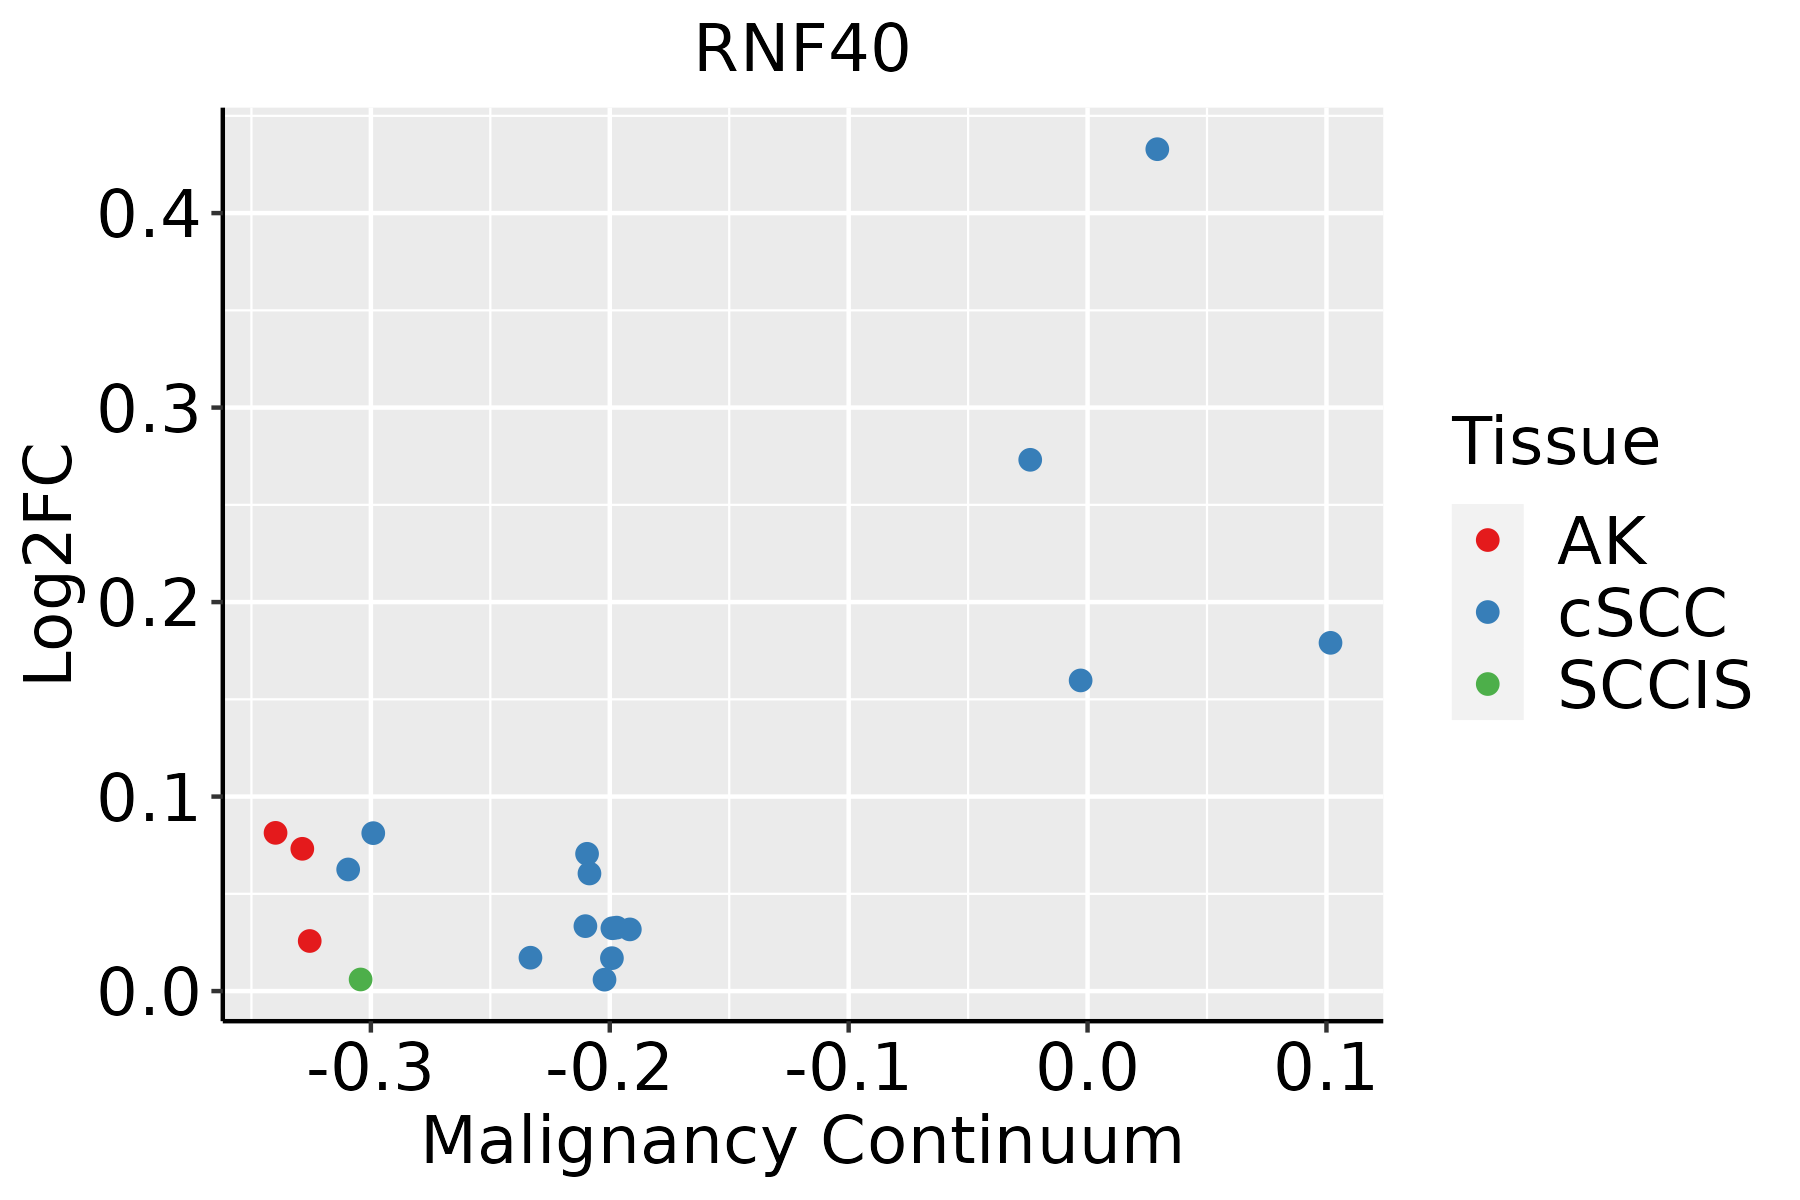
AK: Actinic keratosis
cSCC: Cutaneous squamous cell carcinoma
SCCIS:squamous cell carcinoma in situ
∗log2FC in expression of this searched gene in stem-like cells from each diseased tissue sample relative to stem-like cells in normal samples in each tissue plotted against the malignancy continuum. Samples are colored based on if they are from different disease stage.

Top

Malignant transformation related pathway analysis

check buttonFind out the enriched GO biological processes and KEGG pathways involved in transition from healthy to precancer to cancer
check button Figure of enriched GO biological processes.
TissueDisease StageEnriched GO biological Processes
ColorectumADGO analysis - Figure of enriched GO biological processes: Top 15 enriched GO BP terms are showed in the bar plot of each disease state in each tissue. Each row represents a significant GO biological process which is colored according to the -log10(p.adjust).
ColorectumSERGO analysis - Figure of enriched GO biological processes: Top 15 enriched GO BP terms are showed in the bar plot of each disease state in each tissue. Each row represents a significant GO biological process which is colored according to the -log10(p.adjust).
ColorectumMSSGO analysis - Figure of enriched GO biological processes: Top 15 enriched GO BP terms are showed in the bar plot of each disease state in each tissue. Each row represents a significant GO biological process which is colored according to the -log10(p.adjust).
ColorectumMSI-HGO analysis - Figure of enriched GO biological processes: Top 15 enriched GO BP terms are showed in the bar plot of each disease state in each tissue. Each row represents a significant GO biological process which is colored according to the -log10(p.adjust).
ColorectumFAPGO analysis - Figure of enriched GO biological processes: Top 15 enriched GO BP terms are showed in the bar plot of each disease state in each tissue. Each row represents a significant GO biological process which is colored according to the -log10(p.adjust).
∗Top 15 enriched GO BP terms are showed in the bar plot of each disease state in each tissue. Each row represents a significant GO biological process which is colored according to the -log10(p.adjust).
Page: 1 2 3 4 5 6 7 8 9 

check button Enriched GO biological processes.
GO IDTissueDisease StageDescriptionGene RatioBg Ratiopvaluep.adjustCount
GO:190336229SkincSCCregulation of cellular protein catabolic process139/4864255/187232.06e-224.17e-20139
GO:190305029SkincSCCregulation of proteolysis involved in cellular protein catabolic process121/4864221/187236.75e-201.01e-17121
GO:006113629SkincSCCregulation of proteasomal protein catabolic process106/4864187/187234.31e-195.87e-17106
GO:190332029SkincSCCregulation of protein modification by small protein conjugation or removal125/4864242/187239.50e-181.05e-15125
GO:004586229SkincSCCpositive regulation of proteolysis169/4864372/187232.43e-162.21e-14169
GO:000989628SkincSCCpositive regulation of catabolic process206/4864492/187236.06e-154.64e-13206
GO:003139629SkincSCCregulation of protein ubiquitination107/4864210/187237.17e-155.35e-13107
GO:190336429SkincSCCpositive regulation of cellular protein catabolic process85/4864155/187231.87e-141.31e-1285
GO:003133128SkincSCCpositive regulation of cellular catabolic process182/4864427/187233.29e-142.22e-12182
GO:004573229SkincSCCpositive regulation of protein catabolic process112/4864231/187231.37e-138.40e-12112
GO:190180025SkincSCCpositive regulation of proteasomal protein catabolic process66/4864114/187235.18e-133.01e-1166
GO:190305225SkincSCCpositive regulation of proteolysis involved in cellular protein catabolic process72/4864133/187234.24e-122.27e-1072
GO:001657024SkincSCChistone modification179/4864463/187239.65e-103.74e-08179
GO:000020924SkincSCCprotein polyubiquitination103/4864236/187232.57e-099.09e-08103
GO:00311234SkincSCCRNA 3'-end processing58/4864116/187232.47e-086.89e-0758
GO:005068617SkincSCCnegative regulation of mRNA processing22/486429/187232.73e-087.41e-0722
GO:190332217SkincSCCpositive regulation of protein modification by small protein conjugation or removal64/4864138/187231.79e-073.94e-0664
GO:190331228SkincSCCnegative regulation of mRNA metabolic process47/486492/187232.24e-074.77e-0647
GO:003105615SkincSCCregulation of histone modification68/4864152/187234.07e-077.93e-0668
GO:00311244SkincSCCmRNA 3'-end processing34/486462/187231.27e-062.20e-0534
Page: 1 2 3 4 5 6 7 8 9 

check button Enriched KEGG pathways.
Pathway IDTissueDisease StageDescriptionGene RatioBg Ratiopvaluep.adjustqvalueCount
Page: 1 

Top

Cell-cell communication analysis

check buttonIdentification of potential cell-cell interactions between two cell types and their ligand-receptor pairs for different disease states
LigandReceptorLRpairPathwayTissueDisease Stage
Page: 1 

Top

Single-cell gene regulatory network inference analysis

check buttonFind out the significant the regulons (TFs) and the target genes of each regulon across cell types for different disease states
TFCell TypeTissueDisease StageTarget GeneRSSRegulon Activity
∗The dot plots of a searched regulon are shown for all cell subpopulations in each disease state of each tissue based on the regulon specific score inferred using pySCENIC and by calculating the average expression.
Page: 1 

Top

Somatic mutation of malignant transformation related genes

check buttonAnnotation of somatic variants for genes involved in malignant transformation
Hugo SymbolVariant ClassVariant ClassificationdbSNP RSHGVScHGVSpHGVSp ShortSWISSPROTBIOTYPESIFTPolyPhenTumor Sample BarcodeTissueHistologySexAgeStageTherapy TypesDrugsOutcome
RNF40SNVMissense_Mutationc.2281A>Gp.Thr761Alap.T761AO75150protein_codingdeleterious(0)probably_damaging(0.954)TCGA-A2-A0YE-01Breastbreast invasive carcinomaFemale<65I/IIUnspecificTaxotereSD
RNF40SNVMissense_Mutationc.1547G>Tp.Gly516Valp.G516VO75150protein_codingtolerated(0.37)benign(0.202)TCGA-A2-A25A-01Breastbreast invasive carcinomaFemale<65I/IIUnspecificCytoxanSD
RNF40SNVMissense_Mutationc.589N>Cp.Glu197Glnp.E197QO75150protein_codingtolerated(0.9)possibly_damaging(0.73)TCGA-AC-A23H-01Breastbreast invasive carcinomaFemale>=65I/IIUnknownUnknownPD
RNF40SNVMissense_Mutationrs751674221c.179N>Gp.Ala60Glyp.A60GO75150protein_codingtolerated(0.21)benign(0.373)TCGA-AC-A3OD-01Breastbreast invasive carcinomaFemale>=65I/IIUnknownUnknownSD
RNF40SNVMissense_Mutationc.1409N>Ap.Leu470Glnp.L470QO75150protein_codingdeleterious(0.05)probably_damaging(0.999)TCGA-BH-A208-01Breastbreast invasive carcinomaFemale<65I/IIUnknownUnknownSD
RNF40SNVMissense_Mutationc.1330N>Cp.Glu444Glnp.E444QO75150protein_codingdeleterious(0)probably_damaging(0.994)TCGA-C8-A26Y-01Breastbreast invasive carcinomaFemale>=65I/IIUnknownUnknownSD
RNF40SNVMissense_Mutationc.2390N>Gp.Asn797Serp.N797SO75150protein_codingdeleterious(0)probably_damaging(0.954)TCGA-GM-A2DF-01Breastbreast invasive carcinomaFemale<65I/IIChemotherapytaxolCR
RNF40insertionIn_Frame_Insnovelc.1599_1600insATTGGATGTATAAAAAAAAAAAAGAAAAAAp.Gly533_His534insIleGlyCysIleLysLysLysLysLysLysp.G533_H534insIGCIKKKKKKO75150protein_codingTCGA-A8-A06O-01Breastbreast invasive carcinomaFemale<65I/IIHormone TherapyletrozoleSD
RNF40insertionIn_Frame_Insnovelc.2947_2948insCTTGTCCTTTTGAGGGGACACATGATAp.Cys983delinsSerCysProPheGluGlyThrHisAspSerp.C983delinsSCPFEGTHDSO75150protein_codingTCGA-A8-A08H-01Breastbreast invasive carcinomaFemale>=65I/IIUnknownUnknownSD
RNF40insertionNonsense_Mutationnovelc.355_356insGACGGGGGCTCAGGGCCCCp.Ser119Terp.S119*O75150protein_codingTCGA-AO-A03L-01Breastbreast invasive carcinomaFemale<65III/IVChemotherapycyclophosphamideSD
Page: 1 2 3 4 5 6 7 8 9 10 11 12 

Top

Related drugs of malignant transformation related genes

check buttonIdentification of chemicals and drugs interact with genes involved in malignant transfromation
(DGIdb 4.0)
Entrez IDSymbolCategoryInteraction TypesDrug Claim NameDrug NamePMIDs
Page: 1