Schematic overview of the cellular and molecular mechanisms involved in the cancer progression, including the proposed cellular and molecular mechanisms in cancer cells trajectory. AT1: alveolar type 1 cells; AT2: alveolar type 2 cells; AAH: atypical adenomatous hyperplasia; AIS: adenocarcinoma in situ; MIA: minimally invasive adenocarcinoma; IA: invasive adenocarcinoma; EMT: epithelial-mesenchymal transition

Home

Download

Statistics

Help

Contact

Center for Computational Systems Medicine
leaf

Gene summary

leaf

Malignant transformation analysis

leaf

Malignant transformation related pathway analysis

leaf

Cell-cell communication analysis

leaf

Single-cell gene regulatory network inference analysis

leaf

Somatic mutation of malignant transformation related genes

leaf

Related drugs of malignant transformation related genes

Gene: RNF19A

Gene summary for RNF19A

check button Gene summary.

Gene informationSpeciesHuman
Gene symbol

RNF19A

Gene ID

25897

Gene namering finger protein 19A, RBR E3 ubiquitin protein ligase
Gene AliasRNF19
Cytomap8q22.2
Gene Typeprotein-coding
GO ID

GO:0000209

UniProtAcc

Q9NV58


Top

Malignant transformation analysis

check button Identification of the aberrant gene expression in precancerous and cancerous lesions by comparing the gene expression of stem-like cells in diseased tissues with normal stem cells
check button Malignant transformation involving gene list.
Entrez IDSymbolReplicatesSpeciesOrganTissueAdj P-valueLog2FCMalignancy
25897RNF19AGSM4909287HumanBreastIDC2.73e-135.79e-010.2057
25897RNF19AGSM4909290HumanBreastIDC1.09e-114.67e-010.2096
25897RNF19AGSM4909298HumanBreastIDC1.87e-184.96e-010.1551
25897RNF19AGSM4909311HumanBreastIDC3.32e-09-1.52e-010.1534
25897RNF19AGSM4909317HumanBreastIDC3.00e-103.94e-010.1355
25897RNF19AGSM4909319HumanBreastIDC6.97e-12-8.05e-020.1563
25897RNF19AGSM4909321HumanBreastIDC2.92e-03-1.25e-010.1559
25897RNF19AM1HumanBreastIDC1.36e-361.00e+000.1577
25897RNF19ANCCBC6HumanBreastDCIS4.22e-024.85e-010.2095
25897RNF19AP1HumanBreastIDC5.14e-125.12e-010.1527
25897RNF19ADCIS2HumanBreastDCIS9.80e-452.91e-010.0085
25897RNF19ACA_HPV_1HumanCervixCC2.00e-022.41e-020.0264
25897RNF19ACCI_2HumanCervixCC3.27e-051.65e+000.5249
25897RNF19ACCI_3HumanCervixCC3.25e-036.43e-010.516
25897RNF19AHTA11_3410_2000001011HumanColorectumAD1.43e-10-4.45e-010.0155
25897RNF19AHTA11_3361_2000001011HumanColorectumAD8.96e-04-5.19e-01-0.1207
25897RNF19AHTA11_83_2000001011HumanColorectumSER3.43e-03-3.93e-01-0.1526
25897RNF19AHTA11_696_2000001011HumanColorectumAD7.30e-16-5.07e-01-0.1464
25897RNF19AHTA11_866_2000001011HumanColorectumAD1.32e-03-3.02e-01-0.1001
25897RNF19AHTA11_5212_2000001011HumanColorectumAD1.02e-02-5.95e-01-0.2061
Page: 1 2 3 4 5 6 7 8 9 10 11 12 

check button Transcriptomic changes along malignancy continuum.
TissueExpression DynamicsAbbreviation
BreastThe image shows the transcriptomic changes along malignancy continuum.log2FC in expression of this searched gene in stem-like cells from each diseased tissue sample relative to stem-like cells in normal samples in each tissue plotted against the malignancy continuum. Samples are colored based on if they are from different disease stage.
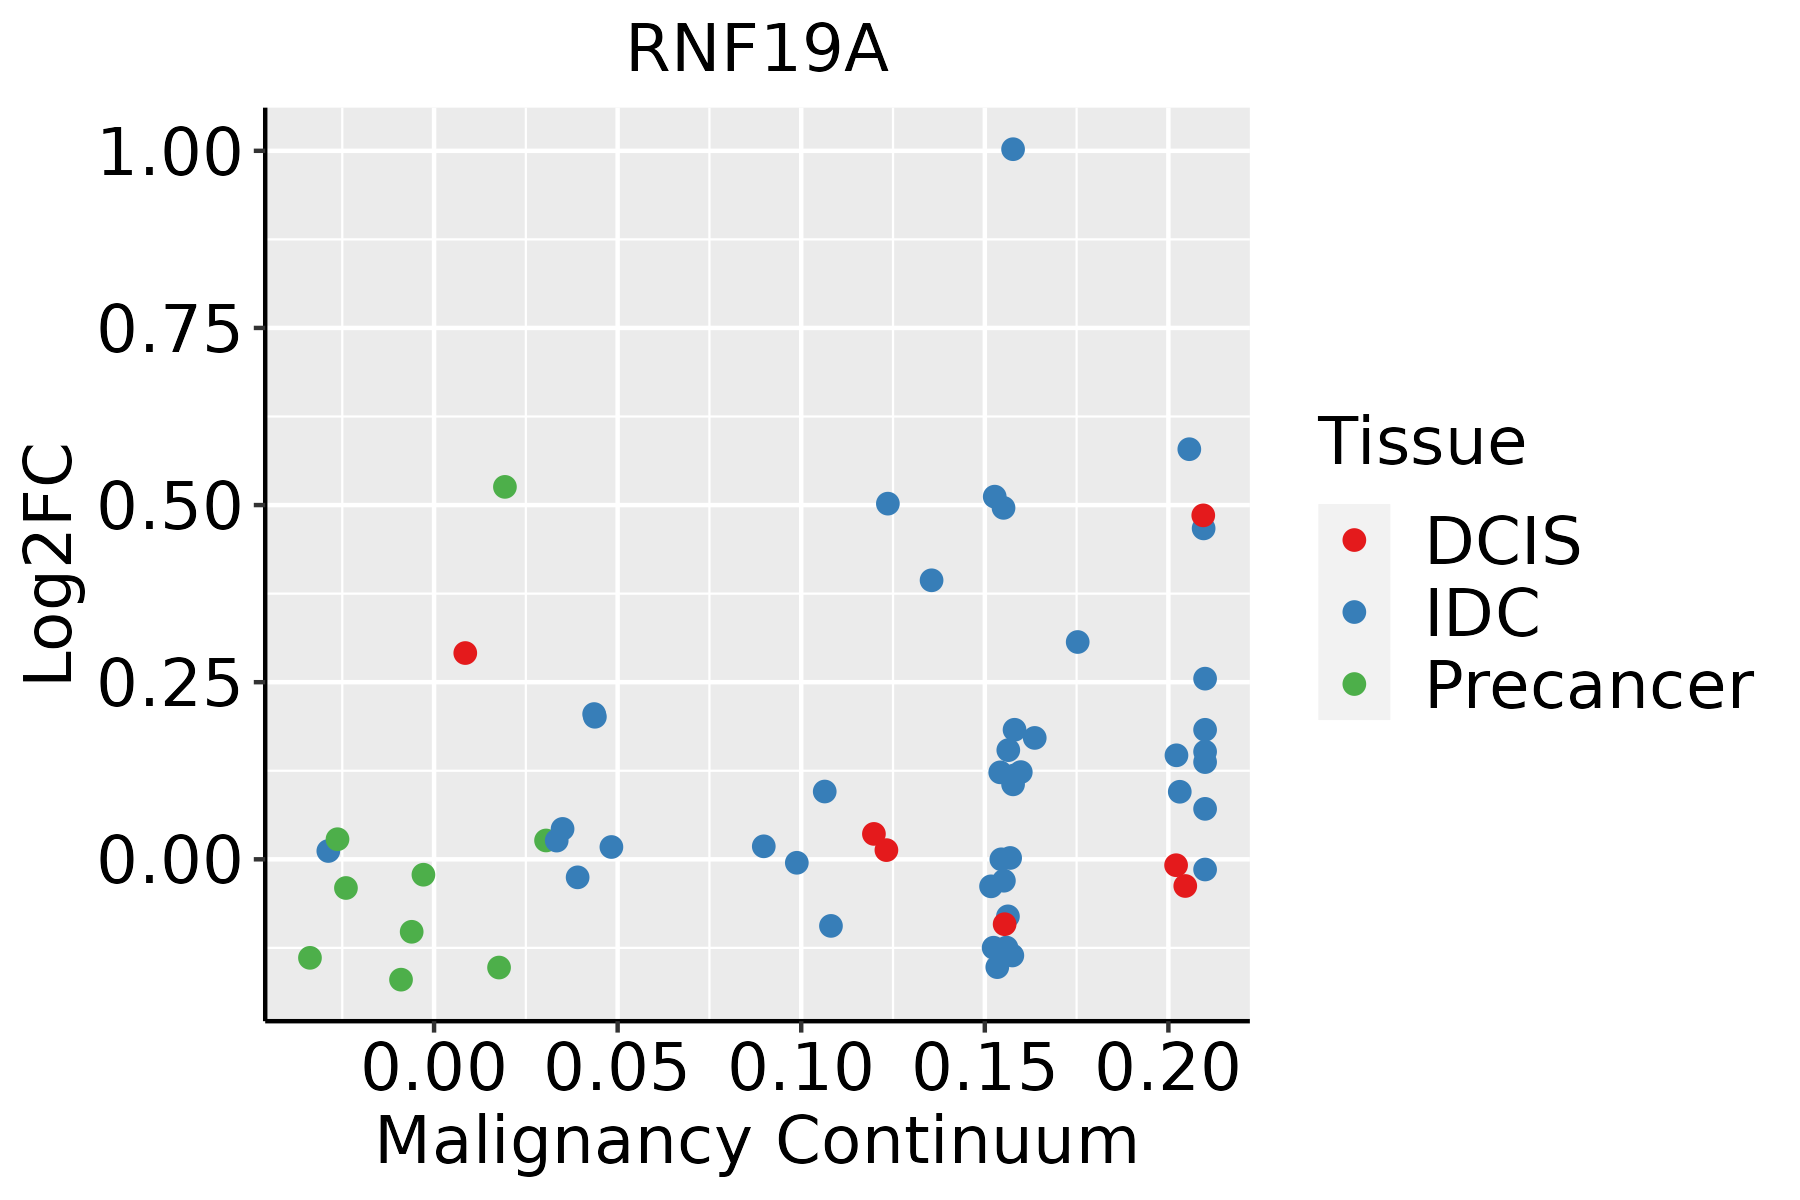
IDC: Invasive ductal carcinoma
DCIS: Ductal carcinoma in situ
Precancer(BRCA1-mut): Precancerous lesion from BRCA1 mutation carriers
CervixThe image shows the transcriptomic changes along malignancy continuum.log2FC in expression of this searched gene in stem-like cells from each diseased tissue sample relative to stem-like cells in normal samples in each tissue plotted against the malignancy continuum. Samples are colored based on if they are from different disease stage.CC: Cervix cancer
HSIL_HPV: HPV-infected high-grade squamous intraepithelial lesions
N_HPV: HPV-infected normal cervix
Colorectum (GSE201348)The image shows the transcriptomic changes along malignancy continuum.log2FC in expression of this searched gene in stem-like cells from each diseased tissue sample relative to stem-like cells in normal samples in each tissue plotted against the malignancy continuum. Samples are colored based on if they are from different disease stage.FAP: Familial adenomatous polyposis
CRC: Colorectal cancer
Colorectum (HTA11)The image shows the transcriptomic changes along malignancy continuum.log2FC in expression of this searched gene in stem-like cells from each diseased tissue sample relative to stem-like cells in normal samples in each tissue plotted against the malignancy continuum. Samples are colored based on if they are from different disease stage.AD: Adenomas
SER: Sessile serrated lesions
MSI-H: Microsatellite-high colorectal cancer
MSS: Microsatellite stable colorectal cancer
EndometriumThe image shows the transcriptomic changes along malignancy continuum.log2FC in expression of this searched gene in stem-like cells from each diseased tissue sample relative to stem-like cells in normal samples in each tissue plotted against the malignancy continuum. Samples are colored based on if they are from different disease stage.AEH: Atypical endometrial hyperplasia
EEC: Endometrioid Cancer
EsophagusThe image shows the transcriptomic changes along malignancy continuum.log2FC in expression of this searched gene in stem-like cells from each diseased tissue sample relative to stem-like cells in normal samples in each tissue plotted against the malignancy continuum. Samples are colored based on if they are from different disease stage.ESCC: Esophageal squamous cell carcinoma
HGIN: High-grade intraepithelial neoplasias
LGIN: Low-grade intraepithelial neoplasias
LiverThe image shows the transcriptomic changes along malignancy continuum.log2FC in expression of this searched gene in stem-like cells from each diseased tissue sample relative to stem-like cells in normal samples in each tissue plotted against the malignancy continuum. Samples are colored based on if they are from different disease stage.
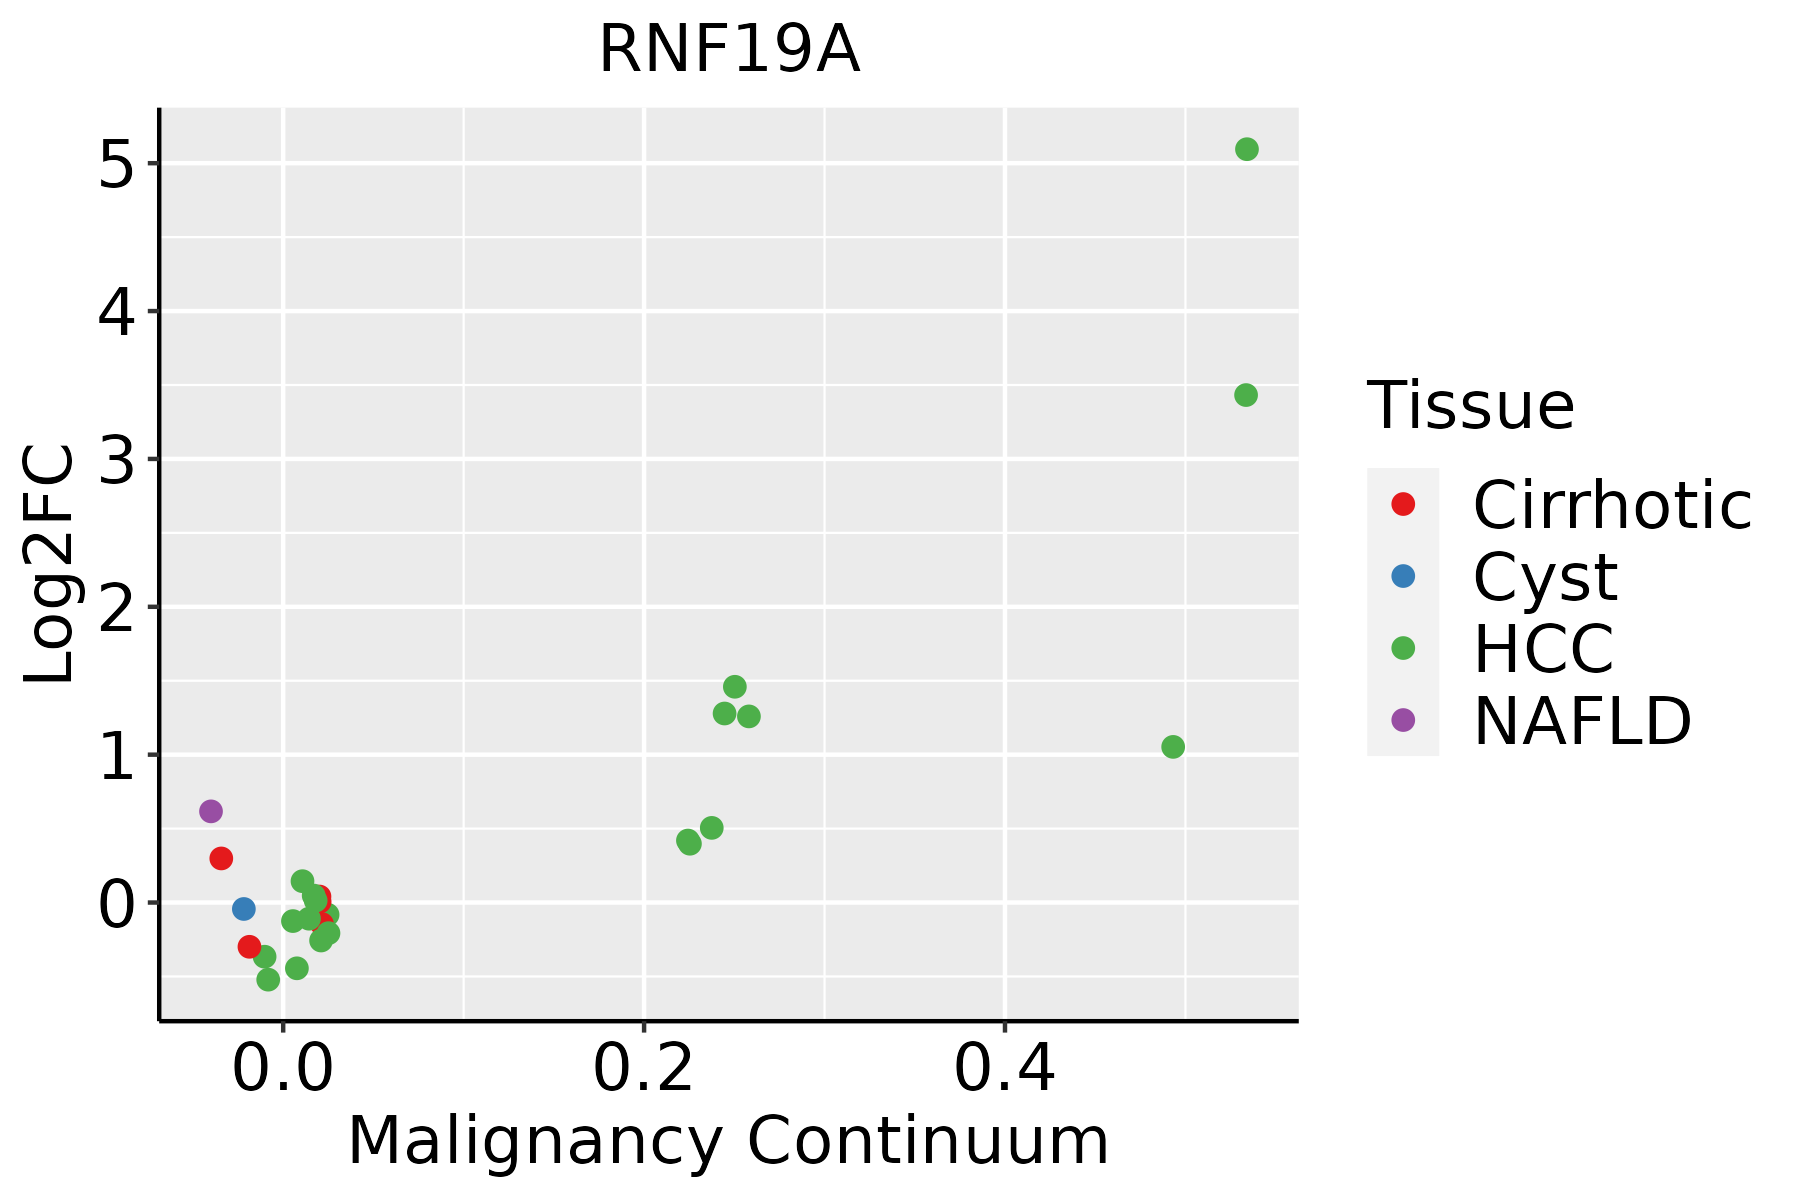
HCC: Hepatocellular carcinoma
NAFLD: Non-alcoholic fatty liver disease
LungThe image shows the transcriptomic changes along malignancy continuum.log2FC in expression of this searched gene in stem-like cells from each diseased tissue sample relative to stem-like cells in normal samples in each tissue plotted against the malignancy continuum. Samples are colored based on if they are from different disease stage.
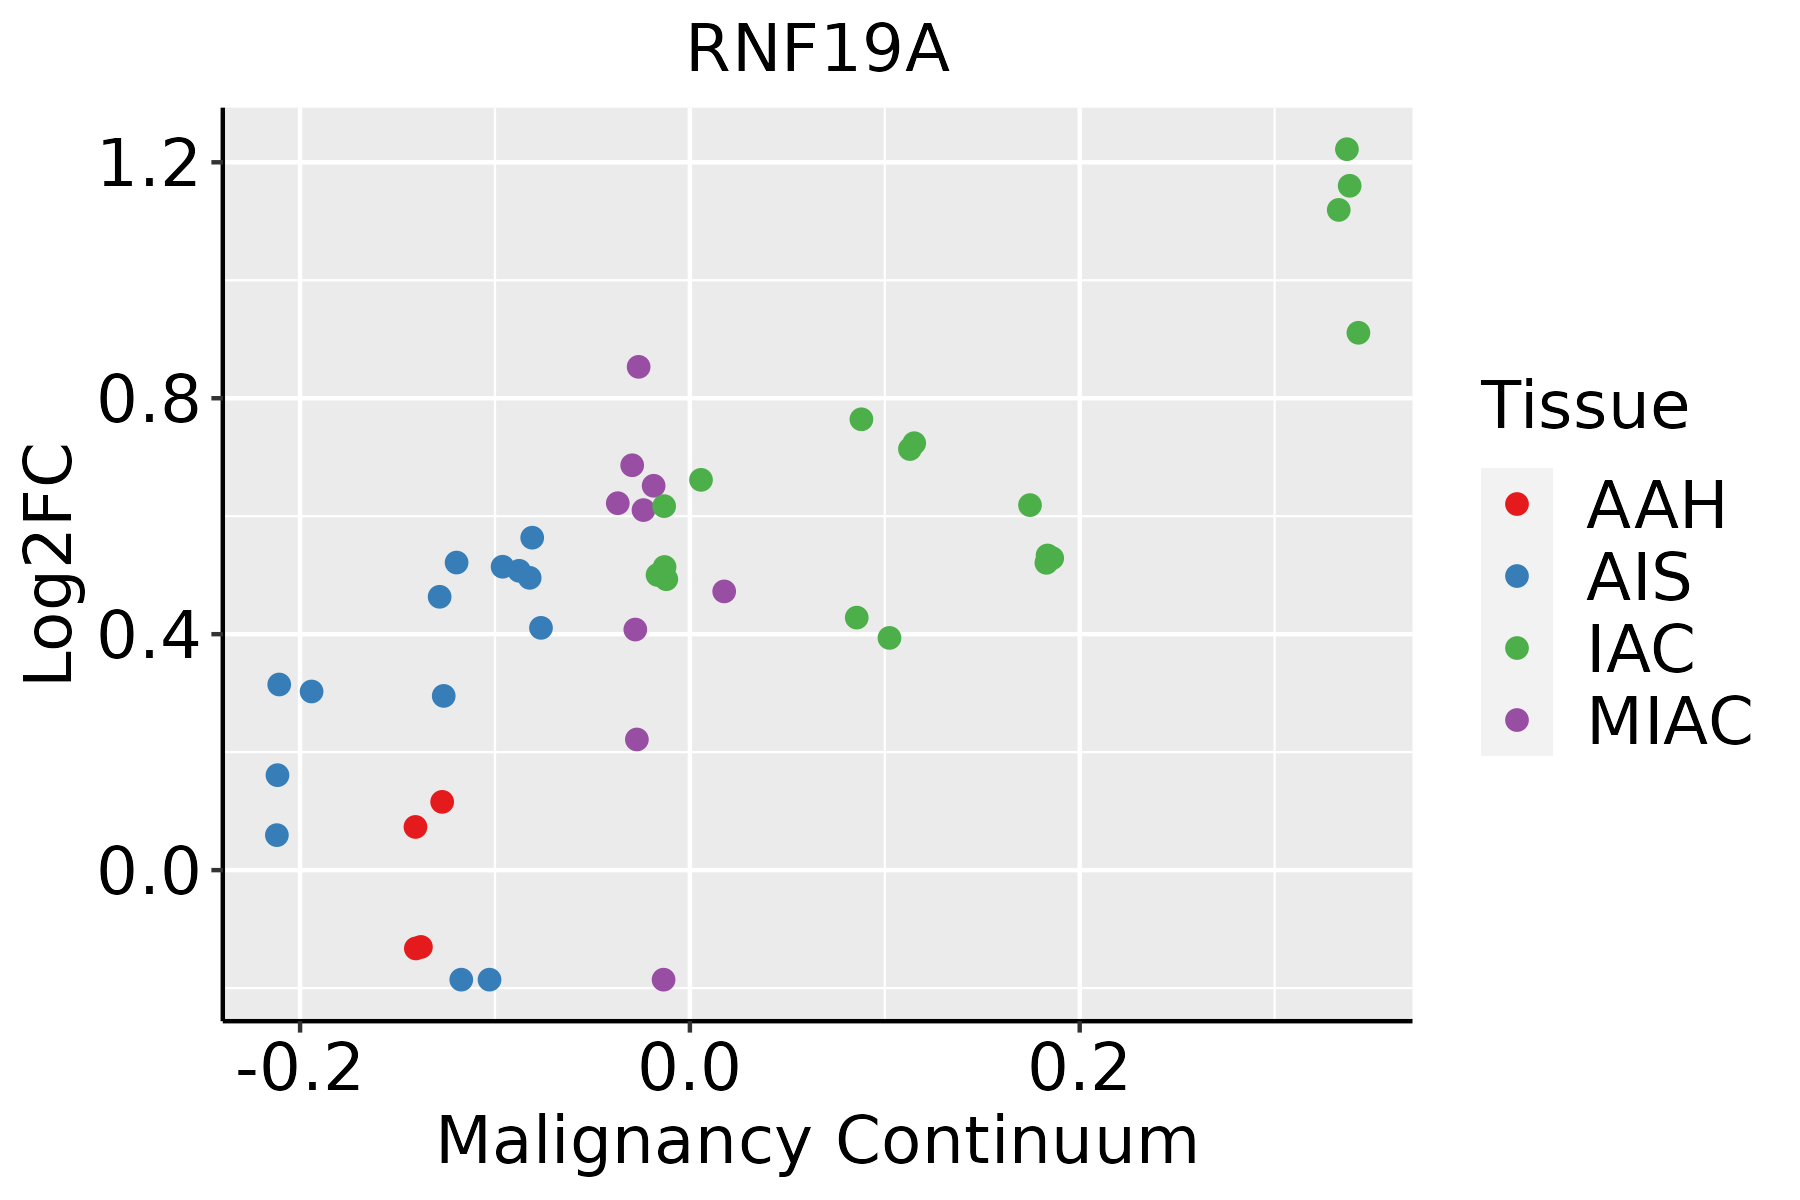
AAH: Atypical adenomatous hyperplasia
AIS: Adenocarcinoma in situ
IAC: Invasive lung adenocarcinoma
MIA: Minimally invasive adenocarcinoma
Oral CavityThe image shows the transcriptomic changes along malignancy continuum.log2FC in expression of this searched gene in stem-like cells from each diseased tissue sample relative to stem-like cells in normal samples in each tissue plotted against the malignancy continuum. Samples are colored based on if they are from different disease stage.
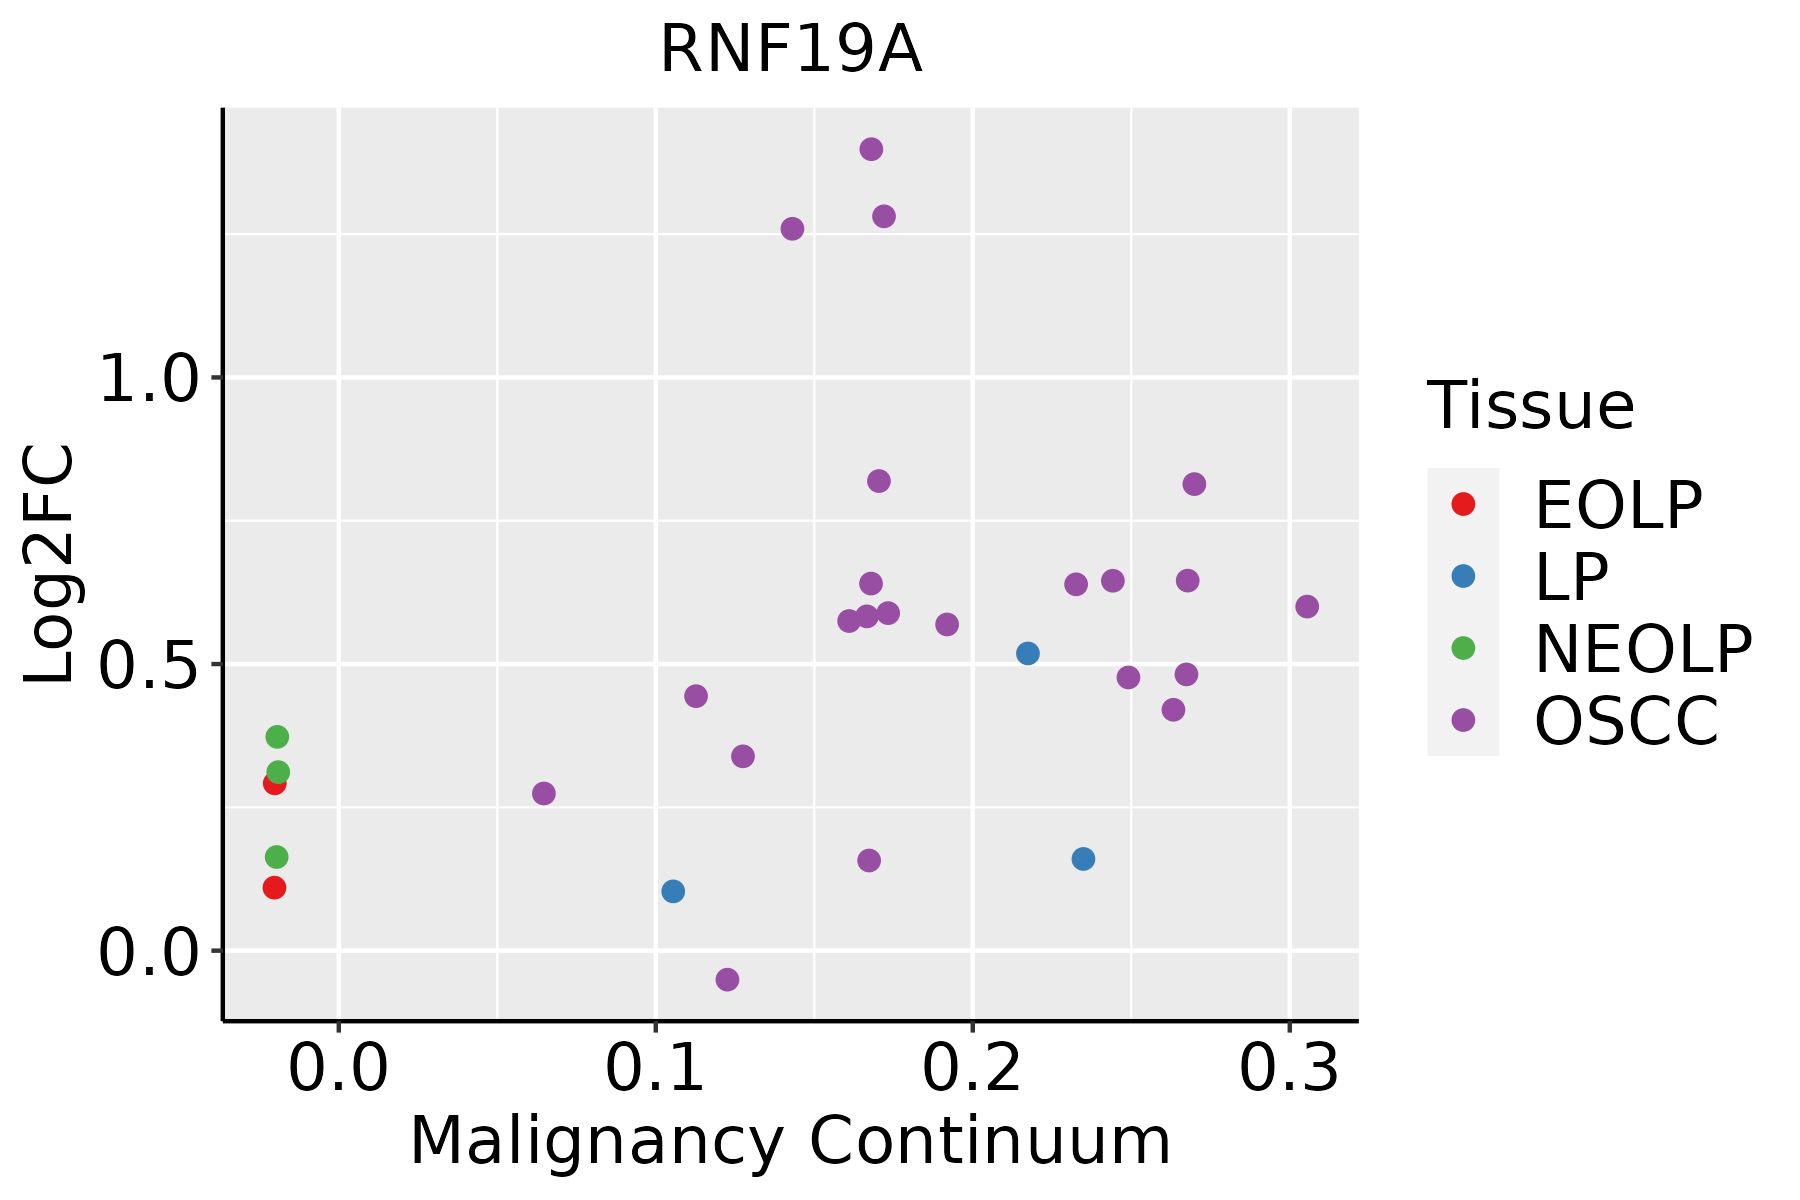
EOLP: Erosive Oral lichen planus
LP: leukoplakia
NEOLP: Non-erosive oral lichen planus
OSCC: Oral squamous cell carcinoma
ProstateThe image shows the transcriptomic changes along malignancy continuum.log2FC in expression of this searched gene in stem-like cells from each diseased tissue sample relative to stem-like cells in normal samples in each tissue plotted against the malignancy continuum. Samples are colored based on if they are from different disease stage.
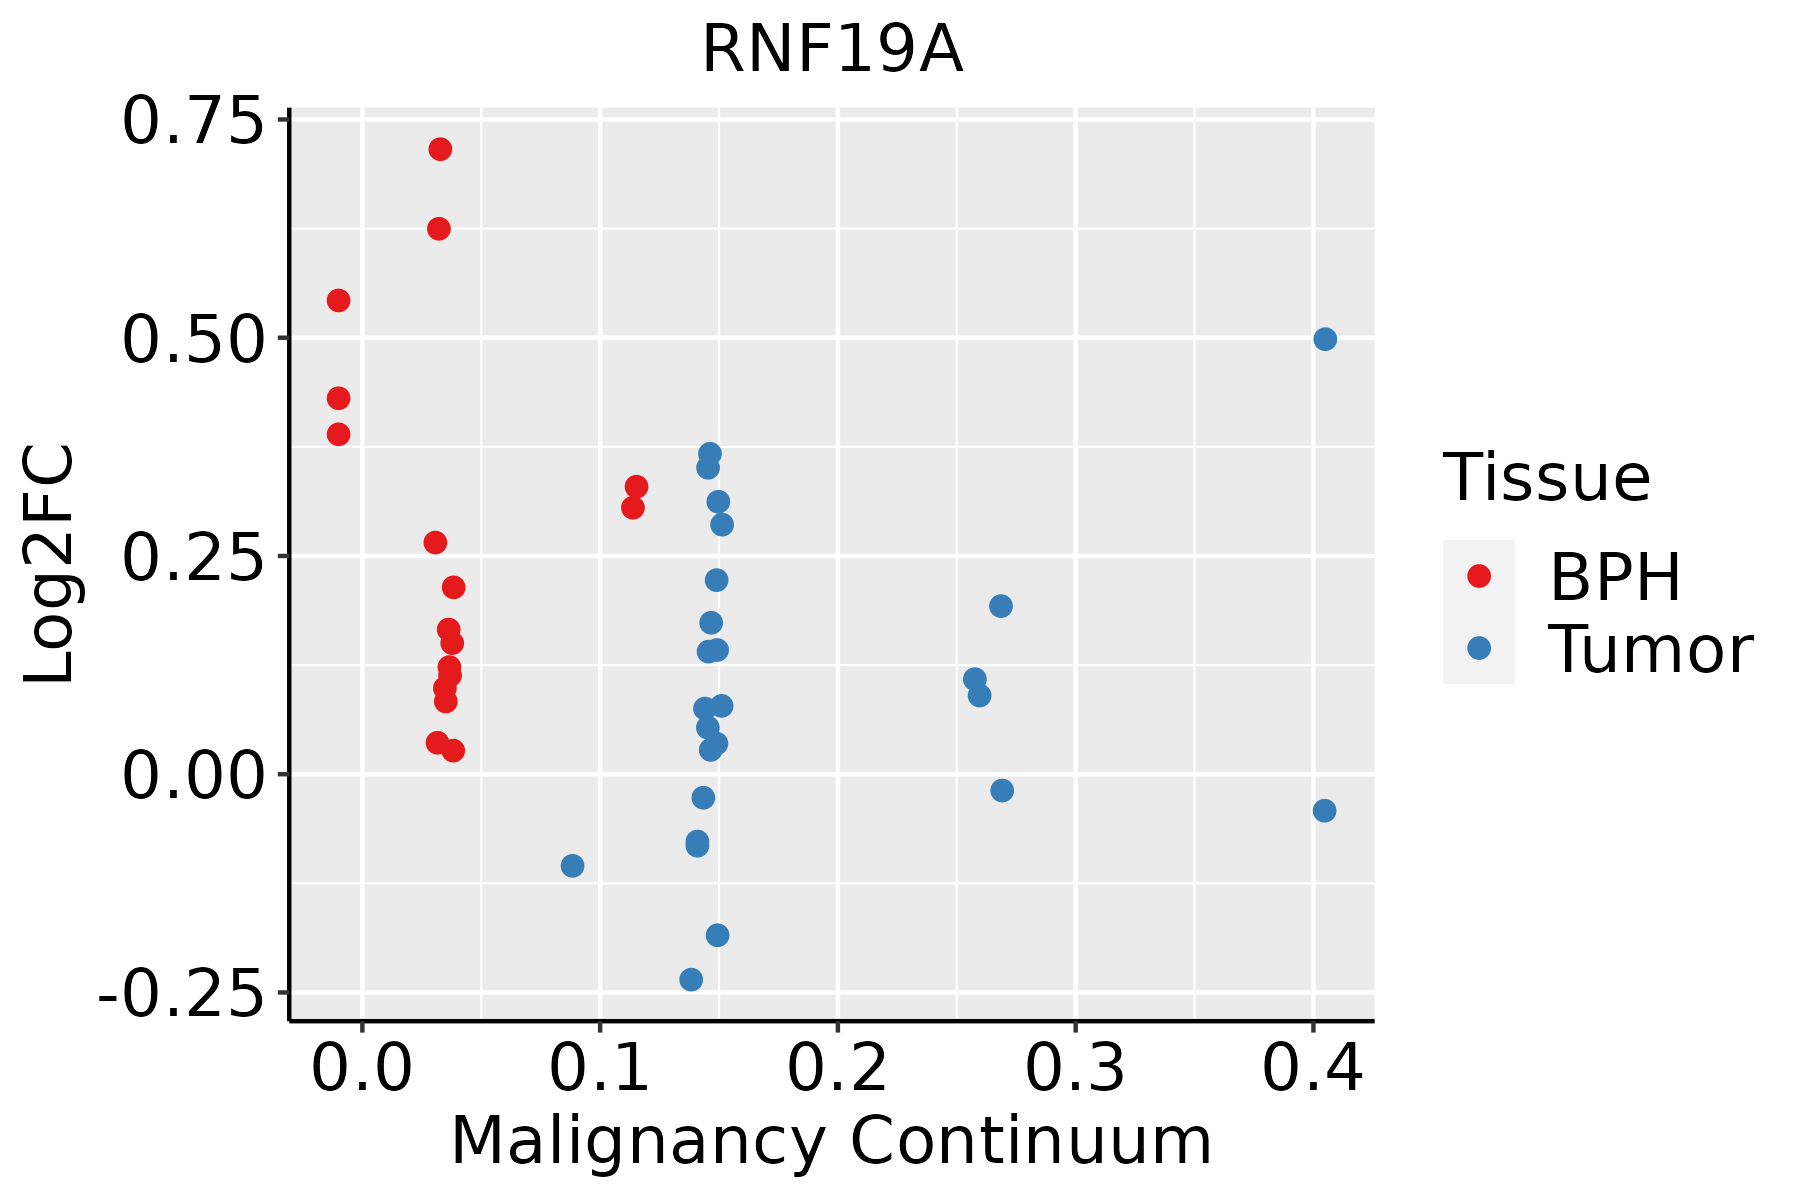
BPH: Benign Prostatic Hyperplasia
SkinThe image shows the transcriptomic changes along malignancy continuum.log2FC in expression of this searched gene in stem-like cells from each diseased tissue sample relative to stem-like cells in normal samples in each tissue plotted against the malignancy continuum. Samples are colored based on if they are from different disease stage.
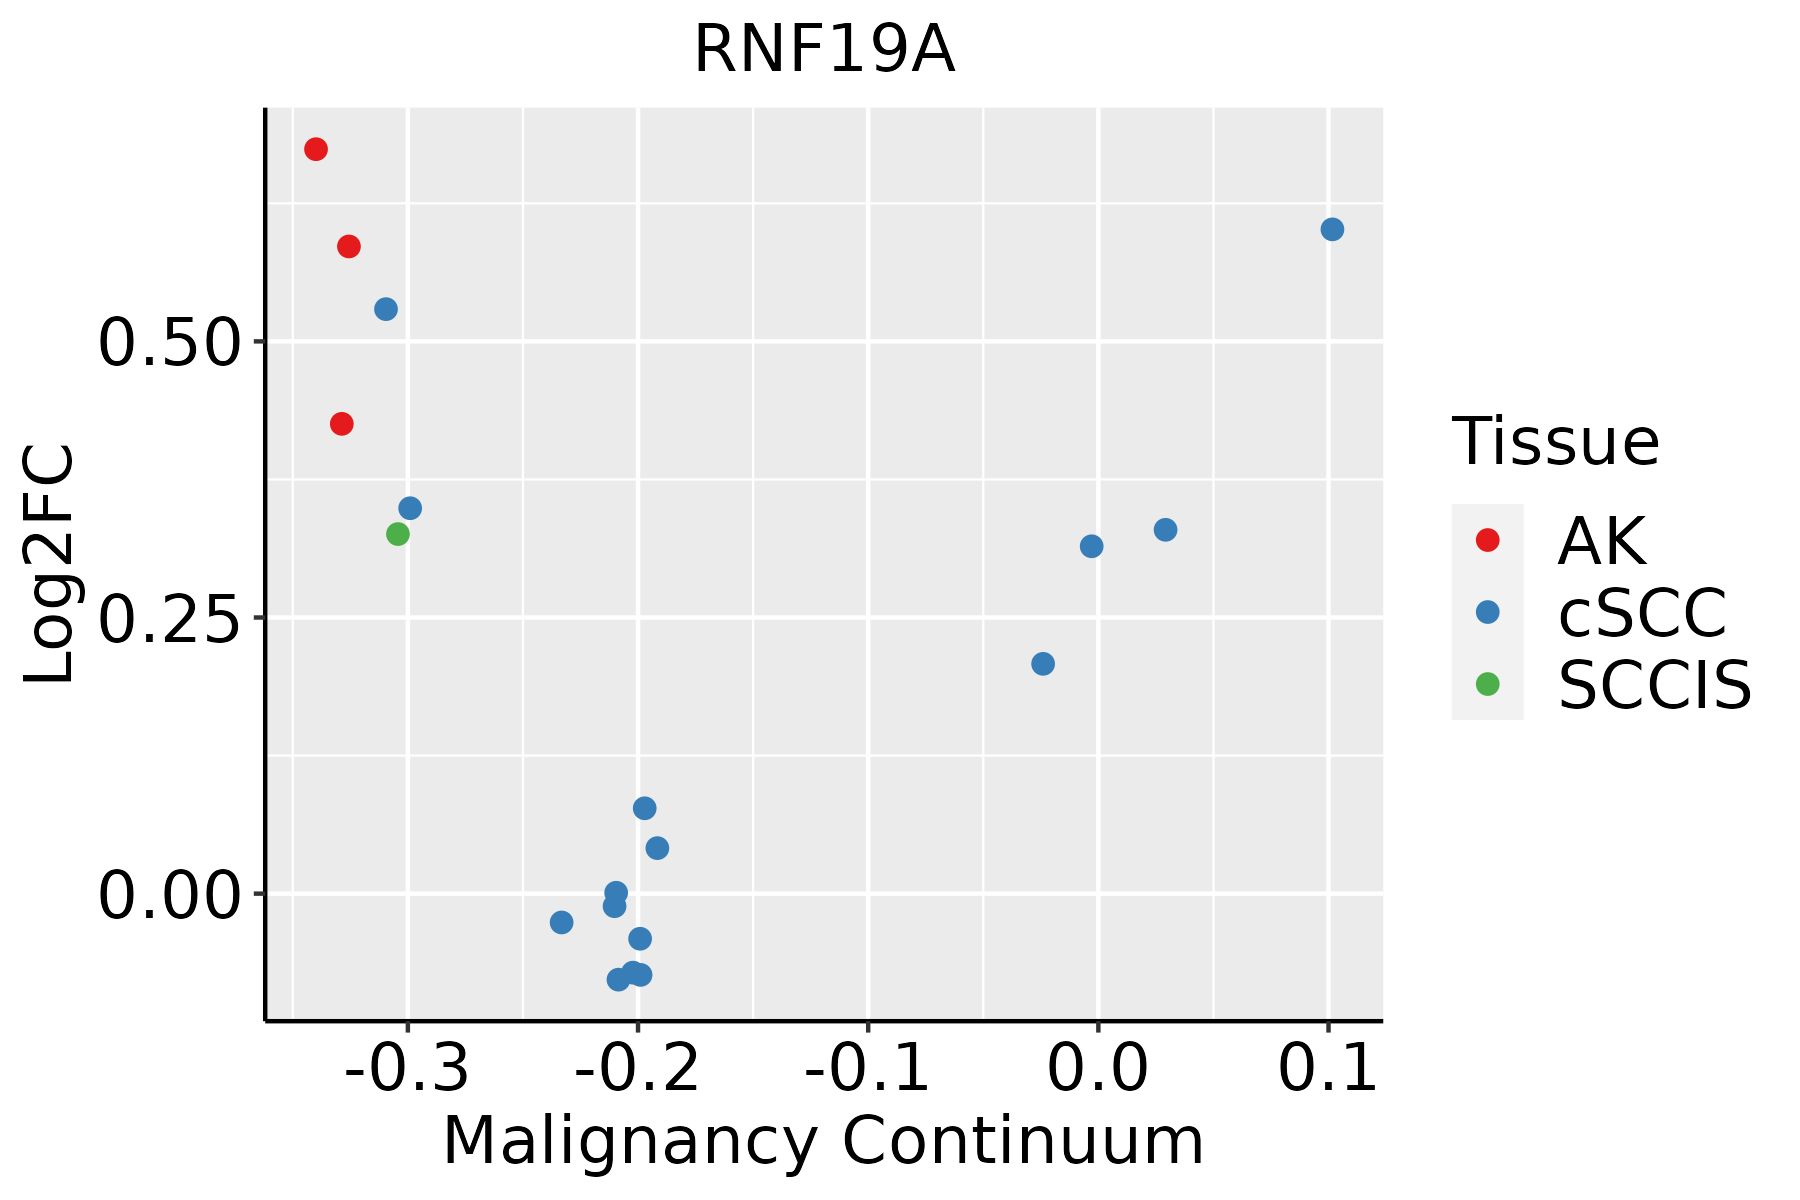
AK: Actinic keratosis
cSCC: Cutaneous squamous cell carcinoma
SCCIS:squamous cell carcinoma in situ
ThyroidThe image shows the transcriptomic changes along malignancy continuum.log2FC in expression of this searched gene in stem-like cells from each diseased tissue sample relative to stem-like cells in normal samples in each tissue plotted against the malignancy continuum. Samples are colored based on if they are from different disease stage.
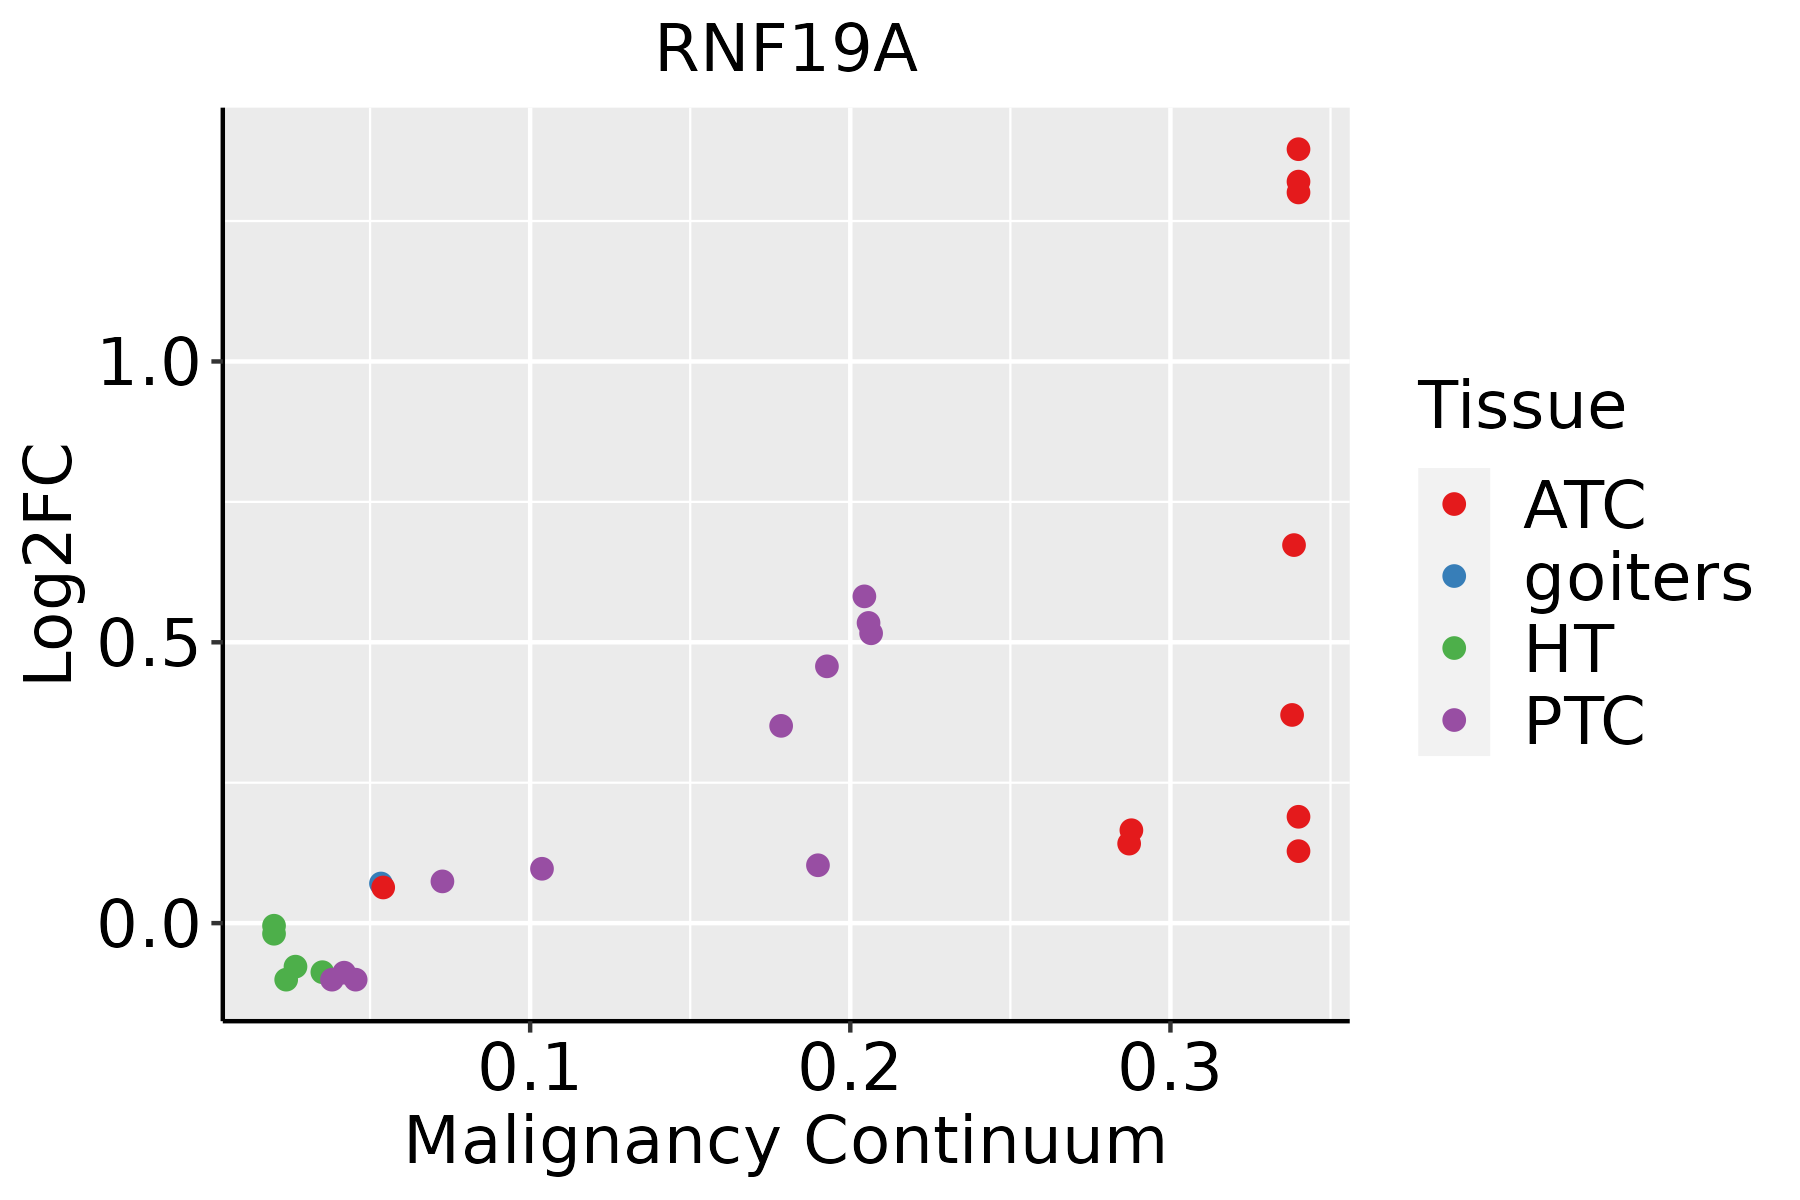
ATC: Anaplastic thyroid cancer
HT: Hashimoto's thyroiditis
PTC: Papillary thyroid cancer
∗log2FC in expression of this searched gene in stem-like cells from each diseased tissue sample relative to stem-like cells in normal samples in each tissue plotted against the malignancy continuum. Samples are colored based on if they are from different disease stage.

Top

Malignant transformation related pathway analysis

check buttonFind out the enriched GO biological processes and KEGG pathways involved in transition from healthy to precancer to cancer
check button Figure of enriched GO biological processes.
TissueDisease StageEnriched GO biological Processes
ColorectumADGO analysis - Figure of enriched GO biological processes: Top 15 enriched GO BP terms are showed in the bar plot of each disease state in each tissue. Each row represents a significant GO biological process which is colored according to the -log10(p.adjust).
ColorectumSERGO analysis - Figure of enriched GO biological processes: Top 15 enriched GO BP terms are showed in the bar plot of each disease state in each tissue. Each row represents a significant GO biological process which is colored according to the -log10(p.adjust).
ColorectumMSSGO analysis - Figure of enriched GO biological processes: Top 15 enriched GO BP terms are showed in the bar plot of each disease state in each tissue. Each row represents a significant GO biological process which is colored according to the -log10(p.adjust).
ColorectumMSI-HGO analysis - Figure of enriched GO biological processes: Top 15 enriched GO BP terms are showed in the bar plot of each disease state in each tissue. Each row represents a significant GO biological process which is colored according to the -log10(p.adjust).
ColorectumFAPGO analysis - Figure of enriched GO biological processes: Top 15 enriched GO BP terms are showed in the bar plot of each disease state in each tissue. Each row represents a significant GO biological process which is colored according to the -log10(p.adjust).
∗Top 15 enriched GO BP terms are showed in the bar plot of each disease state in each tissue. Each row represents a significant GO biological process which is colored according to the -log10(p.adjust).
Page: 1 2 3 4 5 6 7 8 9 

check button Enriched GO biological processes.
GO IDTissueDisease StageDescriptionGene RatioBg Ratiopvaluep.adjustCount
GO:00991701ColorectumCRCpostsynaptic modulation of chemical synaptic transmission6/207815/187233.82e-033.19e-026
GO:004217616EndometriumAEHregulation of protein catabolic process100/2100391/187239.58e-163.59e-13100
GO:190336216EndometriumAEHregulation of cellular protein catabolic process70/2100255/187235.40e-131.25e-1070
GO:001049816EndometriumAEHproteasomal protein catabolic process108/2100490/187232.73e-124.67e-10108
GO:000989616EndometriumAEHpositive regulation of catabolic process104/2100492/187239.38e-111.10e-08104
GO:190305016EndometriumAEHregulation of proteolysis involved in cellular protein catabolic process58/2100221/187233.58e-103.77e-0858
GO:003133116EndometriumAEHpositive regulation of cellular catabolic process91/2100427/187239.15e-108.31e-0891
GO:004316116EndometriumAEHproteasome-mediated ubiquitin-dependent protein catabolic process88/2100412/187231.54e-091.36e-0788
GO:004586216EndometriumAEHpositive regulation of proteolysis81/2100372/187232.72e-092.06e-0781
GO:200005816EndometriumAEHregulation of ubiquitin-dependent protein catabolic process45/2100164/187237.49e-095.22e-0745
GO:006113616EndometriumAEHregulation of proteasomal protein catabolic process49/2100187/187238.64e-095.96e-0749
GO:004573216EndometriumAEHpositive regulation of protein catabolic process56/2100231/187231.60e-089.99e-0756
GO:003243416EndometriumAEHregulation of proteasomal ubiquitin-dependent protein catabolic process37/2100134/187231.32e-076.04e-0637
GO:190336416EndometriumAEHpositive regulation of cellular protein catabolic process40/2100155/187233.03e-071.31e-0540
GO:19030529EndometriumAEHpositive regulation of proteolysis involved in cellular protein catabolic process32/2100133/187232.12e-054.15e-0432
GO:200006016EndometriumAEHpositive regulation of ubiquitin-dependent protein catabolic process27/2100107/187233.74e-056.50e-0427
GO:003243610EndometriumAEHpositive regulation of proteasomal ubiquitin-dependent protein catabolic process23/210090/187231.11e-041.58e-0323
GO:19018009EndometriumAEHpositive regulation of proteasomal protein catabolic process27/2100114/187231.21e-041.67e-0327
GO:00002098EndometriumAEHprotein polyubiquitination44/2100236/187234.83e-044.97e-0344
GO:004217617EndometriumEECregulation of protein catabolic process103/2168391/187233.54e-161.52e-13103
Page: 1 2 3 4 5 6 7 8 9 10 11 12 13 14 15 16 17 18 19 20 21 22 23 24 25 26 

check button Enriched KEGG pathways.
Pathway IDTissueDisease StageDescriptionGene RatioBg Ratiopvaluep.adjustqvalueCount
Page: 1 

Top

Cell-cell communication analysis

check buttonIdentification of potential cell-cell interactions between two cell types and their ligand-receptor pairs for different disease states
LigandReceptorLRpairPathwayTissueDisease Stage
Page: 1 

Top

Single-cell gene regulatory network inference analysis

check buttonFind out the significant the regulons (TFs) and the target genes of each regulon across cell types for different disease states
TFCell TypeTissueDisease StageTarget GeneRSSRegulon Activity
∗The dot plots of a searched regulon are shown for all cell subpopulations in each disease state of each tissue based on the regulon specific score inferred using pySCENIC and by calculating the average expression.
Page: 1 

Top

Somatic mutation of malignant transformation related genes

check buttonAnnotation of somatic variants for genes involved in malignant transformation
Hugo SymbolVariant ClassVariant ClassificationdbSNP RSHGVScHGVSpHGVSp ShortSWISSPROTBIOTYPESIFTPolyPhenTumor Sample BarcodeTissueHistologySexAgeStageTherapy TypesDrugsOutcome
RNF19ASNVMissense_Mutationc.254N>Cp.Asn85Thrp.N85TQ9NV58protein_codingtolerated_low_confidence(0.37)benign(0)TCGA-A2-A0EX-01Breastbreast invasive carcinomaFemale<65I/IIHormone TherapytamoxiphenSD
RNF19ASNVMissense_Mutationnovelc.1550N>Tp.Ala517Valp.A517VQ9NV58protein_codingtolerated(0.39)benign(0.012)TCGA-A2-A3XY-01Breastbreast invasive carcinomaFemale<65I/IIChemotherapyadriamycinPD
RNF19ASNVMissense_Mutationnovelc.1554N>Gp.Ser518Argp.S518RQ9NV58protein_codingdeleterious(0.04)possibly_damaging(0.723)TCGA-A8-A07B-01Breastbreast invasive carcinomaFemale>=65I/IIUnknownUnknownSD
RNF19ASNVMissense_Mutationnovelc.95T>Gp.Met32Argp.M32RQ9NV58protein_codingdeleterious_low_confidence(0.01)benign(0.202)TCGA-A8-A09A-01Breastbreast invasive carcinomaFemale<65I/IIHormone TherapytamoxiphenSD
RNF19ASNVMissense_Mutationc.1756N>Gp.Thr586Alap.T586AQ9NV58protein_codingtolerated(0.39)benign(0.251)TCGA-AO-A0J9-01Breastbreast invasive carcinomaFemale<65III/IVChemotherapycyclophosphamidePD
RNF19ASNVMissense_Mutationc.1515G>Cp.Glu505Aspp.E505DQ9NV58protein_codingtolerated(0.23)benign(0.005)TCGA-AO-A0JD-01Breastbreast invasive carcinomaFemale<65III/IVChemotherapycyclophosphamideSD
RNF19ASNVMissense_Mutationc.1771N>Ap.Ala591Thrp.A591TQ9NV58protein_codingdeleterious(0.04)benign(0.368)TCGA-GM-A2DB-01Breastbreast invasive carcinomaFemale<65I/IIChemotherapytaxolCR
RNF19AinsertionNonsense_Mutationnovelc.2024_2025insGTTACCCAAACTGCTTCCTGTTCAGAAGTTTCACAGTTGAATCATATp.Ser675ArgfsTer14p.S675Rfs*14Q9NV58protein_codingTCGA-A2-A0CP-01Breastbreast invasive carcinomaFemale<65I/IIChemotherapycytoxanSD
RNF19AinsertionNonsense_Mutationnovelc.686_687insCACTTGCCGAAAGTGTTTTTAAGTGCATTTCTATCCCAGAp.Ala230ThrfsTer7p.A230Tfs*7Q9NV58protein_codingTCGA-A8-A090-01Breastbreast invasive carcinomaFemale>=65I/IIUnknownUnknownSD
RNF19ASNVMissense_Mutationc.1586G>Ap.Arg529Glnp.R529QQ9NV58protein_codingtolerated(0.2)possibly_damaging(0.652)TCGA-C5-A1BK-01Cervixcervical & endocervical cancerFemale<65I/IIUnknownUnknownSD
Page: 1 2 3 4 5 6 7 8 9 10 

Top

Related drugs of malignant transformation related genes

check buttonIdentification of chemicals and drugs interact with genes involved in malignant transfromation
(DGIdb 4.0)
Entrez IDSymbolCategoryInteraction TypesDrug Claim NameDrug NamePMIDs
Page: 1