
|
|||||
|
 | |
| |
| |
| |
| |
| |
|
Gene: RGCC |
Gene summary for RGCC |
| Gene information | Species | Human | Gene symbol | RGCC | Gene ID | 28984 |
| Gene name | regulator of cell cycle | |
| Gene Alias | C13orf15 | |
| Cytomap | 13q14.11 | |
| Gene Type | protein-coding | GO ID | GO:0000079 | UniProtAcc | Q9H4X1 |
Top |
Malignant transformation analysis |
| Identification of the aberrant gene expression in precancerous and cancerous lesions by comparing the gene expression of stem-like cells in diseased tissues with normal stem cells |
| Entrez ID | Symbol | Replicates | Species | Organ | Tissue | Adj P-value | Log2FC | Malignancy |
| 28984 | RGCC | GSM4909282 | Human | Breast | IDC | 5.68e-14 | -4.74e-01 | -0.0288 |
| 28984 | RGCC | GSM4909285 | Human | Breast | IDC | 4.19e-02 | -3.56e-01 | 0.21 |
| 28984 | RGCC | GSM4909286 | Human | Breast | IDC | 5.69e-07 | -4.29e-01 | 0.1081 |
| 28984 | RGCC | GSM4909287 | Human | Breast | IDC | 1.56e-07 | -4.07e-01 | 0.2057 |
| 28984 | RGCC | GSM4909290 | Human | Breast | IDC | 3.39e-10 | -4.79e-01 | 0.2096 |
| 28984 | RGCC | GSM4909291 | Human | Breast | IDC | 3.99e-02 | -3.77e-01 | 0.1753 |
| 28984 | RGCC | GSM4909293 | Human | Breast | IDC | 5.11e-13 | -4.96e-01 | 0.1581 |
| 28984 | RGCC | GSM4909294 | Human | Breast | IDC | 8.83e-15 | -4.95e-01 | 0.2022 |
| 28984 | RGCC | GSM4909296 | Human | Breast | IDC | 8.66e-19 | -5.11e-01 | 0.1524 |
| 28984 | RGCC | GSM4909297 | Human | Breast | IDC | 6.10e-15 | -4.58e-01 | 0.1517 |
| 28984 | RGCC | GSM4909298 | Human | Breast | IDC | 1.61e-06 | -4.26e-01 | 0.1551 |
| 28984 | RGCC | GSM4909301 | Human | Breast | IDC | 3.46e-17 | -5.11e-01 | 0.1577 |
| 28984 | RGCC | GSM4909302 | Human | Breast | IDC | 2.72e-07 | -3.93e-01 | 0.1545 |
| 28984 | RGCC | GSM4909304 | Human | Breast | IDC | 4.99e-18 | -5.09e-01 | 0.1636 |
| 28984 | RGCC | GSM4909306 | Human | Breast | IDC | 3.64e-09 | -4.22e-01 | 0.1564 |
| 28984 | RGCC | GSM4909307 | Human | Breast | IDC | 1.94e-16 | -5.10e-01 | 0.1569 |
| 28984 | RGCC | GSM4909308 | Human | Breast | IDC | 1.15e-13 | -4.86e-01 | 0.158 |
| 28984 | RGCC | GSM4909311 | Human | Breast | IDC | 2.43e-17 | -4.88e-01 | 0.1534 |
| 28984 | RGCC | GSM4909312 | Human | Breast | IDC | 9.92e-21 | -5.23e-01 | 0.1552 |
| 28984 | RGCC | GSM4909313 | Human | Breast | IDC | 1.35e-04 | -3.89e-01 | 0.0391 |
| Page: 1 2 3 4 5 6 7 |
| Tissue | Expression Dynamics | Abbreviation |
| Breast |  | IDC: Invasive ductal carcinoma |
| DCIS: Ductal carcinoma in situ | ||
| Precancer(BRCA1-mut): Precancerous lesion from BRCA1 mutation carriers | ||
| Cervix |  | CC: Cervix cancer |
| HSIL_HPV: HPV-infected high-grade squamous intraepithelial lesions | ||
| N_HPV: HPV-infected normal cervix | ||
| Esophagus | 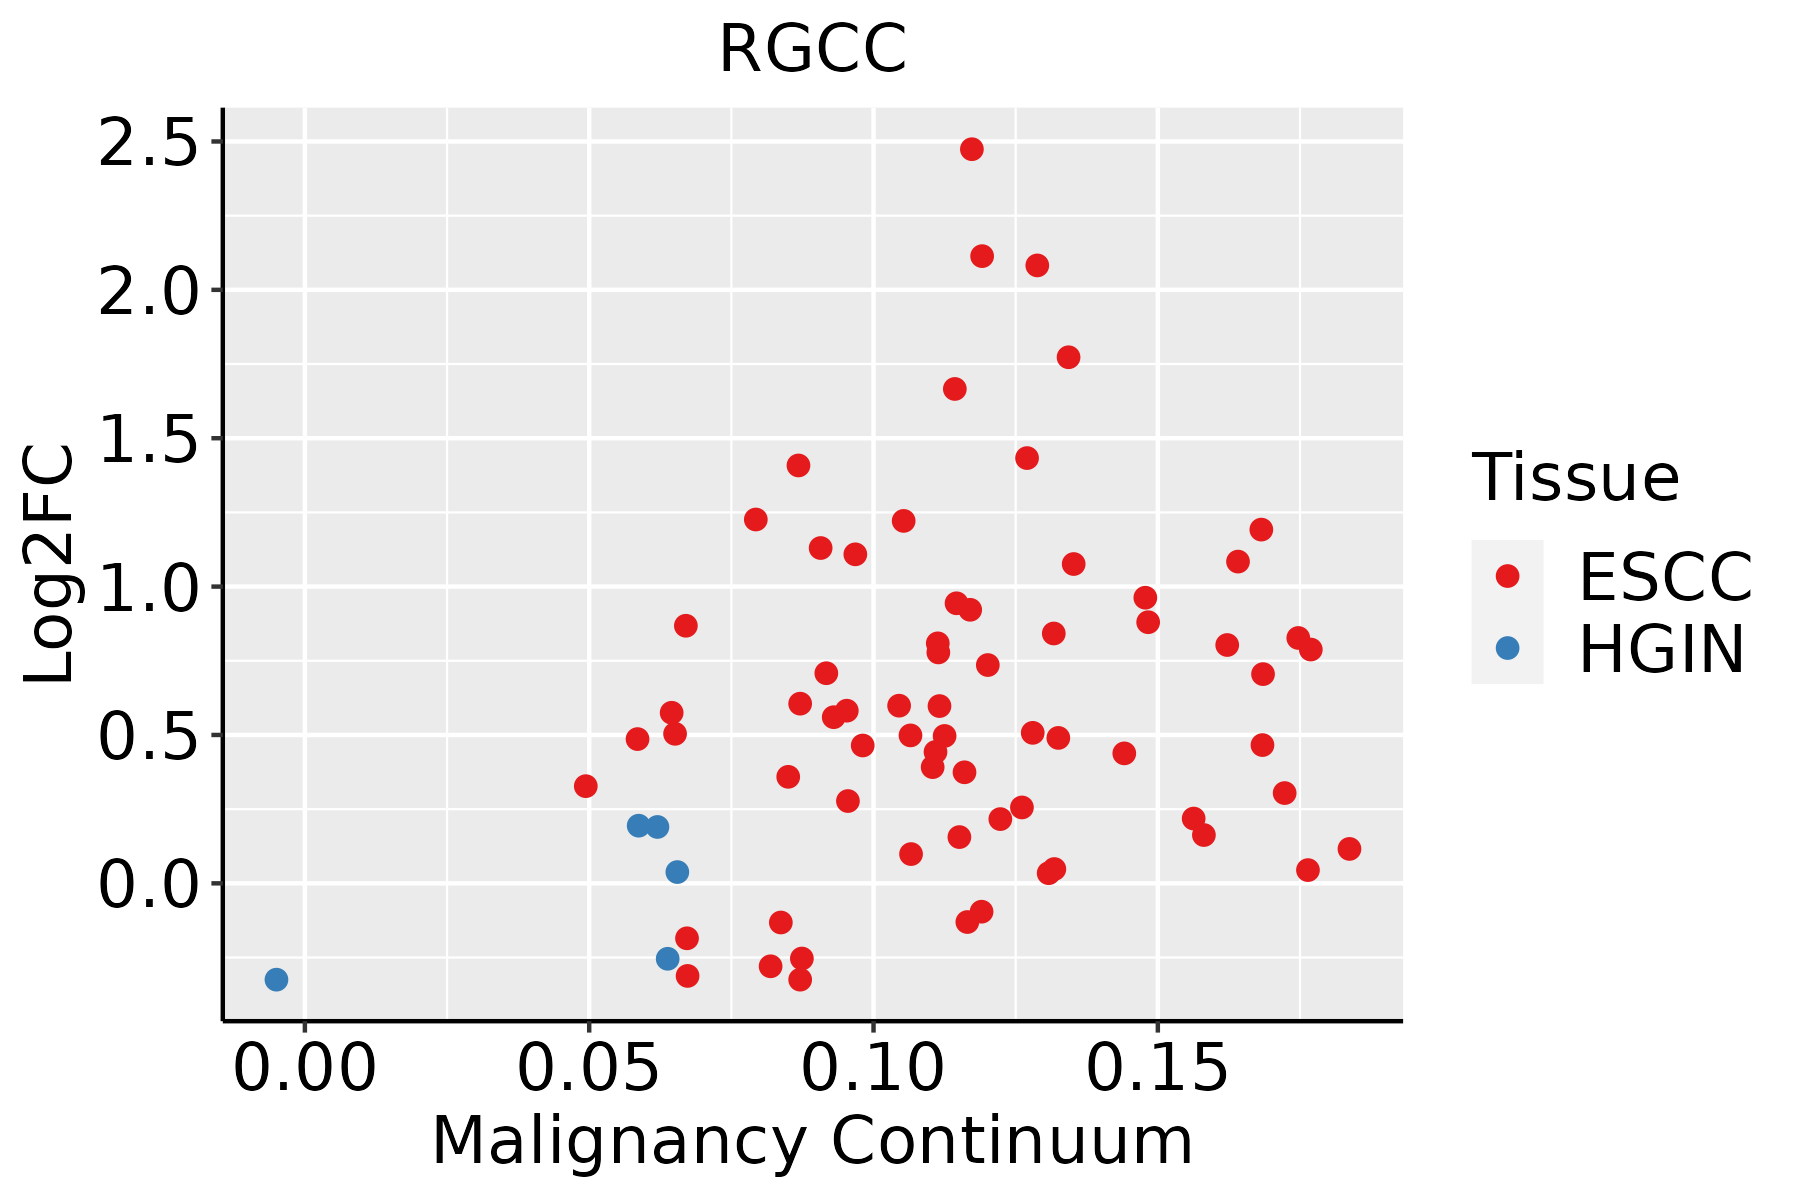 | ESCC: Esophageal squamous cell carcinoma |
| HGIN: High-grade intraepithelial neoplasias | ||
| LGIN: Low-grade intraepithelial neoplasias | ||
| Oral Cavity | 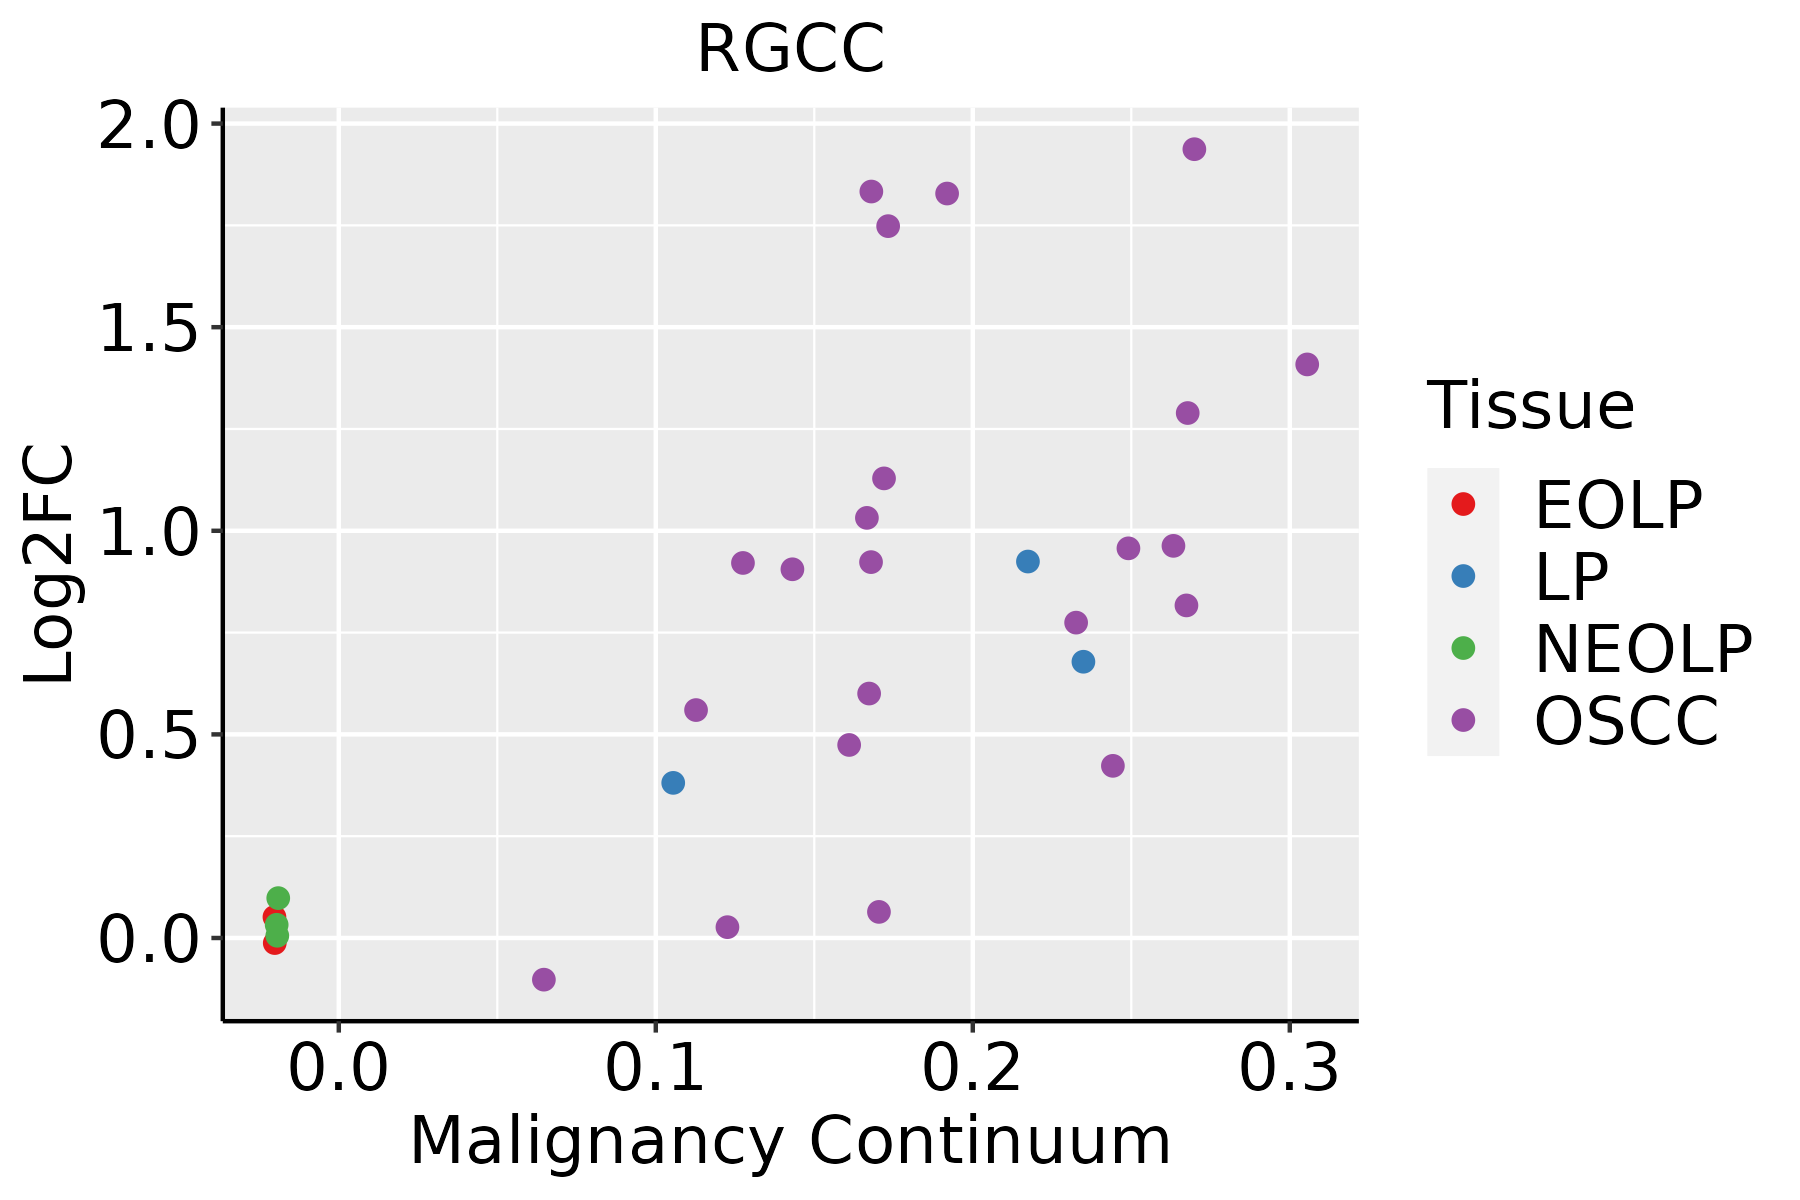 | EOLP: Erosive Oral lichen planus |
| LP: leukoplakia | ||
| NEOLP: Non-erosive oral lichen planus | ||
| OSCC: Oral squamous cell carcinoma | ||
| Prostate |  | BPH: Benign Prostatic Hyperplasia |
| Thyroid |  | ATC: Anaplastic thyroid cancer |
| HT: Hashimoto's thyroiditis | ||
| PTC: Papillary thyroid cancer |
| ∗log2FC in expression of this searched gene in stem-like cells from each diseased tissue sample relative to stem-like cells in normal samples in each tissue plotted against the malignancy continuum. Samples are colored based on if they are from different disease stage. |
Top |
Malignant transformation related pathway analysis |
| Find out the enriched GO biological processes and KEGG pathways involved in transition from healthy to precancer to cancer |
| Tissue | Disease Stage | Enriched GO biological Processes |
| Colorectum | AD |  |
| Colorectum | SER |  |
| Colorectum | MSS |  |
| Colorectum | MSI-H |  |
| Colorectum | FAP |  |
| ∗Top 15 enriched GO BP terms are showed in the bar plot of each disease state in each tissue. Each row represents a significant GO biological process which is colored according to the -log10(p.adjust). |
| Page: 1 2 3 4 5 6 7 8 9 |
| GO ID | Tissue | Disease Stage | Description | Gene Ratio | Bg Ratio | pvalue | p.adjust | Count |
| GO:000701510 | Cervix | CC | actin filament organization | 109/2311 | 442/18723 | 4.92e-13 | 2.45e-10 | 109 |
| GO:009013210 | Cervix | CC | epithelium migration | 90/2311 | 360/18723 | 2.45e-11 | 6.11e-09 | 90 |
| GO:00016679 | Cervix | CC | ameboidal-type cell migration | 110/2311 | 475/18723 | 2.66e-11 | 6.36e-09 | 110 |
| GO:001063110 | Cervix | CC | epithelial cell migration | 89/2311 | 357/18723 | 3.72e-11 | 8.54e-09 | 89 |
| GO:003297010 | Cervix | CC | regulation of actin filament-based process | 96/2311 | 397/18723 | 4.00e-11 | 8.54e-09 | 96 |
| GO:009013010 | Cervix | CC | tissue migration | 90/2311 | 365/18723 | 5.42e-11 | 1.05e-08 | 90 |
| GO:190290310 | Cervix | CC | regulation of supramolecular fiber organization | 92/2311 | 383/18723 | 1.49e-10 | 2.48e-08 | 92 |
| GO:002240710 | Cervix | CC | regulation of cell-cell adhesion | 103/2311 | 448/18723 | 1.78e-10 | 2.87e-08 | 103 |
| GO:003295610 | Cervix | CC | regulation of actin cytoskeleton organization | 86/2311 | 358/18723 | 5.90e-10 | 7.51e-08 | 86 |
| GO:00506737 | Cervix | CC | epithelial cell proliferation | 98/2311 | 437/18723 | 2.01e-09 | 2.15e-07 | 98 |
| GO:001063210 | Cervix | CC | regulation of epithelial cell migration | 72/2311 | 292/18723 | 4.52e-09 | 4.43e-07 | 72 |
| GO:003367410 | Cervix | CC | positive regulation of kinase activity | 101/2311 | 467/18723 | 8.66e-09 | 7.22e-07 | 101 |
| GO:00071626 | Cervix | CC | negative regulation of cell adhesion | 72/2311 | 303/18723 | 2.36e-08 | 1.70e-06 | 72 |
| GO:011005310 | Cervix | CC | regulation of actin filament organization | 67/2311 | 278/18723 | 4.01e-08 | 2.54e-06 | 67 |
| GO:00458608 | Cervix | CC | positive regulation of protein kinase activity | 85/2311 | 386/18723 | 5.61e-08 | 3.29e-06 | 85 |
| GO:00506787 | Cervix | CC | regulation of epithelial cell proliferation | 83/2311 | 381/18723 | 1.31e-07 | 6.42e-06 | 83 |
| GO:006157210 | Cervix | CC | actin filament bundle organization | 44/2311 | 161/18723 | 2.08e-07 | 9.34e-06 | 44 |
| GO:005101710 | Cervix | CC | actin filament bundle assembly | 43/2311 | 157/18723 | 2.66e-07 | 1.12e-05 | 43 |
| GO:00447725 | Cervix | CC | mitotic cell cycle phase transition | 89/2311 | 424/18723 | 2.70e-07 | 1.12e-05 | 89 |
| GO:00018197 | Cervix | CC | positive regulation of cytokine production | 95/2311 | 467/18723 | 4.88e-07 | 1.85e-05 | 95 |
| Page: 1 2 3 4 5 6 7 8 9 10 11 12 13 14 15 16 17 18 19 20 21 22 23 24 25 26 27 28 29 30 31 32 33 34 35 36 37 38 |
| Pathway ID | Tissue | Disease Stage | Description | Gene Ratio | Bg Ratio | pvalue | p.adjust | qvalue | Count |
| hsa0481014 | Breast | IDC | Regulation of actin cytoskeleton | 36/867 | 229/8465 | 5.79e-03 | 3.13e-02 | 2.34e-02 | 36 |
| hsa0481015 | Breast | IDC | Regulation of actin cytoskeleton | 36/867 | 229/8465 | 5.79e-03 | 3.13e-02 | 2.34e-02 | 36 |
| hsa0481023 | Breast | DCIS | Regulation of actin cytoskeleton | 35/846 | 229/8465 | 6.89e-03 | 3.37e-02 | 2.48e-02 | 35 |
| hsa0481033 | Breast | DCIS | Regulation of actin cytoskeleton | 35/846 | 229/8465 | 6.89e-03 | 3.37e-02 | 2.48e-02 | 35 |
| hsa0481016 | Cervix | CC | Regulation of actin cytoskeleton | 64/1267 | 229/8465 | 2.24e-07 | 2.59e-06 | 1.53e-06 | 64 |
| hsa0481017 | Cervix | CC | Regulation of actin cytoskeleton | 64/1267 | 229/8465 | 2.24e-07 | 2.59e-06 | 1.53e-06 | 64 |
| hsa0481028 | Esophagus | ESCC | Regulation of actin cytoskeleton | 133/4205 | 229/8465 | 5.94e-03 | 1.48e-02 | 7.56e-03 | 133 |
| hsa04810112 | Esophagus | ESCC | Regulation of actin cytoskeleton | 133/4205 | 229/8465 | 5.94e-03 | 1.48e-02 | 7.56e-03 | 133 |
| hsa0481026 | Oral cavity | OSCC | Regulation of actin cytoskeleton | 129/3704 | 229/8465 | 7.14e-05 | 2.74e-04 | 1.40e-04 | 129 |
| hsa04810111 | Oral cavity | OSCC | Regulation of actin cytoskeleton | 129/3704 | 229/8465 | 7.14e-05 | 2.74e-04 | 1.40e-04 | 129 |
| hsa0481020 | Prostate | BPH | Regulation of actin cytoskeleton | 80/1718 | 229/8465 | 1.23e-07 | 1.31e-06 | 8.10e-07 | 80 |
| hsa04810110 | Prostate | BPH | Regulation of actin cytoskeleton | 80/1718 | 229/8465 | 1.23e-07 | 1.31e-06 | 8.10e-07 | 80 |
| hsa0481025 | Prostate | Tumor | Regulation of actin cytoskeleton | 84/1791 | 229/8465 | 3.40e-08 | 4.17e-07 | 2.58e-07 | 84 |
| hsa0481035 | Prostate | Tumor | Regulation of actin cytoskeleton | 84/1791 | 229/8465 | 3.40e-08 | 4.17e-07 | 2.58e-07 | 84 |
| Page: 1 |
Top |
Cell-cell communication analysis |
| Identification of potential cell-cell interactions between two cell types and their ligand-receptor pairs for different disease states |
| Ligand | Receptor | LRpair | Pathway | Tissue | Disease Stage |
| Page: 1 |
Top |
Single-cell gene regulatory network inference analysis |
| Find out the significant the regulons (TFs) and the target genes of each regulon across cell types for different disease states |
| TF | Cell Type | Tissue | Disease Stage | Target Gene | RSS | Regulon Activity |
| ∗The dot plots of a searched regulon are shown for all cell subpopulations in each disease state of each tissue based on the regulon specific score inferred using pySCENIC and by calculating the average expression. |
| Page: 1 |
Top |
Somatic mutation of malignant transformation related genes |
| Annotation of somatic variants for genes involved in malignant transformation |
| Hugo Symbol | Variant Class | Variant Classification | dbSNP RS | HGVSc | HGVSp | HGVSp Short | SWISSPROT | BIOTYPE | SIFT | PolyPhen | Tumor Sample Barcode | Tissue | Histology | Sex | Age | Stage | Therapy Types | Drugs | Outcome |
| RGCC | SNV | Missense_Mutation | c.176N>A | p.Arg59His | p.R59H | Q9H4X1 | protein_coding | deleterious(0.03) | probably_damaging(0.917) | TCGA-CK-4951-01 | Colorectum | colon adenocarcinoma | Female | >=65 | I/II | Unknown | Unknown | PD | |
| RGCC | SNV | Missense_Mutation | c.194N>A | p.Ser65Asn | p.S65N | Q9H4X1 | protein_coding | tolerated(0.08) | possibly_damaging(0.797) | TCGA-F5-6811-01 | Colorectum | rectum adenocarcinoma | Female | >=65 | I/II | Unknown | Unknown | SD | |
| RGCC | SNV | Missense_Mutation | novel | c.206G>A | p.Ser69Asn | p.S69N | Q9H4X1 | protein_coding | tolerated(0.68) | probably_damaging(0.994) | TCGA-EY-A1GO-01 | Endometrium | uterine corpus endometrioid carcinoma | Female | >=65 | III/IV | Chemotherapy | carboplatin | PD |
| RGCC | SNV | Missense_Mutation | c.382N>T | p.Ala128Ser | p.A128S | Q9H4X1 | protein_coding | deleterious(0) | probably_damaging(0.994) | TCGA-64-5779-01 | Lung | lung adenocarcinoma | Male | <65 | III/IV | Chemotherapy | cisplatin | PD | |
| RGCC | SNV | Missense_Mutation | c.197N>G | p.Ala66Gly | p.A66G | Q9H4X1 | protein_coding | tolerated(0.06) | possibly_damaging(0.721) | TCGA-66-2754-01 | Lung | lung squamous cell carcinoma | Male | >=65 | III/IV | Unknown | Unknown | SD |
| Page: 1 |
Top |
Related drugs of malignant transformation related genes |
| Identification of chemicals and drugs interact with genes involved in malignant transfromation |
| (DGIdb 4.0) |
| Entrez ID | Symbol | Category | Interaction Types | Drug Claim Name | Drug Name | PMIDs |
| Page: 1 |

Copyright 2023-Present -The University of Texas Health Science Center at Houston |