
|
|||||
|
 | |
| |
| |
| |
| |
| |
|
Gene: PUM1 |
Gene summary for PUM1 |
| Gene information | Species | Human | Gene symbol | PUM1 | Gene ID | 9698 |
| Gene name | pumilio RNA binding family member 1 | |
| Gene Alias | HSPUM | |
| Cytomap | 1p35.2 | |
| Gene Type | protein-coding | GO ID | GO:0000003 | UniProtAcc | Q14671 |
Top |
Malignant transformation analysis |
| Identification of the aberrant gene expression in precancerous and cancerous lesions by comparing the gene expression of stem-like cells in diseased tissues with normal stem cells |
| Entrez ID | Symbol | Replicates | Species | Organ | Tissue | Adj P-value | Log2FC | Malignancy |
| 9698 | PUM1 | CCI_1 | Human | Cervix | CC | 8.86e-11 | 1.12e+00 | 0.528 |
| 9698 | PUM1 | CCI_2 | Human | Cervix | CC | 3.51e-09 | 9.74e-01 | 0.5249 |
| 9698 | PUM1 | CCI_3 | Human | Cervix | CC | 2.50e-12 | 1.06e+00 | 0.516 |
| 9698 | PUM1 | HTA11_3410_2000001011 | Human | Colorectum | AD | 1.22e-02 | -3.15e-01 | 0.0155 |
| 9698 | PUM1 | HTA11_99999965062_69753 | Human | Colorectum | MSI-H | 1.82e-02 | 5.67e-01 | 0.3487 |
| 9698 | PUM1 | HTA11_99999965104_69814 | Human | Colorectum | MSS | 5.25e-10 | 6.51e-01 | 0.281 |
| 9698 | PUM1 | F007 | Human | Colorectum | FAP | 9.80e-04 | -3.01e-01 | 0.1176 |
| 9698 | PUM1 | A002-C-010 | Human | Colorectum | FAP | 4.33e-02 | -9.39e-02 | 0.242 |
| 9698 | PUM1 | A001-C-207 | Human | Colorectum | FAP | 4.22e-02 | -1.90e-01 | 0.1278 |
| 9698 | PUM1 | A015-C-203 | Human | Colorectum | FAP | 2.35e-33 | -4.33e-01 | -0.1294 |
| 9698 | PUM1 | A015-C-204 | Human | Colorectum | FAP | 2.66e-07 | -3.37e-01 | -0.0228 |
| 9698 | PUM1 | A014-C-040 | Human | Colorectum | FAP | 5.89e-08 | -2.89e-01 | -0.1184 |
| 9698 | PUM1 | A002-C-201 | Human | Colorectum | FAP | 2.95e-18 | -3.06e-01 | 0.0324 |
| 9698 | PUM1 | A001-C-119 | Human | Colorectum | FAP | 1.06e-09 | -5.34e-02 | -0.1557 |
| 9698 | PUM1 | A001-C-108 | Human | Colorectum | FAP | 8.07e-23 | -3.17e-01 | -0.0272 |
| 9698 | PUM1 | A002-C-205 | Human | Colorectum | FAP | 1.59e-30 | -3.04e-01 | -0.1236 |
| 9698 | PUM1 | A015-C-005 | Human | Colorectum | FAP | 4.30e-04 | -1.71e-01 | -0.0336 |
| 9698 | PUM1 | A015-C-006 | Human | Colorectum | FAP | 1.63e-24 | -4.05e-01 | -0.0994 |
| 9698 | PUM1 | A015-C-106 | Human | Colorectum | FAP | 7.15e-13 | -2.29e-01 | -0.0511 |
| 9698 | PUM1 | A002-C-114 | Human | Colorectum | FAP | 2.07e-28 | -5.43e-01 | -0.1561 |
| Page: 1 2 3 4 5 6 7 8 9 10 11 |
| Tissue | Expression Dynamics | Abbreviation |
| Cervix | 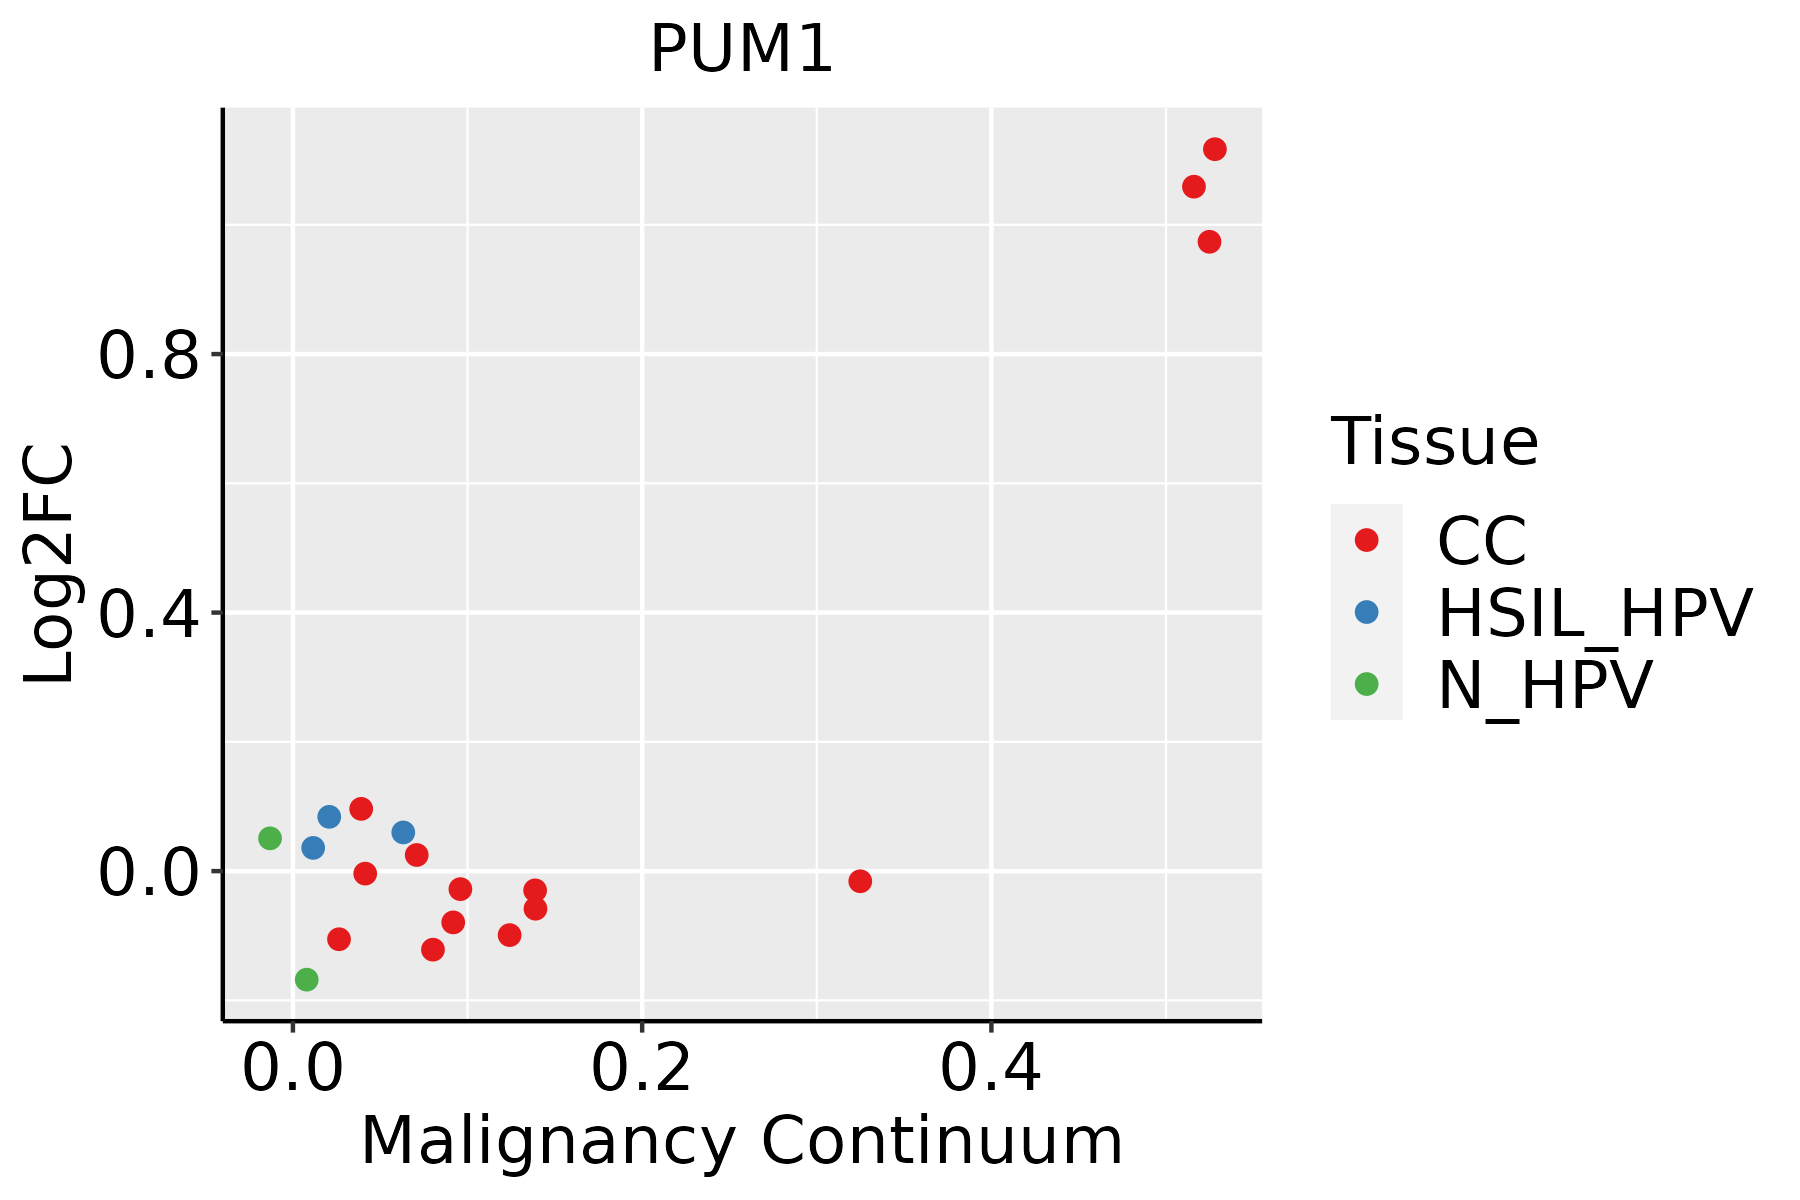 | CC: Cervix cancer |
| HSIL_HPV: HPV-infected high-grade squamous intraepithelial lesions | ||
| N_HPV: HPV-infected normal cervix | ||
| Colorectum (GSE201348) |  | FAP: Familial adenomatous polyposis |
| CRC: Colorectal cancer | ||
| Colorectum (HTA11) |  | AD: Adenomas |
| SER: Sessile serrated lesions | ||
| MSI-H: Microsatellite-high colorectal cancer | ||
| MSS: Microsatellite stable colorectal cancer | ||
| Endometrium | 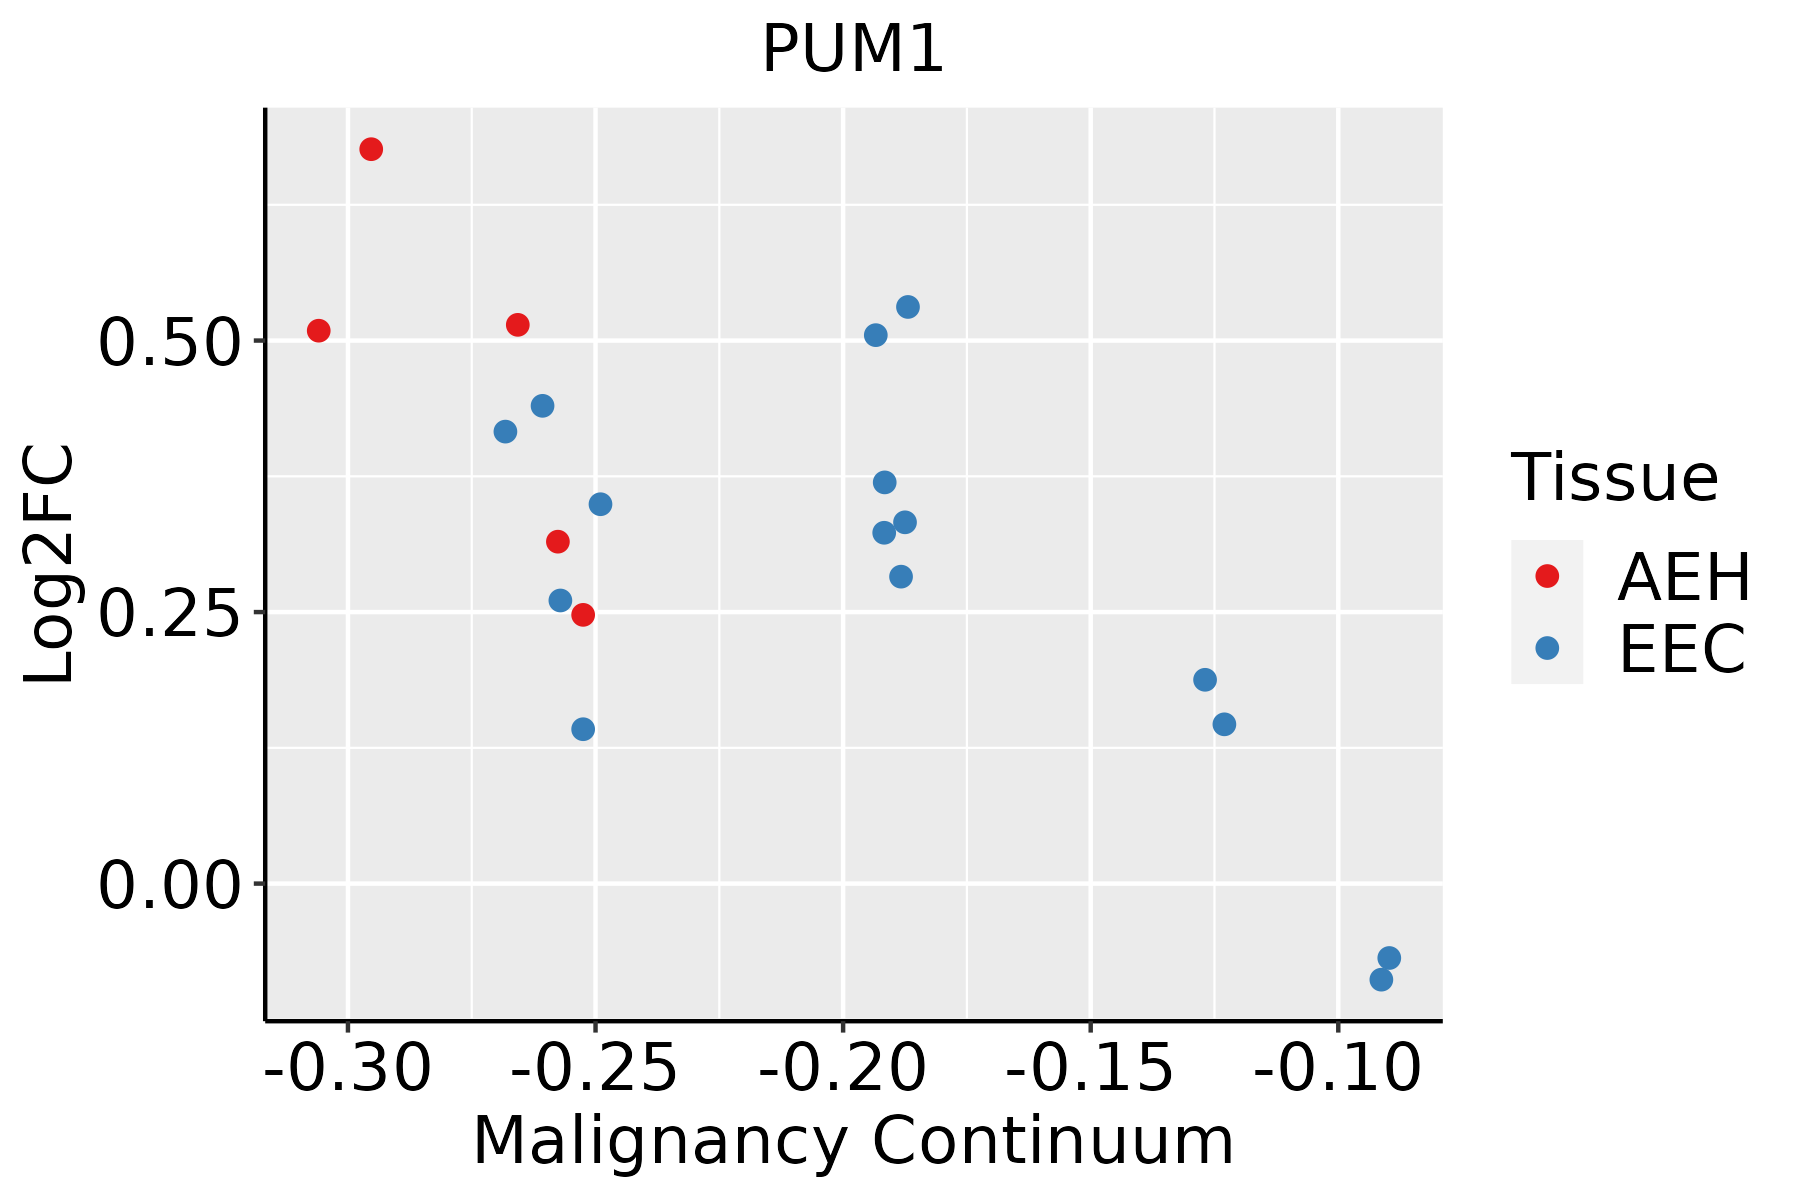 | AEH: Atypical endometrial hyperplasia |
| EEC: Endometrioid Cancer | ||
| Esophagus | 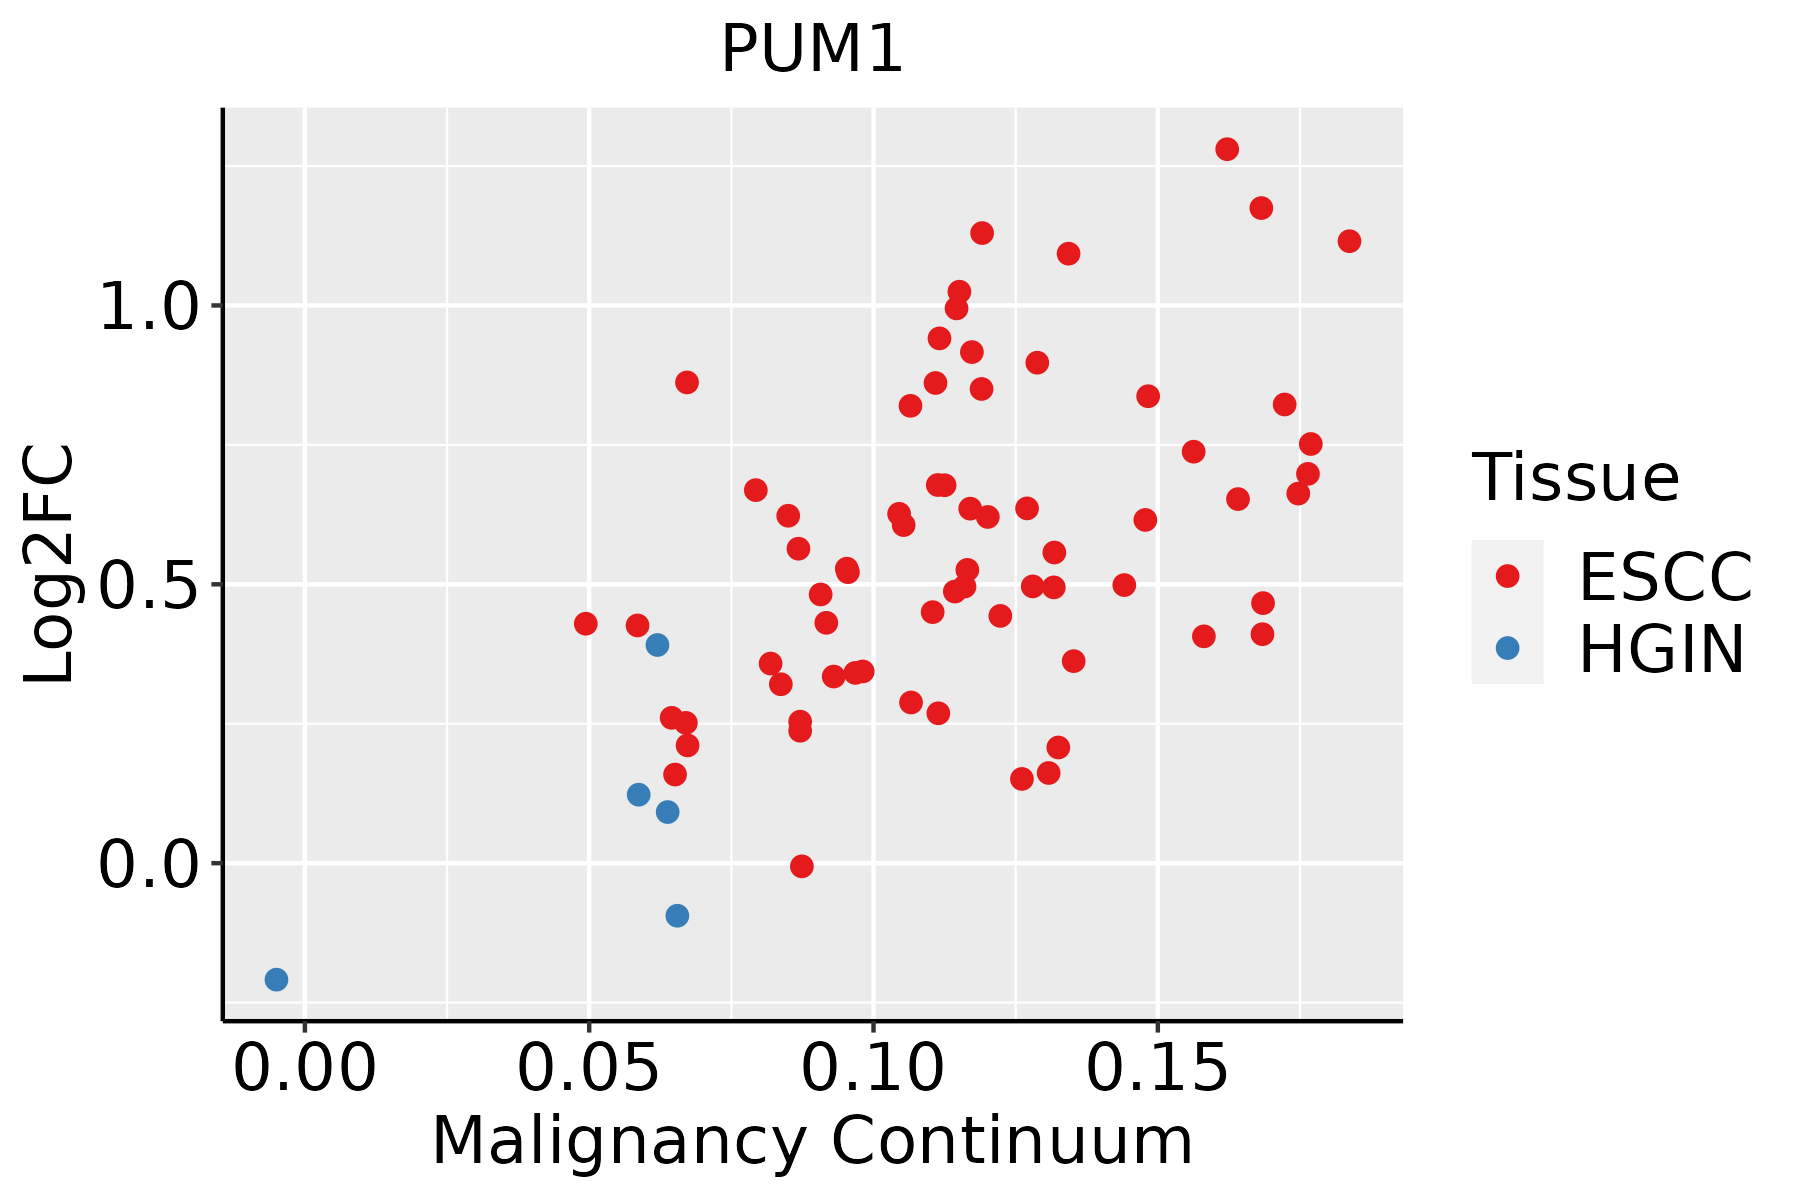 | ESCC: Esophageal squamous cell carcinoma |
| HGIN: High-grade intraepithelial neoplasias | ||
| LGIN: Low-grade intraepithelial neoplasias | ||
| Liver |  | HCC: Hepatocellular carcinoma |
| NAFLD: Non-alcoholic fatty liver disease | ||
| Lung | 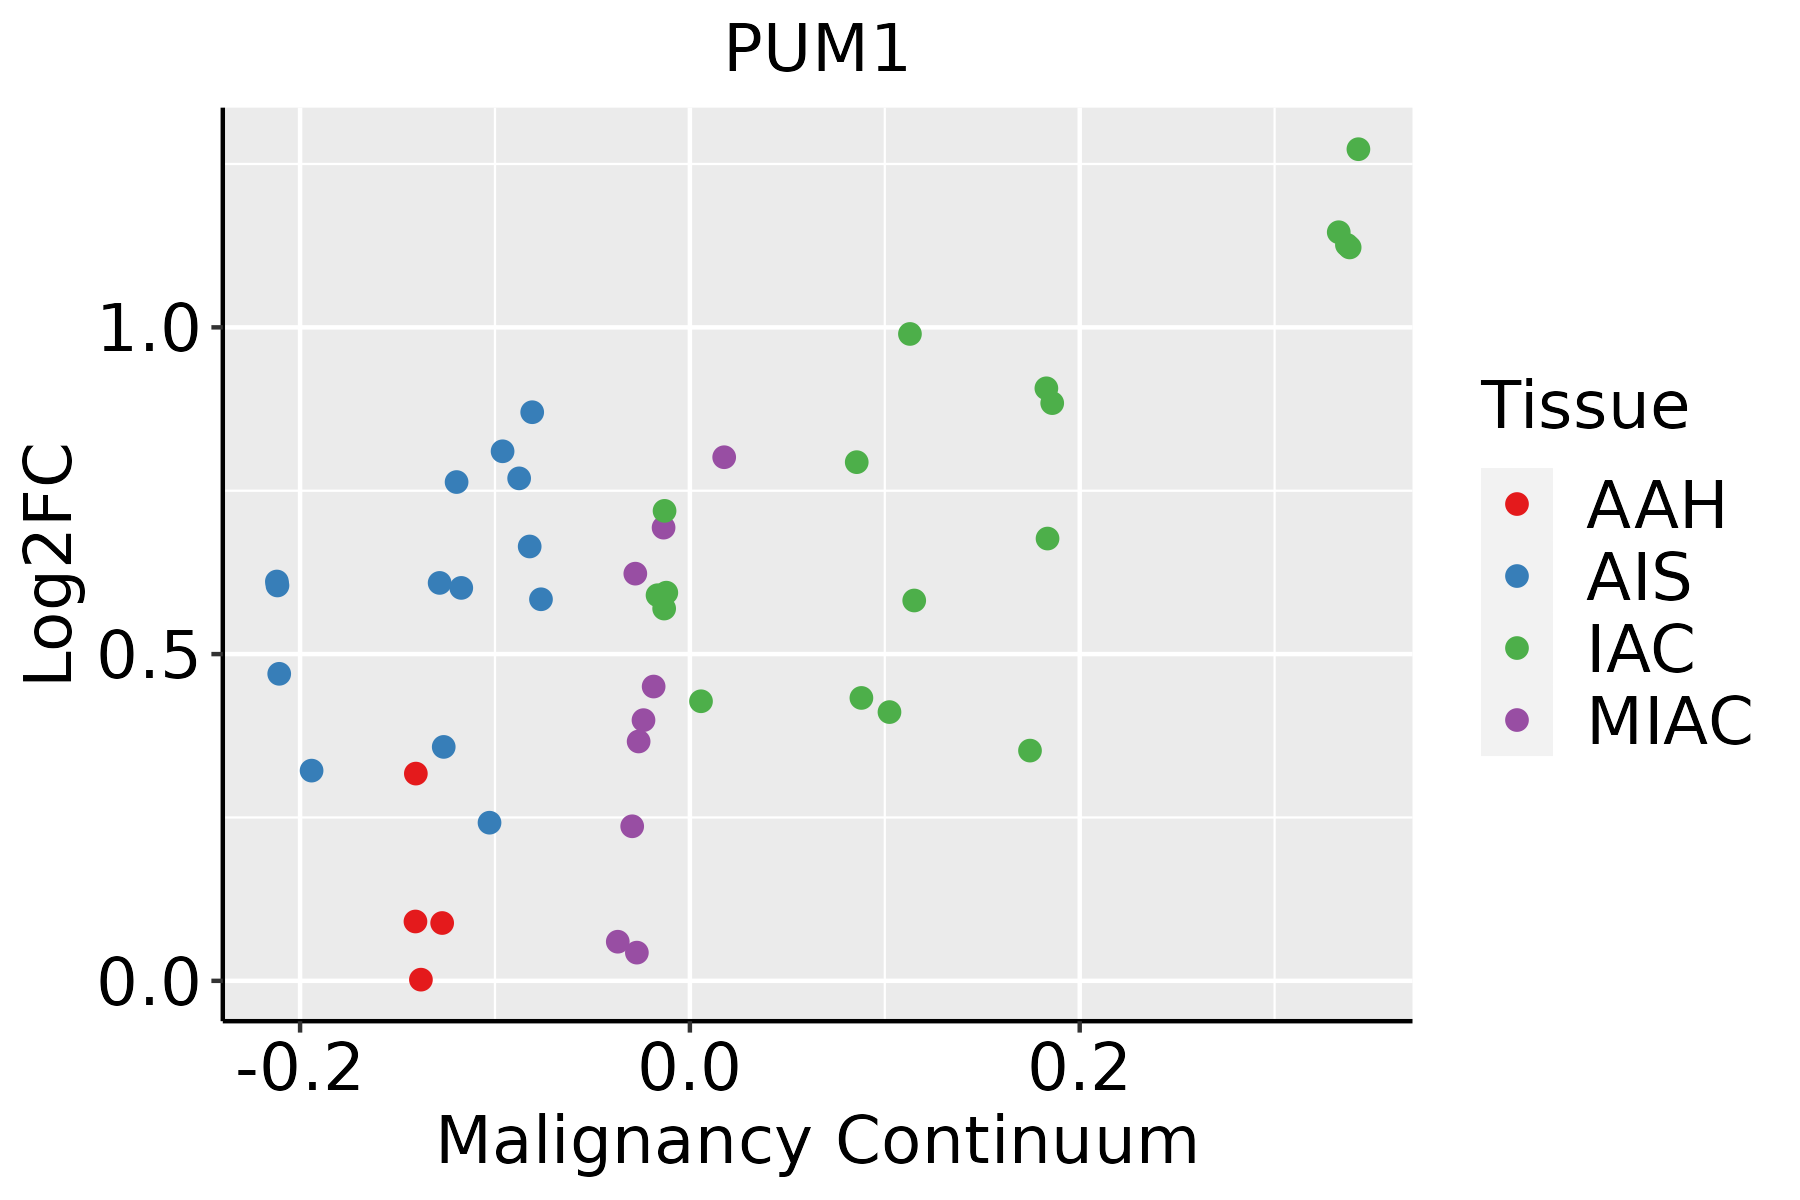 | AAH: Atypical adenomatous hyperplasia |
| AIS: Adenocarcinoma in situ | ||
| IAC: Invasive lung adenocarcinoma | ||
| MIA: Minimally invasive adenocarcinoma | ||
| Oral Cavity | 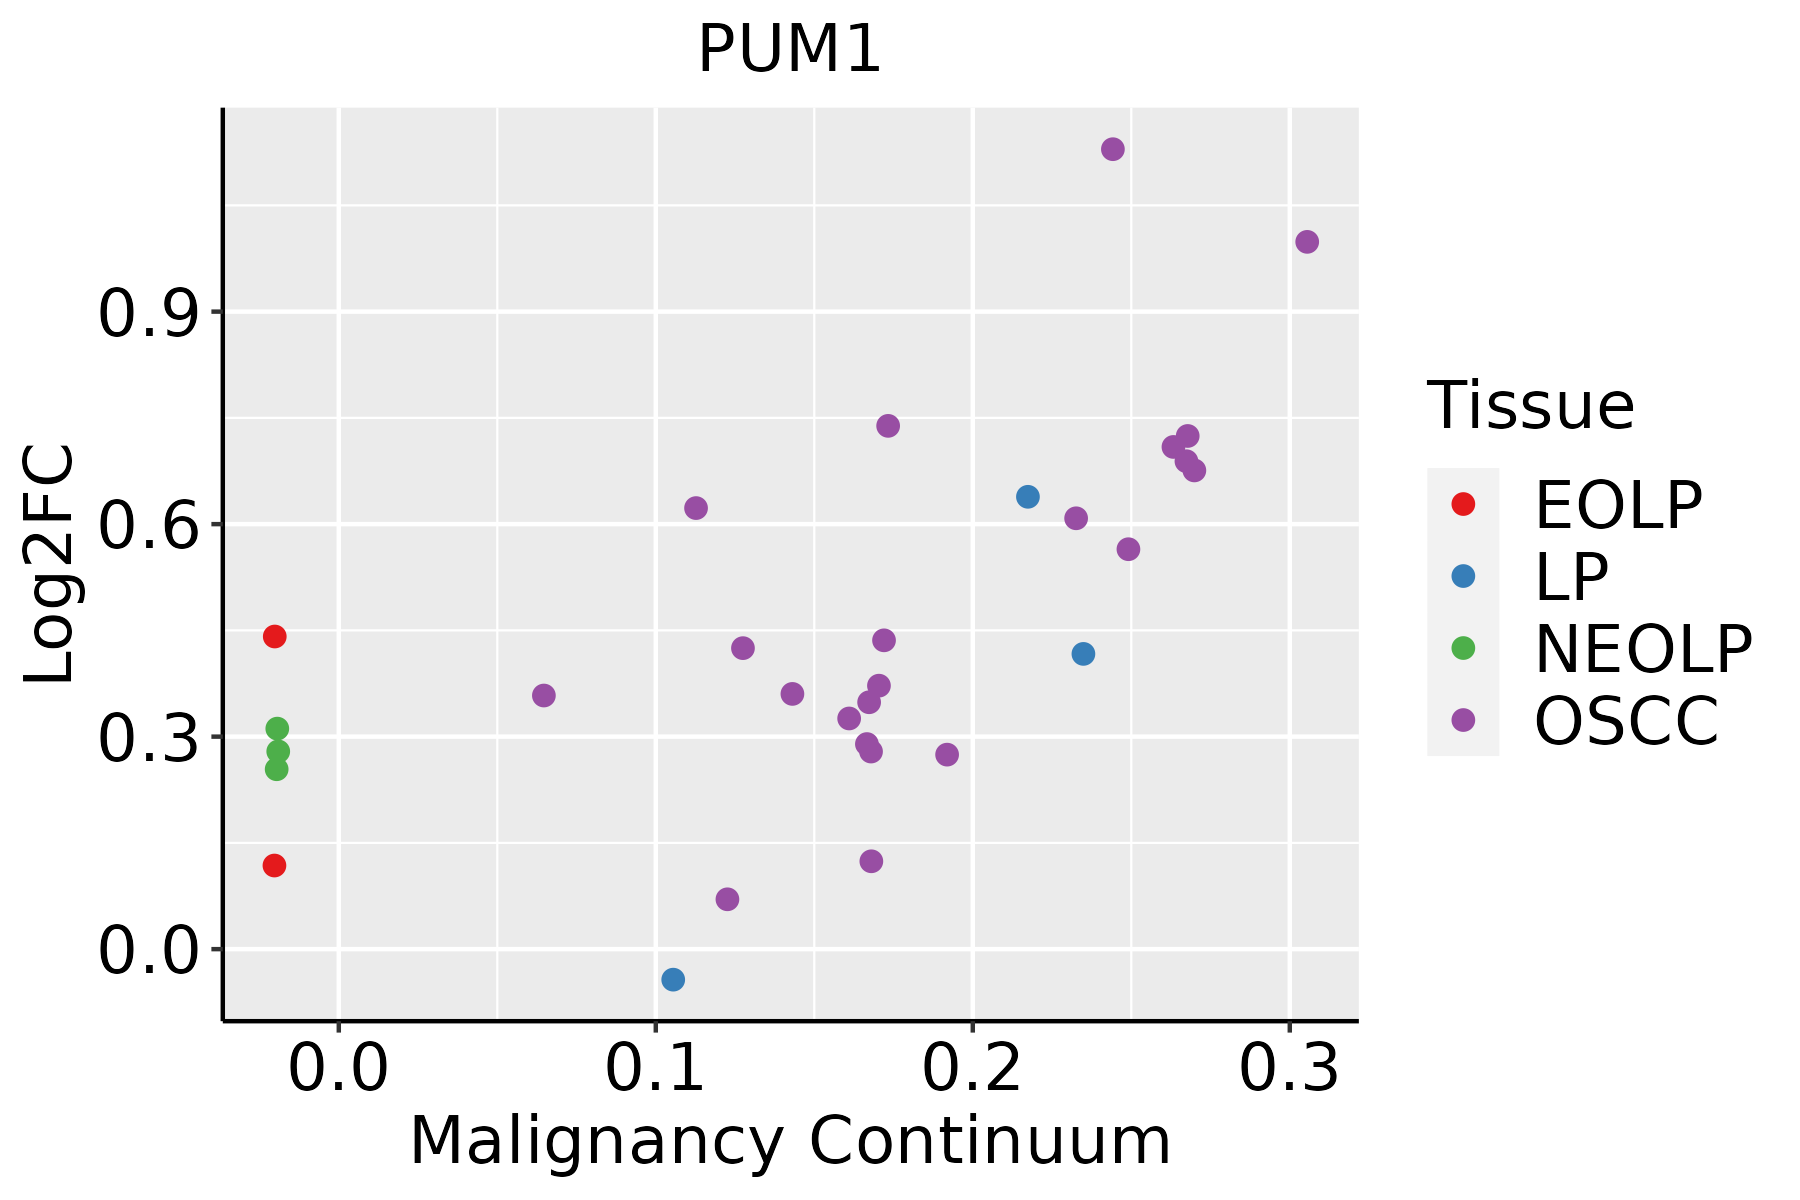 | EOLP: Erosive Oral lichen planus |
| LP: leukoplakia | ||
| NEOLP: Non-erosive oral lichen planus | ||
| OSCC: Oral squamous cell carcinoma | ||
| Prostate |  | BPH: Benign Prostatic Hyperplasia |
| Skin | 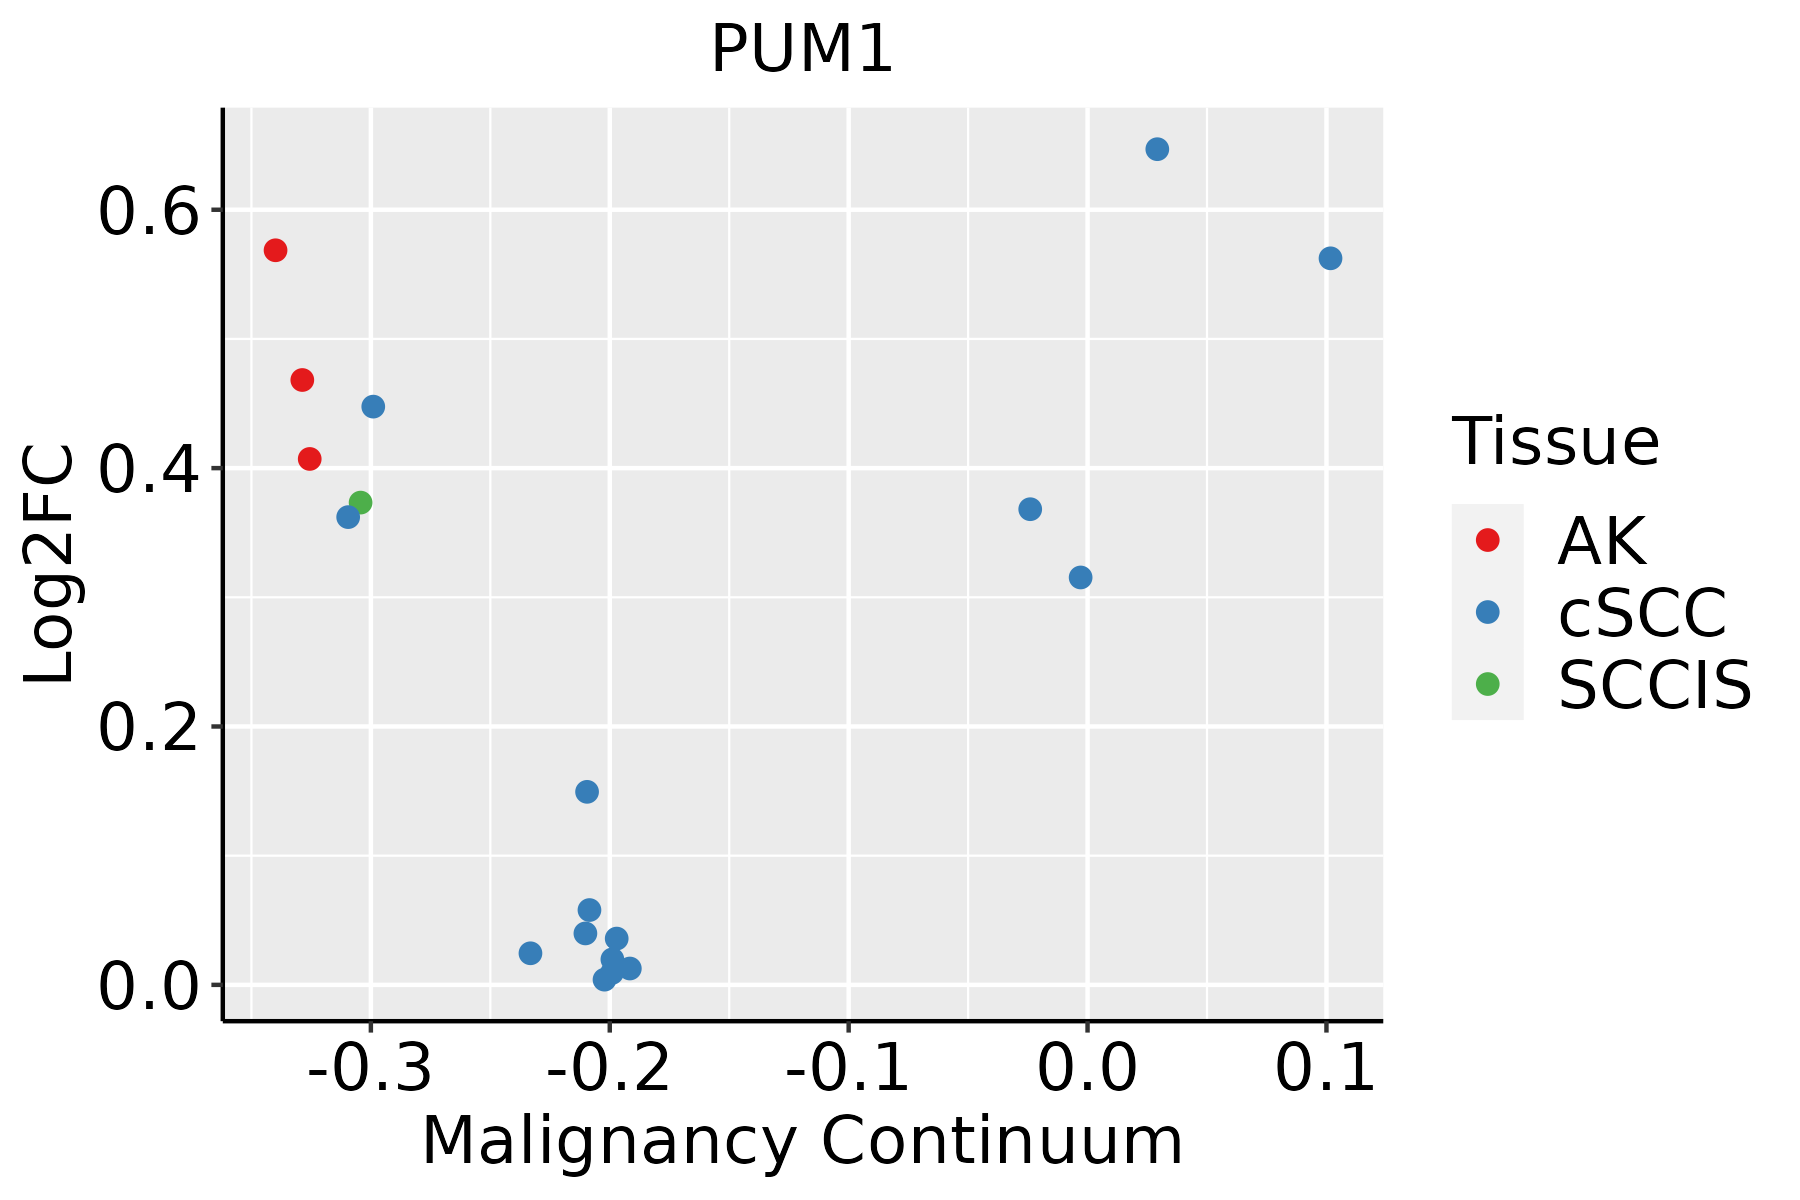 | AK: Actinic keratosis |
| cSCC: Cutaneous squamous cell carcinoma | ||
| SCCIS:squamous cell carcinoma in situ | ||
| Thyroid | 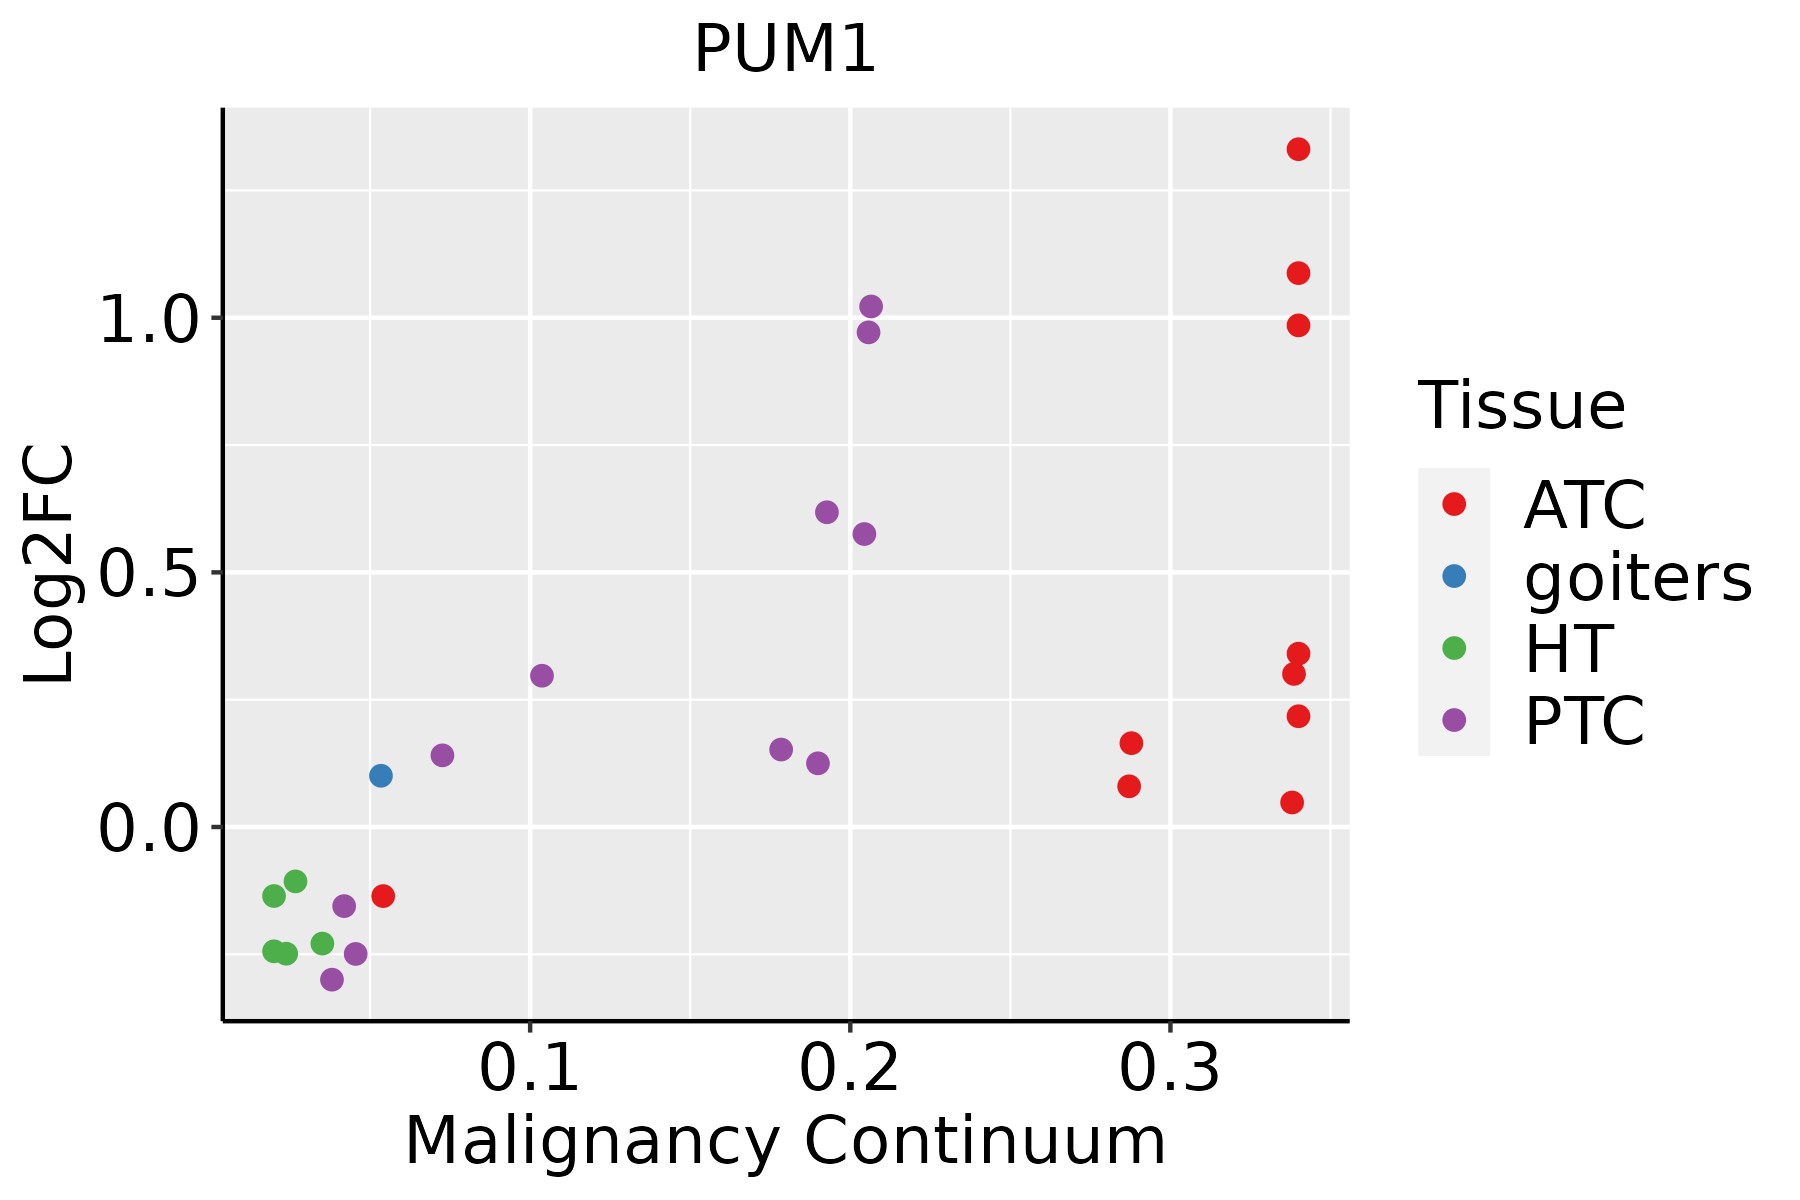 | ATC: Anaplastic thyroid cancer |
| HT: Hashimoto's thyroiditis | ||
| PTC: Papillary thyroid cancer |
| ∗log2FC in expression of this searched gene in stem-like cells from each diseased tissue sample relative to stem-like cells in normal samples in each tissue plotted against the malignancy continuum. Samples are colored based on if they are from different disease stage. |
Top |
Malignant transformation related pathway analysis |
| Find out the enriched GO biological processes and KEGG pathways involved in transition from healthy to precancer to cancer |
| Tissue | Disease Stage | Enriched GO biological Processes |
| Colorectum | AD |  |
| Colorectum | SER |  |
| Colorectum | MSS |  |
| Colorectum | MSI-H |  |
| Colorectum | FAP |  |
| ∗Top 15 enriched GO BP terms are showed in the bar plot of each disease state in each tissue. Each row represents a significant GO biological process which is colored according to the -log10(p.adjust). |
| Page: 1 2 3 4 5 6 7 8 9 |
| GO ID | Tissue | Disease Stage | Description | Gene Ratio | Bg Ratio | pvalue | p.adjust | Count |
| GO:00342491 | Colorectum | FAP | negative regulation of cellular amide metabolic process | 54/2622 | 273/18723 | 5.00e-03 | 3.33e-02 | 54 |
| GO:20006372 | Colorectum | FAP | positive regulation of gene silencing by miRNA | 10/2622 | 30/18723 | 5.90e-03 | 3.75e-02 | 10 |
| GO:0060968 | Colorectum | FAP | regulation of gene silencing | 20/2622 | 81/18723 | 7.14e-03 | 4.36e-02 | 20 |
| GO:00601481 | Colorectum | FAP | positive regulation of posttranscriptional gene silencing | 10/2622 | 31/18723 | 7.64e-03 | 4.54e-02 | 10 |
| GO:19033115 | Colorectum | CRC | regulation of mRNA metabolic process | 80/2078 | 288/18723 | 3.21e-15 | 6.40e-12 | 80 |
| GO:00098965 | Colorectum | CRC | positive regulation of catabolic process | 102/2078 | 492/18723 | 2.48e-10 | 1.06e-07 | 102 |
| GO:00313315 | Colorectum | CRC | positive regulation of cellular catabolic process | 90/2078 | 427/18723 | 1.19e-09 | 4.20e-07 | 90 |
| GO:00064025 | Colorectum | CRC | mRNA catabolic process | 58/2078 | 232/18723 | 1.77e-09 | 5.31e-07 | 58 |
| GO:00610135 | Colorectum | CRC | regulation of mRNA catabolic process | 45/2078 | 166/18723 | 8.14e-09 | 1.85e-06 | 45 |
| GO:00305224 | Colorectum | CRC | intracellular receptor signaling pathway | 61/2078 | 265/18723 | 2.00e-08 | 3.23e-06 | 61 |
| GO:00064015 | Colorectum | CRC | RNA catabolic process | 63/2078 | 278/18723 | 2.21e-08 | 3.23e-06 | 63 |
| GO:00434885 | Colorectum | CRC | regulation of mRNA stability | 40/2078 | 158/18723 | 3.96e-07 | 3.21e-05 | 40 |
| GO:00434875 | Colorectum | CRC | regulation of RNA stability | 41/2078 | 170/18723 | 1.13e-06 | 6.69e-05 | 41 |
| GO:00610143 | Colorectum | CRC | positive regulation of mRNA catabolic process | 25/2078 | 87/18723 | 5.27e-06 | 2.12e-04 | 25 |
| GO:19033133 | Colorectum | CRC | positive regulation of mRNA metabolic process | 30/2078 | 118/18723 | 9.83e-06 | 3.31e-04 | 30 |
| GO:00064175 | Colorectum | CRC | regulation of translation | 82/2078 | 468/18723 | 1.79e-05 | 5.40e-04 | 82 |
| GO:00346555 | Colorectum | CRC | nucleobase-containing compound catabolic process | 73/2078 | 407/18723 | 2.28e-05 | 6.57e-04 | 73 |
| GO:00611573 | Colorectum | CRC | mRNA destabilization | 23/2078 | 84/18723 | 2.93e-05 | 7.73e-04 | 23 |
| GO:00442705 | Colorectum | CRC | cellular nitrogen compound catabolic process | 78/2078 | 451/18723 | 4.48e-05 | 1.07e-03 | 78 |
| GO:00467005 | Colorectum | CRC | heterocycle catabolic process | 77/2078 | 445/18723 | 4.92e-05 | 1.14e-03 | 77 |
| Page: 1 2 3 4 5 6 7 8 9 10 11 12 13 14 15 16 17 18 19 20 21 22 23 24 25 26 27 28 29 30 31 32 33 34 35 36 37 38 39 40 41 42 43 |
| Pathway ID | Tissue | Disease Stage | Description | Gene Ratio | Bg Ratio | pvalue | p.adjust | qvalue | Count |
| hsa0501716 | Cervix | CC | Spinocerebellar ataxia | 35/1267 | 143/8465 | 1.77e-03 | 7.21e-03 | 4.26e-03 | 35 |
| hsa0501717 | Cervix | CC | Spinocerebellar ataxia | 35/1267 | 143/8465 | 1.77e-03 | 7.21e-03 | 4.26e-03 | 35 |
| hsa05017 | Colorectum | AD | Spinocerebellar ataxia | 60/2092 | 143/8465 | 3.78e-06 | 4.35e-05 | 2.78e-05 | 60 |
| hsa050171 | Colorectum | AD | Spinocerebellar ataxia | 60/2092 | 143/8465 | 3.78e-06 | 4.35e-05 | 2.78e-05 | 60 |
| hsa050174 | Colorectum | MSS | Spinocerebellar ataxia | 60/1875 | 143/8465 | 7.14e-08 | 1.26e-06 | 7.71e-07 | 60 |
| hsa050175 | Colorectum | MSS | Spinocerebellar ataxia | 60/1875 | 143/8465 | 7.14e-08 | 1.26e-06 | 7.71e-07 | 60 |
| hsa050176 | Colorectum | MSI-H | Spinocerebellar ataxia | 33/797 | 143/8465 | 8.28e-07 | 1.49e-05 | 1.25e-05 | 33 |
| hsa050177 | Colorectum | MSI-H | Spinocerebellar ataxia | 33/797 | 143/8465 | 8.28e-07 | 1.49e-05 | 1.25e-05 | 33 |
| hsa050178 | Colorectum | FAP | Spinocerebellar ataxia | 37/1404 | 143/8465 | 2.94e-03 | 1.29e-02 | 7.86e-03 | 37 |
| hsa050179 | Colorectum | FAP | Spinocerebellar ataxia | 37/1404 | 143/8465 | 2.94e-03 | 1.29e-02 | 7.86e-03 | 37 |
| hsa0501718 | Endometrium | AEH | Spinocerebellar ataxia | 43/1197 | 143/8465 | 5.92e-07 | 7.69e-06 | 5.63e-06 | 43 |
| hsa0501719 | Endometrium | AEH | Spinocerebellar ataxia | 43/1197 | 143/8465 | 5.92e-07 | 7.69e-06 | 5.63e-06 | 43 |
| hsa0501723 | Endometrium | EEC | Spinocerebellar ataxia | 43/1237 | 143/8465 | 1.46e-06 | 2.01e-05 | 1.50e-05 | 43 |
| hsa0501733 | Endometrium | EEC | Spinocerebellar ataxia | 43/1237 | 143/8465 | 1.46e-06 | 2.01e-05 | 1.50e-05 | 43 |
| hsa0501728 | Esophagus | ESCC | Spinocerebellar ataxia | 94/4205 | 143/8465 | 6.77e-05 | 2.90e-04 | 1.48e-04 | 94 |
| hsa0501736 | Esophagus | ESCC | Spinocerebellar ataxia | 94/4205 | 143/8465 | 6.77e-05 | 2.90e-04 | 1.48e-04 | 94 |
| hsa0501710 | Liver | Cirrhotic | Spinocerebellar ataxia | 66/2530 | 143/8465 | 2.58e-05 | 2.15e-04 | 1.32e-04 | 66 |
| hsa0501711 | Liver | Cirrhotic | Spinocerebellar ataxia | 66/2530 | 143/8465 | 2.58e-05 | 2.15e-04 | 1.32e-04 | 66 |
| hsa0501721 | Liver | HCC | Spinocerebellar ataxia | 92/4020 | 143/8465 | 3.20e-05 | 1.88e-04 | 1.04e-04 | 92 |
| hsa0501731 | Liver | HCC | Spinocerebellar ataxia | 92/4020 | 143/8465 | 3.20e-05 | 1.88e-04 | 1.04e-04 | 92 |
| Page: 1 2 |
Top |
Cell-cell communication analysis |
| Identification of potential cell-cell interactions between two cell types and their ligand-receptor pairs for different disease states |
| Ligand | Receptor | LRpair | Pathway | Tissue | Disease Stage |
| Page: 1 |
Top |
Single-cell gene regulatory network inference analysis |
| Find out the significant the regulons (TFs) and the target genes of each regulon across cell types for different disease states |
| TF | Cell Type | Tissue | Disease Stage | Target Gene | RSS | Regulon Activity |
| ∗The dot plots of a searched regulon are shown for all cell subpopulations in each disease state of each tissue based on the regulon specific score inferred using pySCENIC and by calculating the average expression. |
| Page: 1 |
Top |
Somatic mutation of malignant transformation related genes |
| Annotation of somatic variants for genes involved in malignant transformation |
| Hugo Symbol | Variant Class | Variant Classification | dbSNP RS | HGVSc | HGVSp | HGVSp Short | SWISSPROT | BIOTYPE | SIFT | PolyPhen | Tumor Sample Barcode | Tissue | Histology | Sex | Age | Stage | Therapy Types | Drugs | Outcome |
| PUM1 | SNV | Missense_Mutation | novel | c.2154N>C | p.Lys718Asn | p.K718N | Q14671 | protein_coding | deleterious(0.02) | benign(0.168) | TCGA-3C-AALI-01 | Breast | breast invasive carcinoma | Female | <65 | I/II | Unspecific | Poly E | Complete Response |
| PUM1 | SNV | Missense_Mutation | novel | c.577N>G | p.Arg193Gly | p.R193G | Q14671 | protein_coding | deleterious_low_confidence(0) | benign(0.445) | TCGA-AR-A2LJ-01 | Breast | breast invasive carcinoma | Female | <65 | III/IV | Chemotherapy | adriamycin | SD |
| PUM1 | SNV | Missense_Mutation | rs560648926 | c.1145N>G | p.Asn382Ser | p.N382S | Q14671 | protein_coding | tolerated_low_confidence(0.27) | benign(0.068) | TCGA-B6-A0I1-01 | Breast | breast invasive carcinoma | Female | >=65 | I/II | Unknown | Unknown | PD |
| PUM1 | SNV | Missense_Mutation | c.2282N>T | p.Pro761Leu | p.P761L | Q14671 | protein_coding | deleterious(0) | benign(0.201) | TCGA-E2-A159-01 | Breast | breast invasive carcinoma | Female | <65 | I/II | Chemotherapy | cyclophosphamide | SD | |
| PUM1 | SNV | Missense_Mutation | novel | c.3214N>A | p.Leu1072Ile | p.L1072I | Q14671 | protein_coding | deleterious(0.01) | benign(0.208) | TCGA-E9-A54X-01 | Breast | breast invasive carcinoma | Female | >=65 | I/II | Unknown | Unknown | SD |
| PUM1 | SNV | Missense_Mutation | novel | c.271N>A | p.Glu91Lys | p.E91K | Q14671 | protein_coding | deleterious_low_confidence(0.01) | benign(0.074) | TCGA-EW-A3E8-01 | Breast | breast invasive carcinoma | Female | <65 | I/II | Hormone Therapy | anastrozole | SD |
| PUM1 | SNV | Missense_Mutation | novel | c.2386C>T | p.Arg796Cys | p.R796C | Q14671 | protein_coding | deleterious(0) | probably_damaging(0.91) | TCGA-LL-A8F5-01 | Breast | breast invasive carcinoma | Female | <65 | I/II | Chemotherapy | cyclophosphamide | SD |
| PUM1 | insertion | Nonsense_Mutation | novel | c.2299_2300insCTAGATGTAGAGTCACCATATAATGTATCATGCAAACC | p.Gly767AlafsTer8 | p.G767Afs*8 | Q14671 | protein_coding | TCGA-A2-A0CP-01 | Breast | breast invasive carcinoma | Female | <65 | I/II | Chemotherapy | cytoxan | SD | ||
| PUM1 | insertion | In_Frame_Ins | novel | c.2594_2595insAACAGGAGC | p.Phe865delinsLeuThrGlyAla | p.F865delinsLTGA | Q14671 | protein_coding | TCGA-B6-A0IK-01 | Breast | breast invasive carcinoma | Female | <65 | III/IV | Unknown | Unknown | PD | ||
| PUM1 | insertion | Frame_Shift_Ins | novel | c.2592_2593insG | p.Phe865ValfsTer13 | p.F865Vfs*13 | Q14671 | protein_coding | TCGA-B6-A0IK-01 | Breast | breast invasive carcinoma | Female | <65 | III/IV | Unknown | Unknown | PD |
| Page: 1 2 3 4 5 6 7 8 9 10 11 12 13 |
Top |
Related drugs of malignant transformation related genes |
| Identification of chemicals and drugs interact with genes involved in malignant transfromation |
| (DGIdb 4.0) |
| Entrez ID | Symbol | Category | Interaction Types | Drug Claim Name | Drug Name | PMIDs |
| Page: 1 |

Copyright 2023-Present -The University of Texas Health Science Center at Houston |