
|
|||||
|
 | |
| |
| |
| |
| |
| |
|
Gene: PTPN6 |
Gene summary for PTPN6 |
| Gene information | Species | Human | Gene symbol | PTPN6 | Gene ID | 5777 |
| Gene name | protein tyrosine phosphatase non-receptor type 6 | |
| Gene Alias | HCP | |
| Cytomap | 12p13.31 | |
| Gene Type | protein-coding | GO ID | GO:0000003 | UniProtAcc | P29350 |
Top |
Malignant transformation analysis |
| Identification of the aberrant gene expression in precancerous and cancerous lesions by comparing the gene expression of stem-like cells in diseased tissues with normal stem cells |
| Entrez ID | Symbol | Replicates | Species | Organ | Tissue | Adj P-value | Log2FC | Malignancy |
| 5777 | PTPN6 | LZE4T | Human | Esophagus | ESCC | 4.31e-11 | 2.91e-01 | 0.0811 |
| 5777 | PTPN6 | LZE5T | Human | Esophagus | ESCC | 3.48e-02 | 2.16e-01 | 0.0514 |
| 5777 | PTPN6 | LZE7T | Human | Esophagus | ESCC | 6.00e-14 | 5.70e-01 | 0.0667 |
| 5777 | PTPN6 | LZE8T | Human | Esophagus | ESCC | 1.15e-17 | 4.98e-01 | 0.067 |
| 5777 | PTPN6 | LZE20T | Human | Esophagus | ESCC | 2.50e-06 | 2.04e-01 | 0.0662 |
| 5777 | PTPN6 | LZE21D1 | Human | Esophagus | HGIN | 4.54e-03 | 3.59e-01 | 0.0632 |
| 5777 | PTPN6 | LZE22T | Human | Esophagus | ESCC | 4.85e-11 | 5.72e-01 | 0.068 |
| 5777 | PTPN6 | LZE24T | Human | Esophagus | ESCC | 1.54e-21 | 4.93e-01 | 0.0596 |
| 5777 | PTPN6 | LZE21T | Human | Esophagus | ESCC | 9.89e-10 | 5.68e-01 | 0.0655 |
| 5777 | PTPN6 | LZE6T | Human | Esophagus | ESCC | 2.57e-08 | 5.67e-01 | 0.0845 |
| 5777 | PTPN6 | P1T-E | Human | Esophagus | ESCC | 6.04e-18 | 5.64e-01 | 0.0875 |
| 5777 | PTPN6 | P2T-E | Human | Esophagus | ESCC | 4.18e-13 | 2.63e-01 | 0.1177 |
| 5777 | PTPN6 | P4T-E | Human | Esophagus | ESCC | 2.09e-41 | 8.67e-01 | 0.1323 |
| 5777 | PTPN6 | P5T-E | Human | Esophagus | ESCC | 1.11e-09 | 2.01e-01 | 0.1327 |
| 5777 | PTPN6 | P8T-E | Human | Esophagus | ESCC | 8.40e-34 | 6.35e-01 | 0.0889 |
| 5777 | PTPN6 | P9T-E | Human | Esophagus | ESCC | 1.10e-14 | 2.05e-01 | 0.1131 |
| 5777 | PTPN6 | P11T-E | Human | Esophagus | ESCC | 4.12e-07 | 3.00e-01 | 0.1426 |
| 5777 | PTPN6 | P15T-E | Human | Esophagus | ESCC | 2.28e-20 | 3.89e-01 | 0.1149 |
| 5777 | PTPN6 | P17T-E | Human | Esophagus | ESCC | 8.27e-04 | 2.64e-01 | 0.1278 |
| 5777 | PTPN6 | P20T-E | Human | Esophagus | ESCC | 1.22e-21 | 4.58e-01 | 0.1124 |
| Page: 1 2 3 4 |
| Tissue | Expression Dynamics | Abbreviation |
| Esophagus |  | ESCC: Esophageal squamous cell carcinoma |
| HGIN: High-grade intraepithelial neoplasias | ||
| LGIN: Low-grade intraepithelial neoplasias | ||
| Oral Cavity | 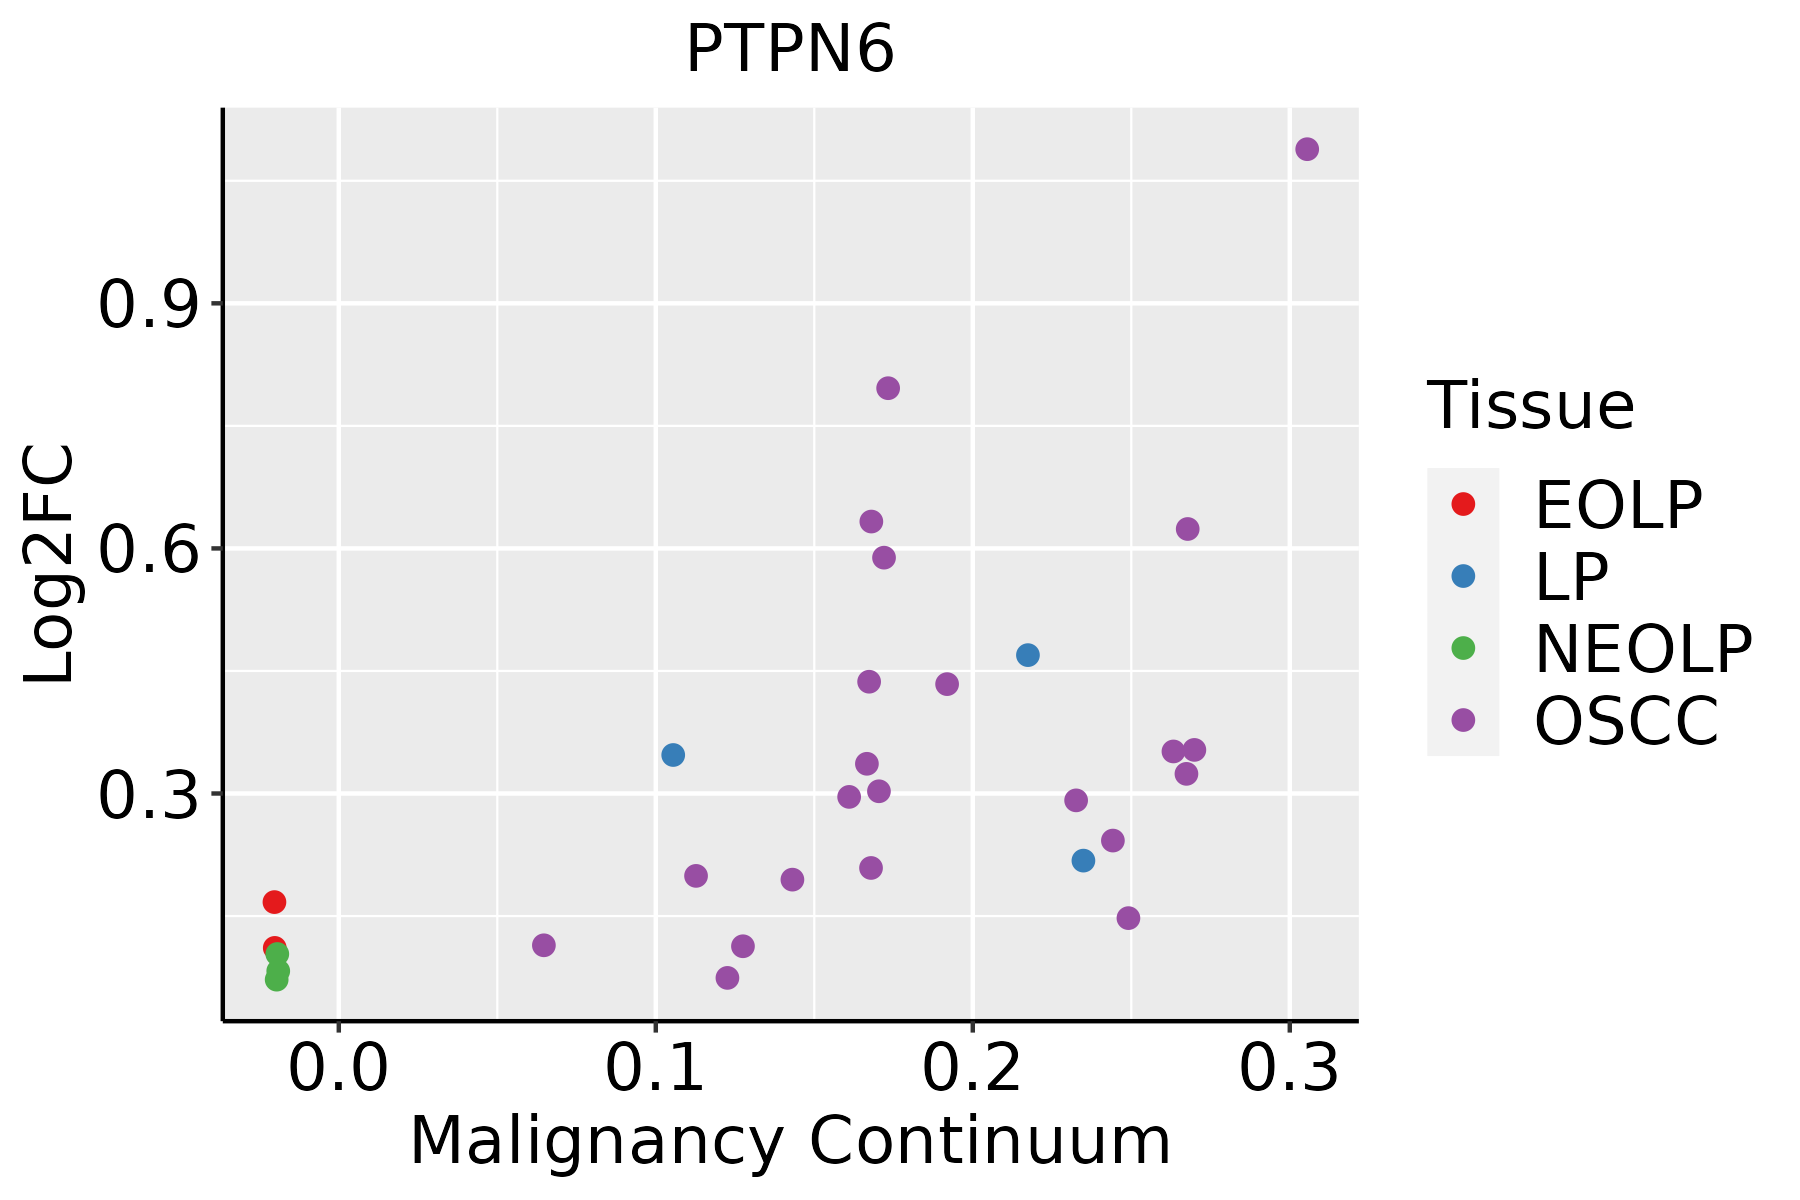 | EOLP: Erosive Oral lichen planus |
| LP: leukoplakia | ||
| NEOLP: Non-erosive oral lichen planus | ||
| OSCC: Oral squamous cell carcinoma |
| ∗log2FC in expression of this searched gene in stem-like cells from each diseased tissue sample relative to stem-like cells in normal samples in each tissue plotted against the malignancy continuum. Samples are colored based on if they are from different disease stage. |
Top |
Malignant transformation related pathway analysis |
| Find out the enriched GO biological processes and KEGG pathways involved in transition from healthy to precancer to cancer |
| Tissue | Disease Stage | Enriched GO biological Processes |
| Colorectum | AD |  |
| Colorectum | SER |  |
| Colorectum | MSS |  |
| Colorectum | MSI-H |  |
| Colorectum | FAP |  |
| ∗Top 15 enriched GO BP terms are showed in the bar plot of each disease state in each tissue. Each row represents a significant GO biological process which is colored according to the -log10(p.adjust). |
| Page: 1 2 3 4 5 6 7 8 9 |
| GO ID | Tissue | Disease Stage | Description | Gene Ratio | Bg Ratio | pvalue | p.adjust | Count |
| GO:0050732 | Oral cavity | OSCC | negative regulation of peptidyl-tyrosine phosphorylation | 35/7305 | 59/18723 | 1.24e-03 | 6.23e-03 | 35 |
| GO:002240917 | Oral cavity | OSCC | positive regulation of cell-cell adhesion | 136/7305 | 284/18723 | 1.35e-03 | 6.62e-03 | 136 |
| GO:19028064 | Oral cavity | OSCC | regulation of cell cycle G1/S phase transition | 84/7305 | 168/18723 | 2.38e-03 | 1.05e-02 | 84 |
| GO:190303910 | Oral cavity | OSCC | positive regulation of leukocyte cell-cell adhesion | 115/7305 | 239/18723 | 2.48e-03 | 1.09e-02 | 115 |
| GO:0033630 | Oral cavity | OSCC | positive regulation of cell adhesion mediated by integrin | 15/7305 | 21/18723 | 2.65e-03 | 1.16e-02 | 15 |
| GO:00027646 | Oral cavity | OSCC | immune response-regulating signaling pathway | 212/7305 | 468/18723 | 2.93e-03 | 1.27e-02 | 212 |
| GO:005087010 | Oral cavity | OSCC | positive regulation of T cell activation | 104/7305 | 216/18723 | 3.76e-03 | 1.55e-02 | 104 |
| GO:00603484 | Oral cavity | OSCC | bone development | 99/7305 | 205/18723 | 4.13e-03 | 1.68e-02 | 99 |
| GO:007052718 | Oral cavity | OSCC | platelet aggregation | 37/7305 | 67/18723 | 5.14e-03 | 2.01e-02 | 37 |
| GO:00987513 | Oral cavity | OSCC | bone cell development | 21/7305 | 34/18723 | 6.02e-03 | 2.28e-02 | 21 |
| GO:0035855 | Oral cavity | OSCC | megakaryocyte development | 12/7305 | 17/18723 | 8.40e-03 | 3.05e-02 | 12 |
| GO:00508564 | Oral cavity | OSCC | regulation of T cell receptor signaling pathway | 24/7305 | 41/18723 | 8.81e-03 | 3.19e-02 | 24 |
| GO:00615153 | Oral cavity | OSCC | myeloid cell development | 38/7305 | 71/18723 | 9.12e-03 | 3.27e-02 | 38 |
| GO:00706618 | Oral cavity | OSCC | leukocyte proliferation | 145/7305 | 318/18723 | 9.31e-03 | 3.33e-02 | 145 |
| GO:00703716 | Oral cavity | OSCC | ERK1 and ERK2 cascade | 150/7305 | 330/18723 | 9.47e-03 | 3.38e-02 | 150 |
| GO:00075969 | Oral cavity | OSCC | blood coagulation | 102/7305 | 217/18723 | 9.69e-03 | 3.43e-02 | 102 |
| GO:00022445 | Oral cavity | OSCC | hematopoietic progenitor cell differentiation | 57/7305 | 114/18723 | 1.09e-02 | 3.71e-02 | 57 |
| GO:00456194 | Oral cavity | OSCC | regulation of lymphocyte differentiation | 83/7305 | 174/18723 | 1.18e-02 | 4.00e-02 | 83 |
| GO:00703724 | Oral cavity | OSCC | regulation of ERK1 and ERK2 cascade | 140/7305 | 309/18723 | 1.34e-02 | 4.46e-02 | 140 |
| GO:00224086 | Oral cavity | OSCC | negative regulation of cell-cell adhesion | 92/7305 | 196/18723 | 1.41e-02 | 4.64e-02 | 92 |
| Page: 1 2 3 4 5 6 7 8 9 |
| Pathway ID | Tissue | Disease Stage | Description | Gene Ratio | Bg Ratio | pvalue | p.adjust | qvalue | Count |
| hsa0513039 | Esophagus | HGIN | Pathogenic Escherichia coli infection | 54/1383 | 197/8465 | 4.91e-05 | 6.15e-04 | 4.89e-04 | 54 |
| hsa0520528 | Esophagus | HGIN | Proteoglycans in cancer | 47/1383 | 205/8465 | 8.23e-03 | 4.71e-02 | 3.74e-02 | 47 |
| hsa05130115 | Esophagus | HGIN | Pathogenic Escherichia coli infection | 54/1383 | 197/8465 | 4.91e-05 | 6.15e-04 | 4.89e-04 | 54 |
| hsa05205112 | Esophagus | HGIN | Proteoglycans in cancer | 47/1383 | 205/8465 | 8.23e-03 | 4.71e-02 | 3.74e-02 | 47 |
| hsa05130211 | Esophagus | ESCC | Pathogenic Escherichia coli infection | 142/4205 | 197/8465 | 8.21e-11 | 1.06e-09 | 5.42e-10 | 142 |
| hsa0520529 | Esophagus | ESCC | Proteoglycans in cancer | 138/4205 | 205/8465 | 1.79e-07 | 1.40e-06 | 7.15e-07 | 138 |
| hsa0452030 | Esophagus | ESCC | Adherens junction | 69/4205 | 93/8465 | 1.08e-06 | 6.83e-06 | 3.50e-06 | 69 |
| hsa052356 | Esophagus | ESCC | PD-L1 expression and PD-1 checkpoint pathway in cancer | 58/4205 | 89/8465 | 2.19e-03 | 6.16e-03 | 3.16e-03 | 58 |
| hsa046607 | Esophagus | ESCC | T cell receptor signaling pathway | 63/4205 | 104/8465 | 1.60e-02 | 3.60e-02 | 1.84e-02 | 63 |
| hsa05130310 | Esophagus | ESCC | Pathogenic Escherichia coli infection | 142/4205 | 197/8465 | 8.21e-11 | 1.06e-09 | 5.42e-10 | 142 |
| hsa0520537 | Esophagus | ESCC | Proteoglycans in cancer | 138/4205 | 205/8465 | 1.79e-07 | 1.40e-06 | 7.15e-07 | 138 |
| hsa04520114 | Esophagus | ESCC | Adherens junction | 69/4205 | 93/8465 | 1.08e-06 | 6.83e-06 | 3.50e-06 | 69 |
| hsa0523511 | Esophagus | ESCC | PD-L1 expression and PD-1 checkpoint pathway in cancer | 58/4205 | 89/8465 | 2.19e-03 | 6.16e-03 | 3.16e-03 | 58 |
| hsa0466013 | Esophagus | ESCC | T cell receptor signaling pathway | 63/4205 | 104/8465 | 1.60e-02 | 3.60e-02 | 1.84e-02 | 63 |
| hsa0513030 | Oral cavity | OSCC | Pathogenic Escherichia coli infection | 129/3704 | 197/8465 | 4.32e-10 | 5.17e-09 | 2.63e-09 | 129 |
| hsa0520526 | Oral cavity | OSCC | Proteoglycans in cancer | 128/3704 | 205/8465 | 4.00e-08 | 3.12e-07 | 1.59e-07 | 128 |
| hsa0452029 | Oral cavity | OSCC | Adherens junction | 62/3704 | 93/8465 | 6.34e-06 | 3.12e-05 | 1.59e-05 | 62 |
| hsa046606 | Oral cavity | OSCC | T cell receptor signaling pathway | 67/3704 | 104/8465 | 1.57e-05 | 6.75e-05 | 3.44e-05 | 67 |
| hsa05235 | Oral cavity | OSCC | PD-L1 expression and PD-1 checkpoint pathway in cancer | 56/3704 | 89/8465 | 1.97e-04 | 6.55e-04 | 3.33e-04 | 56 |
| hsa04662 | Oral cavity | OSCC | B cell receptor signaling pathway | 48/3704 | 84/8465 | 9.02e-03 | 2.01e-02 | 1.03e-02 | 48 |
| Page: 1 2 |
Top |
Cell-cell communication analysis |
| Identification of potential cell-cell interactions between two cell types and their ligand-receptor pairs for different disease states |
| Ligand | Receptor | LRpair | Pathway | Tissue | Disease Stage |
| Page: 1 |
Top |
Single-cell gene regulatory network inference analysis |
| Find out the significant the regulons (TFs) and the target genes of each regulon across cell types for different disease states |
| TF | Cell Type | Tissue | Disease Stage | Target Gene | RSS | Regulon Activity |
| ∗The dot plots of a searched regulon are shown for all cell subpopulations in each disease state of each tissue based on the regulon specific score inferred using pySCENIC and by calculating the average expression. |
| Page: 1 |
Top |
Somatic mutation of malignant transformation related genes |
| Annotation of somatic variants for genes involved in malignant transformation |
| Hugo Symbol | Variant Class | Variant Classification | dbSNP RS | HGVSc | HGVSp | HGVSp Short | SWISSPROT | BIOTYPE | SIFT | PolyPhen | Tumor Sample Barcode | Tissue | Histology | Sex | Age | Stage | Therapy Types | Drugs | Outcome |
| PTPN6 | deletion | Frame_Shift_Del | novel | c.427delN | p.Gly143GlufsTer76 | p.G143Efs*76 | P29350 | protein_coding | TCGA-D8-A27V-01 | Breast | breast invasive carcinoma | Female | <65 | I/II | Hormone Therapy | tamoxiphen | SD | ||
| PTPN6 | SNV | Missense_Mutation | novel | c.119N>T | p.Ser40Leu | p.S40L | P29350 | protein_coding | deleterious(0) | possibly_damaging(0.842) | TCGA-EA-A3HS-01 | Cervix | cervical & endocervical cancer | Female | <65 | I/II | Unknown | Unknown | SD |
| PTPN6 | SNV | Missense_Mutation | rs201976465 | c.1016C>T | p.Ala339Val | p.A339V | P29350 | protein_coding | tolerated(1) | benign(0) | TCGA-VS-A94Z-01 | Cervix | cervical & endocervical cancer | Female | <65 | I/II | Chemotherapy | cisplatin | CR |
| PTPN6 | SNV | Missense_Mutation | rs782599498 | c.1660N>T | p.Arg554Cys | p.R554C | P29350 | protein_coding | deleterious(0.01) | possibly_damaging(0.747) | TCGA-AA-3811-01 | Colorectum | colon adenocarcinoma | Female | >=65 | III/IV | Unknown | Unknown | PD |
| PTPN6 | SNV | Missense_Mutation | rs367551491 | c.629N>A | p.Arg210Gln | p.R210Q | P29350 | protein_coding | deleterious(0.04) | benign(0.201) | TCGA-AA-3864-01 | Colorectum | colon adenocarcinoma | Male | >=65 | I/II | Unknown | Unknown | SD |
| PTPN6 | SNV | Missense_Mutation | c.385N>A | p.Glu129Lys | p.E129K | P29350 | protein_coding | tolerated(1) | benign(0.006) | TCGA-AA-3949-01 | Colorectum | colon adenocarcinoma | Female | >=65 | III/IV | Unknown | Unknown | SD | |
| PTPN6 | SNV | Missense_Mutation | rs370939978 | c.157N>T | p.Arg53Trp | p.R53W | P29350 | protein_coding | deleterious(0) | benign(0.403) | TCGA-AA-3984-01 | Colorectum | colon adenocarcinoma | Female | <65 | I/II | Unknown | Unknown | SD |
| PTPN6 | SNV | Missense_Mutation | rs782346134 | c.1165N>A | p.Glu389Lys | p.E389K | P29350 | protein_coding | tolerated(0.06) | benign(0.367) | TCGA-AA-A010-01 | Colorectum | colon adenocarcinoma | Female | <65 | I/II | Chemotherapy | folinic | CR |
| PTPN6 | SNV | Missense_Mutation | c.203A>C | p.Lys68Thr | p.K68T | P29350 | protein_coding | tolerated(0.12) | benign(0.24) | TCGA-AA-A02R-01 | Colorectum | colon adenocarcinoma | Female | >=65 | I/II | Unknown | Unknown | PD | |
| PTPN6 | SNV | Missense_Mutation | c.89G>A | p.Arg30Gln | p.R30Q | P29350 | protein_coding | deleterious(0) | probably_damaging(1) | TCGA-G4-6302-01 | Colorectum | colon adenocarcinoma | Female | >=65 | I/II | Unknown | Unknown | SD |
| Page: 1 2 3 4 5 6 |
Top |
Related drugs of malignant transformation related genes |
| Identification of chemicals and drugs interact with genes involved in malignant transfromation |
| (DGIdb 4.0) |
| Entrez ID | Symbol | Category | Interaction Types | Drug Claim Name | Drug Name | PMIDs |
| 5777 | PTPN6 | PROTEIN PHOSPHATASE, DRUGGABLE GENOME, CLINICALLY ACTIONABLE | BDBM50054344 | |||
| 5777 | PTPN6 | PROTEIN PHOSPHATASE, DRUGGABLE GENOME, CLINICALLY ACTIONABLE | IL-4 | 15613279 | ||
| 5777 | PTPN6 | PROTEIN PHOSPHATASE, DRUGGABLE GENOME, CLINICALLY ACTIONABLE | TOFACITINIB | TOFACITINIB | 24978112 | |
| 5777 | PTPN6 | PROTEIN PHOSPHATASE, DRUGGABLE GENOME, CLINICALLY ACTIONABLE | NSC-87877 | CHEMBL472004 | ||
| 5777 | PTPN6 | PROTEIN PHOSPHATASE, DRUGGABLE GENOME, CLINICALLY ACTIONABLE | HEN EGG LYSOZYME | 7600299 | ||
| 5777 | PTPN6 | PROTEIN PHOSPHATASE, DRUGGABLE GENOME, CLINICALLY ACTIONABLE | SORAFENIB | SORAFENIB | 22871485 | |
| 5777 | PTPN6 | PROTEIN PHOSPHATASE, DRUGGABLE GENOME, CLINICALLY ACTIONABLE | 4-HYDRAZINYLBENZENESULFONIC ACID | CHEMBL510966 | 19007293 |
| Page: 1 |

Copyright 2023-Present -The University of Texas Health Science Center at Houston |