
|
|||||
|
 | |
| |
| |
| |
| |
| |
|
Gene: PRAP1 |
Gene summary for PRAP1 |
| Gene information | Species | Human | Gene symbol | PRAP1 | Gene ID | 118471 |
| Gene name | proline rich acidic protein 1 | |
| Gene Alias | PRO1195 | |
| Cytomap | 10q26.3 | |
| Gene Type | protein-coding | GO ID | GO:0000070 | UniProtAcc | A6XND8 |
Top |
Malignant transformation analysis |
| Identification of the aberrant gene expression in precancerous and cancerous lesions by comparing the gene expression of stem-like cells in diseased tissues with normal stem cells |
| Entrez ID | Symbol | Replicates | Species | Organ | Tissue | Adj P-value | Log2FC | Malignancy |
| 118471 | PRAP1 | HTA11_2487_2000001011 | Human | Colorectum | SER | 7.88e-06 | 4.03e-01 | -0.1808 |
| 118471 | PRAP1 | HTA11_1938_2000001011 | Human | Colorectum | AD | 7.86e-07 | 3.42e-01 | -0.0811 |
| 118471 | PRAP1 | HTA11_3361_2000001011 | Human | Colorectum | AD | 1.05e-04 | 3.21e-01 | -0.1207 |
| 118471 | PRAP1 | HTA11_1391_2000001011 | Human | Colorectum | AD | 7.80e-09 | 3.86e-01 | -0.059 |
| 118471 | PRAP1 | HTA11_99999974143_84620 | Human | Colorectum | MSS | 5.16e-04 | 1.69e-01 | 0.3005 |
| 118471 | PRAP1 | S42 | Human | Liver | HCC | 8.03e-05 | 9.58e-01 | -0.0103 |
| 118471 | PRAP1 | HCC1_Meng | Human | Liver | HCC | 6.10e-121 | 1.27e+00 | 0.0246 |
| 118471 | PRAP1 | cirrhotic3 | Human | Liver | Cirrhotic | 1.48e-05 | 2.15e-01 | 0.0215 |
| 118471 | PRAP1 | HCC1 | Human | Liver | HCC | 3.01e-19 | 3.48e+00 | 0.5336 |
| 118471 | PRAP1 | HCC2 | Human | Liver | HCC | 3.50e-51 | 4.09e+00 | 0.5341 |
| 118471 | PRAP1 | HCC5 | Human | Liver | HCC | 4.17e-05 | 1.66e+00 | 0.4932 |
| 118471 | PRAP1 | Pt13.a | Human | Liver | HCC | 1.40e-24 | 5.26e-01 | 0.021 |
| 118471 | PRAP1 | Pt13.b | Human | Liver | HCC | 3.76e-48 | 6.15e-01 | 0.0251 |
| 118471 | PRAP1 | Pt13.c | Human | Liver | HCC | 1.30e-06 | 4.38e-01 | 0.0076 |
| 118471 | PRAP1 | Pt14.a | Human | Liver | HCC | 2.22e-06 | 2.56e-01 | 0.0169 |
| 118471 | PRAP1 | Pt14.b | Human | Liver | HCC | 1.85e-21 | 6.37e-01 | 0.018 |
| 118471 | PRAP1 | Pt14.d | Human | Liver | HCC | 2.45e-20 | 5.20e-01 | 0.0143 |
| 118471 | PRAP1 | S014 | Human | Liver | HCC | 4.59e-46 | 1.60e+00 | 0.2254 |
| 118471 | PRAP1 | S015 | Human | Liver | HCC | 1.17e-46 | 2.12e+00 | 0.2375 |
| 118471 | PRAP1 | S016 | Human | Liver | HCC | 6.59e-56 | 1.90e+00 | 0.2243 |
| Page: 1 2 3 |
| Tissue | Expression Dynamics | Abbreviation |
| Colorectum (GSE201348) |  | FAP: Familial adenomatous polyposis |
| CRC: Colorectal cancer | ||
| Colorectum (HTA11) |  | AD: Adenomas |
| SER: Sessile serrated lesions | ||
| MSI-H: Microsatellite-high colorectal cancer | ||
| MSS: Microsatellite stable colorectal cancer | ||
| GC |  | CAG: Chronic atrophic gastritis |
| CAG with IM: Chronic atrophic gastritis with intestinal metaplasia | ||
| CSG: Chronic superficial gastritis | ||
| GC: Gastric cancer | ||
| SIM: Severe intestinal metaplasia | ||
| WIM: Wild intestinal metaplasia | ||
| Liver | 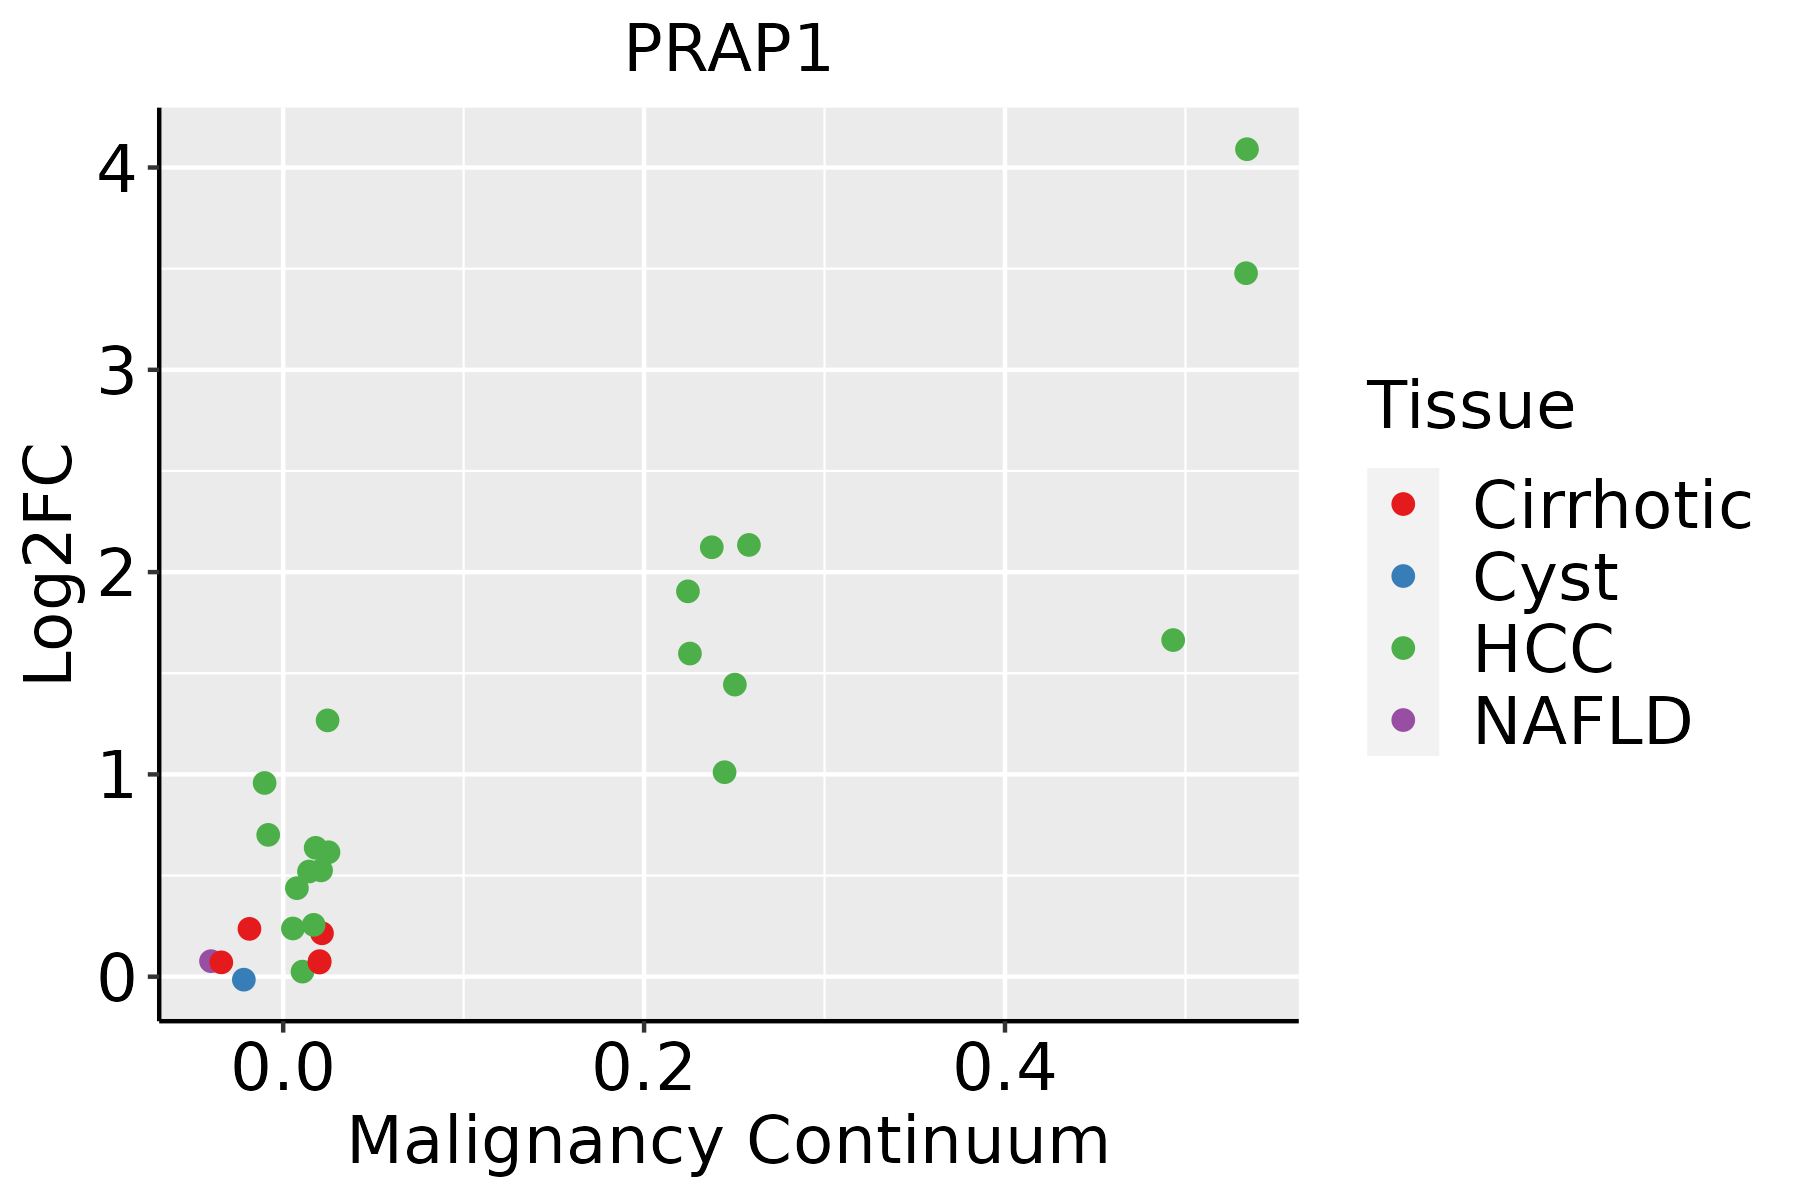 | HCC: Hepatocellular carcinoma |
| NAFLD: Non-alcoholic fatty liver disease |
| ∗log2FC in expression of this searched gene in stem-like cells from each diseased tissue sample relative to stem-like cells in normal samples in each tissue plotted against the malignancy continuum. Samples are colored based on if they are from different disease stage. |
Top |
Malignant transformation related pathway analysis |
| Find out the enriched GO biological processes and KEGG pathways involved in transition from healthy to precancer to cancer |
| Tissue | Disease Stage | Enriched GO biological Processes |
| Colorectum | AD |  |
| Colorectum | SER |  |
| Colorectum | MSS |  |
| Colorectum | MSI-H |  |
| Colorectum | FAP |  |
| ∗Top 15 enriched GO BP terms are showed in the bar plot of each disease state in each tissue. Each row represents a significant GO biological process which is colored according to the -log10(p.adjust). |
| Page: 1 2 3 4 5 6 7 8 9 |
| GO ID | Tissue | Disease Stage | Description | Gene Ratio | Bg Ratio | pvalue | p.adjust | Count |
| GO:1905819 | Liver | HCC | negative regulation of chromosome separation | 28/7958 | 45/18723 | 5.99e-03 | 2.45e-02 | 28 |
| GO:0051984 | Liver | HCC | positive regulation of chromosome segregation | 11/7958 | 14/18723 | 6.81e-03 | 2.73e-02 | 11 |
| GO:0051304 | Liver | HCC | chromosome separation | 53/7958 | 96/18723 | 8.05e-03 | 3.17e-02 | 53 |
| GO:19058201 | Liver | HCC | positive regulation of chromosome separation | 13/7958 | 18/18723 | 1.05e-02 | 3.89e-02 | 13 |
| GO:19019921 | Liver | HCC | positive regulation of mitotic cell cycle phase transition | 51/7958 | 93/18723 | 1.09e-02 | 4.04e-02 | 51 |
| GO:00508926 | Liver | HCC | intestinal absorption | 25/7958 | 41/18723 | 1.31e-02 | 4.69e-02 | 25 |
| GO:0007586 | Stomach | GC | digestion | 38/1159 | 137/18723 | 1.80e-15 | 1.22e-12 | 38 |
| GO:00226006 | Stomach | GC | digestive system process | 30/1159 | 104/18723 | 5.40e-13 | 2.10e-10 | 30 |
| GO:00508925 | Stomach | GC | intestinal absorption | 18/1159 | 41/18723 | 8.10e-12 | 2.20e-09 | 18 |
| GO:0098856 | Stomach | GC | intestinal lipid absorption | 10/1159 | 21/18723 | 1.50e-07 | 8.56e-06 | 10 |
| GO:00723316 | Stomach | GC | signal transduction by p53 class mediator | 26/1159 | 163/18723 | 7.98e-06 | 2.82e-04 | 26 |
| GO:0009314 | Stomach | GC | response to radiation | 47/1159 | 456/18723 | 4.21e-04 | 6.33e-03 | 47 |
| GO:00303306 | Stomach | GC | DNA damage response, signal transduction by p53 class mediator | 13/1159 | 72/18723 | 4.25e-04 | 6.35e-03 | 13 |
| GO:00106396 | Stomach | GC | negative regulation of organelle organization | 38/1159 | 348/18723 | 4.87e-04 | 7.04e-03 | 38 |
| GO:00712144 | Stomach | GC | cellular response to abiotic stimulus | 34/1159 | 331/18723 | 2.62e-03 | 2.45e-02 | 34 |
| GO:01040044 | Stomach | GC | cellular response to environmental stimulus | 34/1159 | 331/18723 | 2.62e-03 | 2.45e-02 | 34 |
| GO:1904729 | Stomach | GC | regulation of intestinal lipid absorption | 4/1159 | 11/18723 | 3.39e-03 | 2.94e-02 | 4 |
| GO:0071479 | Stomach | GC | cellular response to ionizing radiation | 11/1159 | 72/18723 | 4.54e-03 | 3.69e-02 | 11 |
| GO:1904478 | Stomach | GC | regulation of intestinal absorption | 4/1159 | 13/18723 | 6.65e-03 | 4.85e-02 | 4 |
| GO:00075861 | Stomach | CAG with IM | digestion | 29/1050 | 137/18723 | 4.42e-10 | 6.93e-08 | 29 |
| Page: 1 2 3 4 5 6 7 8 9 10 11 |
| Pathway ID | Tissue | Disease Stage | Description | Gene Ratio | Bg Ratio | pvalue | p.adjust | qvalue | Count |
| hsa04140 | Colorectum | AD | Autophagy - animal | 49/2092 | 141/8465 | 4.58e-03 | 2.20e-02 | 1.40e-02 | 49 |
| hsa041401 | Colorectum | AD | Autophagy - animal | 49/2092 | 141/8465 | 4.58e-03 | 2.20e-02 | 1.40e-02 | 49 |
| hsa041402 | Colorectum | SER | Autophagy - animal | 39/1580 | 141/8465 | 5.43e-03 | 3.28e-02 | 2.38e-02 | 39 |
| hsa041403 | Colorectum | SER | Autophagy - animal | 39/1580 | 141/8465 | 5.43e-03 | 3.28e-02 | 2.38e-02 | 39 |
| hsa041404 | Colorectum | MSS | Autophagy - animal | 45/1875 | 141/8465 | 4.42e-03 | 1.90e-02 | 1.16e-02 | 45 |
| hsa041405 | Colorectum | MSS | Autophagy - animal | 45/1875 | 141/8465 | 4.42e-03 | 1.90e-02 | 1.16e-02 | 45 |
| hsa041406 | Liver | Cirrhotic | Autophagy - animal | 65/2530 | 141/8465 | 3.10e-05 | 2.47e-04 | 1.52e-04 | 65 |
| hsa0414011 | Liver | Cirrhotic | Autophagy - animal | 65/2530 | 141/8465 | 3.10e-05 | 2.47e-04 | 1.52e-04 | 65 |
| hsa0414021 | Liver | HCC | Autophagy - animal | 99/4020 | 141/8465 | 3.08e-08 | 4.70e-07 | 2.61e-07 | 99 |
| hsa0414031 | Liver | HCC | Autophagy - animal | 99/4020 | 141/8465 | 3.08e-08 | 4.70e-07 | 2.61e-07 | 99 |
| Page: 1 |
Top |
Cell-cell communication analysis |
| Identification of potential cell-cell interactions between two cell types and their ligand-receptor pairs for different disease states |
| Ligand | Receptor | LRpair | Pathway | Tissue | Disease Stage |
| Page: 1 |
Top |
Single-cell gene regulatory network inference analysis |
| Find out the significant the regulons (TFs) and the target genes of each regulon across cell types for different disease states |
| TF | Cell Type | Tissue | Disease Stage | Target Gene | RSS | Regulon Activity |
| ∗The dot plots of a searched regulon are shown for all cell subpopulations in each disease state of each tissue based on the regulon specific score inferred using pySCENIC and by calculating the average expression. |
| Page: 1 |
Top |
Somatic mutation of malignant transformation related genes |
| Annotation of somatic variants for genes involved in malignant transformation |
| Hugo Symbol | Variant Class | Variant Classification | dbSNP RS | HGVSc | HGVSp | HGVSp Short | SWISSPROT | BIOTYPE | SIFT | PolyPhen | Tumor Sample Barcode | Tissue | Histology | Sex | Age | Stage | Therapy Types | Drugs | Outcome |
| Page: 1 |
Top |
Related drugs of malignant transformation related genes |
| Identification of chemicals and drugs interact with genes involved in malignant transfromation |
| (DGIdb 4.0) |
| Entrez ID | Symbol | Category | Interaction Types | Drug Claim Name | Drug Name | PMIDs |
| Page: 1 |

Copyright 2023-Present -The University of Texas Health Science Center at Houston |