
|
|||||
|
 | |
| |
| |
| |
| |
| |
|
Gene: PPARD |
Gene summary for PPARD |
| Gene information | Species | Human | Gene symbol | PPARD | Gene ID | 5467 |
| Gene name | peroxisome proliferator activated receptor delta | |
| Gene Alias | FAAR | |
| Cytomap | 6p21.31 | |
| Gene Type | protein-coding | GO ID | GO:0000003 | UniProtAcc | A0A024RCW6 |
Top |
Malignant transformation analysis |
| Identification of the aberrant gene expression in precancerous and cancerous lesions by comparing the gene expression of stem-like cells in diseased tissues with normal stem cells |
| Entrez ID | Symbol | Replicates | Species | Organ | Tissue | Adj P-value | Log2FC | Malignancy |
| 5467 | PPARD | CCI_1 | Human | Cervix | CC | 7.82e-09 | 9.89e-01 | 0.528 |
| 5467 | PPARD | CCI_2 | Human | Cervix | CC | 1.81e-05 | 6.11e-01 | 0.5249 |
| 5467 | PPARD | CCI_3 | Human | Cervix | CC | 4.06e-03 | 4.22e-01 | 0.516 |
| 5467 | PPARD | AEH-subject1 | Human | Endometrium | AEH | 7.84e-04 | 2.07e-01 | -0.3059 |
| 5467 | PPARD | AEH-subject5 | Human | Endometrium | AEH | 8.35e-12 | 3.13e-01 | -0.2953 |
| 5467 | PPARD | EEC-subject1 | Human | Endometrium | EEC | 3.53e-09 | 3.91e-01 | -0.2682 |
| 5467 | PPARD | EEC-subject4 | Human | Endometrium | EEC | 5.61e-04 | 2.38e-01 | -0.2571 |
| 5467 | PPARD | EEC-subject5 | Human | Endometrium | EEC | 8.05e-06 | 2.77e-01 | -0.249 |
| 5467 | PPARD | GSM6177620_NYU_UCEC1_lib1_lib1 | Human | Endometrium | EEC | 4.54e-03 | -1.40e-02 | -0.1869 |
| 5467 | PPARD | GSM6177620_NYU_UCEC1_lib2_lib2 | Human | Endometrium | EEC | 4.46e-02 | 2.38e-02 | -0.1875 |
| 5467 | PPARD | GSM6177622_NYU_UCEC3_lib1_lib1 | Human | Endometrium | EEC | 2.14e-04 | 5.00e-02 | -0.1917 |
| 5467 | PPARD | GSM6177622_NYU_UCEC3_lib2_lib2 | Human | Endometrium | EEC | 1.03e-02 | 1.25e-02 | -0.1916 |
| 5467 | PPARD | LZE4T | Human | Esophagus | ESCC | 2.56e-03 | 1.56e-01 | 0.0811 |
| 5467 | PPARD | LZE8T | Human | Esophagus | ESCC | 1.03e-03 | 8.61e-02 | 0.067 |
| 5467 | PPARD | LZE24T | Human | Esophagus | ESCC | 1.77e-09 | 1.72e-01 | 0.0596 |
| 5467 | PPARD | LZE21T | Human | Esophagus | ESCC | 1.43e-09 | 3.61e-01 | 0.0655 |
| 5467 | PPARD | LZE6T | Human | Esophagus | ESCC | 8.07e-07 | 2.04e-01 | 0.0845 |
| 5467 | PPARD | P1T-E | Human | Esophagus | ESCC | 4.86e-09 | 2.66e-01 | 0.0875 |
| 5467 | PPARD | P2T-E | Human | Esophagus | ESCC | 5.67e-10 | 2.29e-01 | 0.1177 |
| 5467 | PPARD | P4T-E | Human | Esophagus | ESCC | 9.97e-11 | 1.03e-01 | 0.1323 |
| Page: 1 2 3 4 5 |
| Tissue | Expression Dynamics | Abbreviation |
| Cervix |  | CC: Cervix cancer |
| HSIL_HPV: HPV-infected high-grade squamous intraepithelial lesions | ||
| N_HPV: HPV-infected normal cervix | ||
| Endometrium |  | AEH: Atypical endometrial hyperplasia |
| EEC: Endometrioid Cancer | ||
| Esophagus | 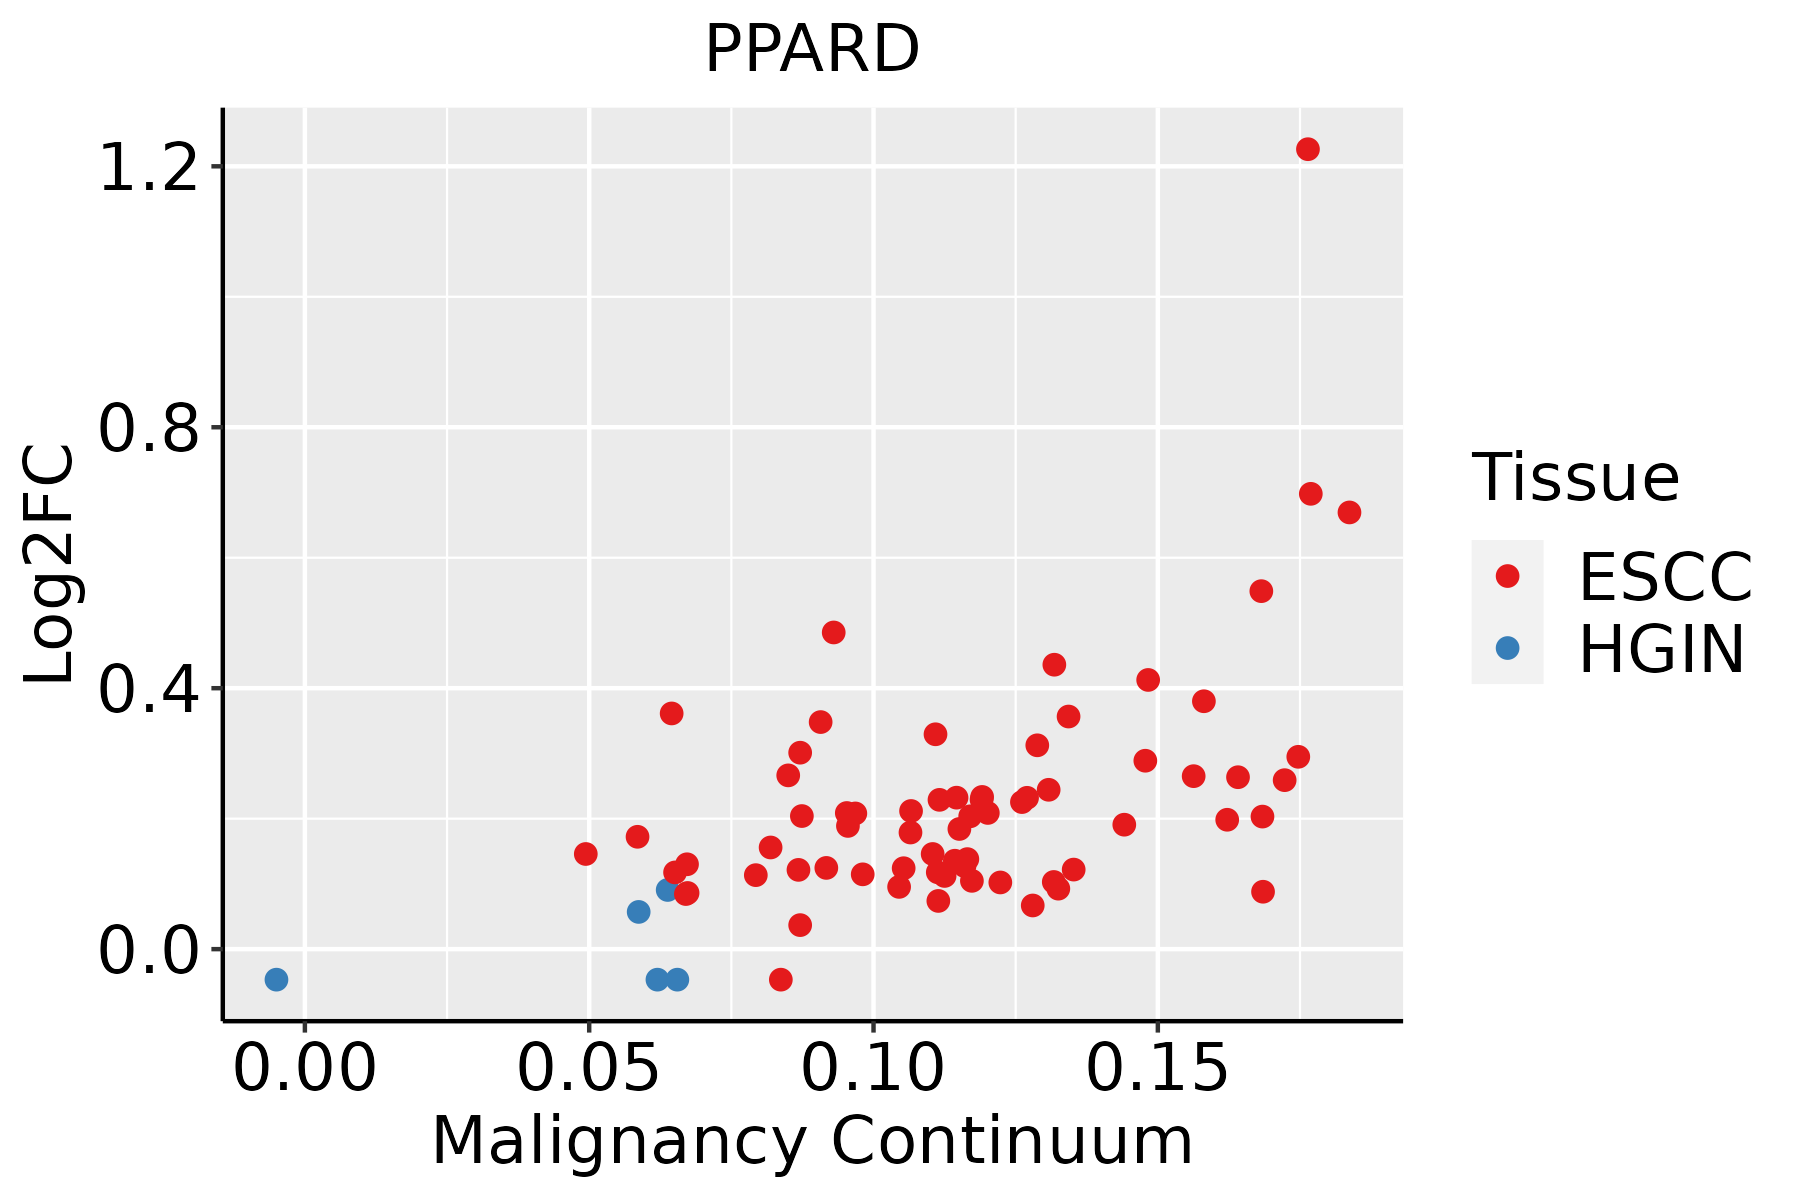 | ESCC: Esophageal squamous cell carcinoma |
| HGIN: High-grade intraepithelial neoplasias | ||
| LGIN: Low-grade intraepithelial neoplasias | ||
| Liver | 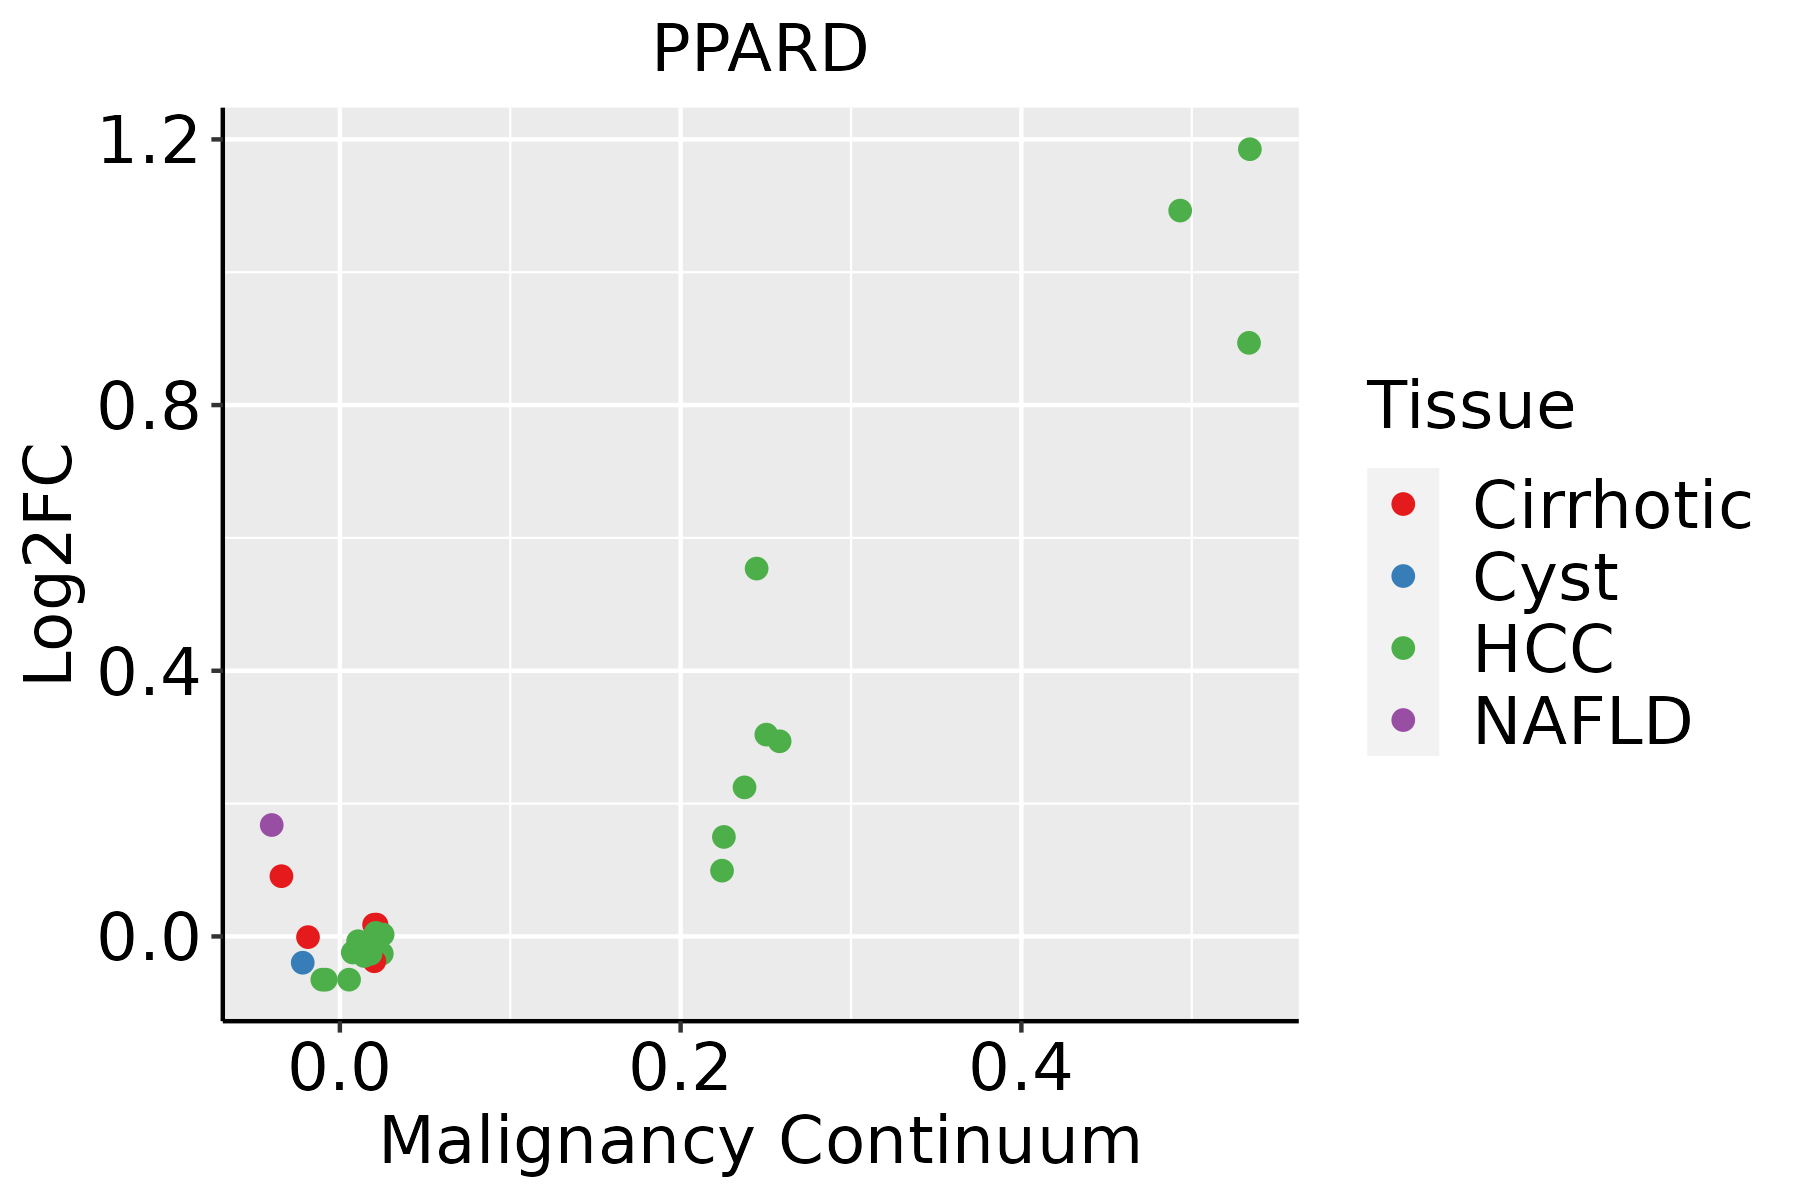 | HCC: Hepatocellular carcinoma |
| NAFLD: Non-alcoholic fatty liver disease | ||
| Lung | 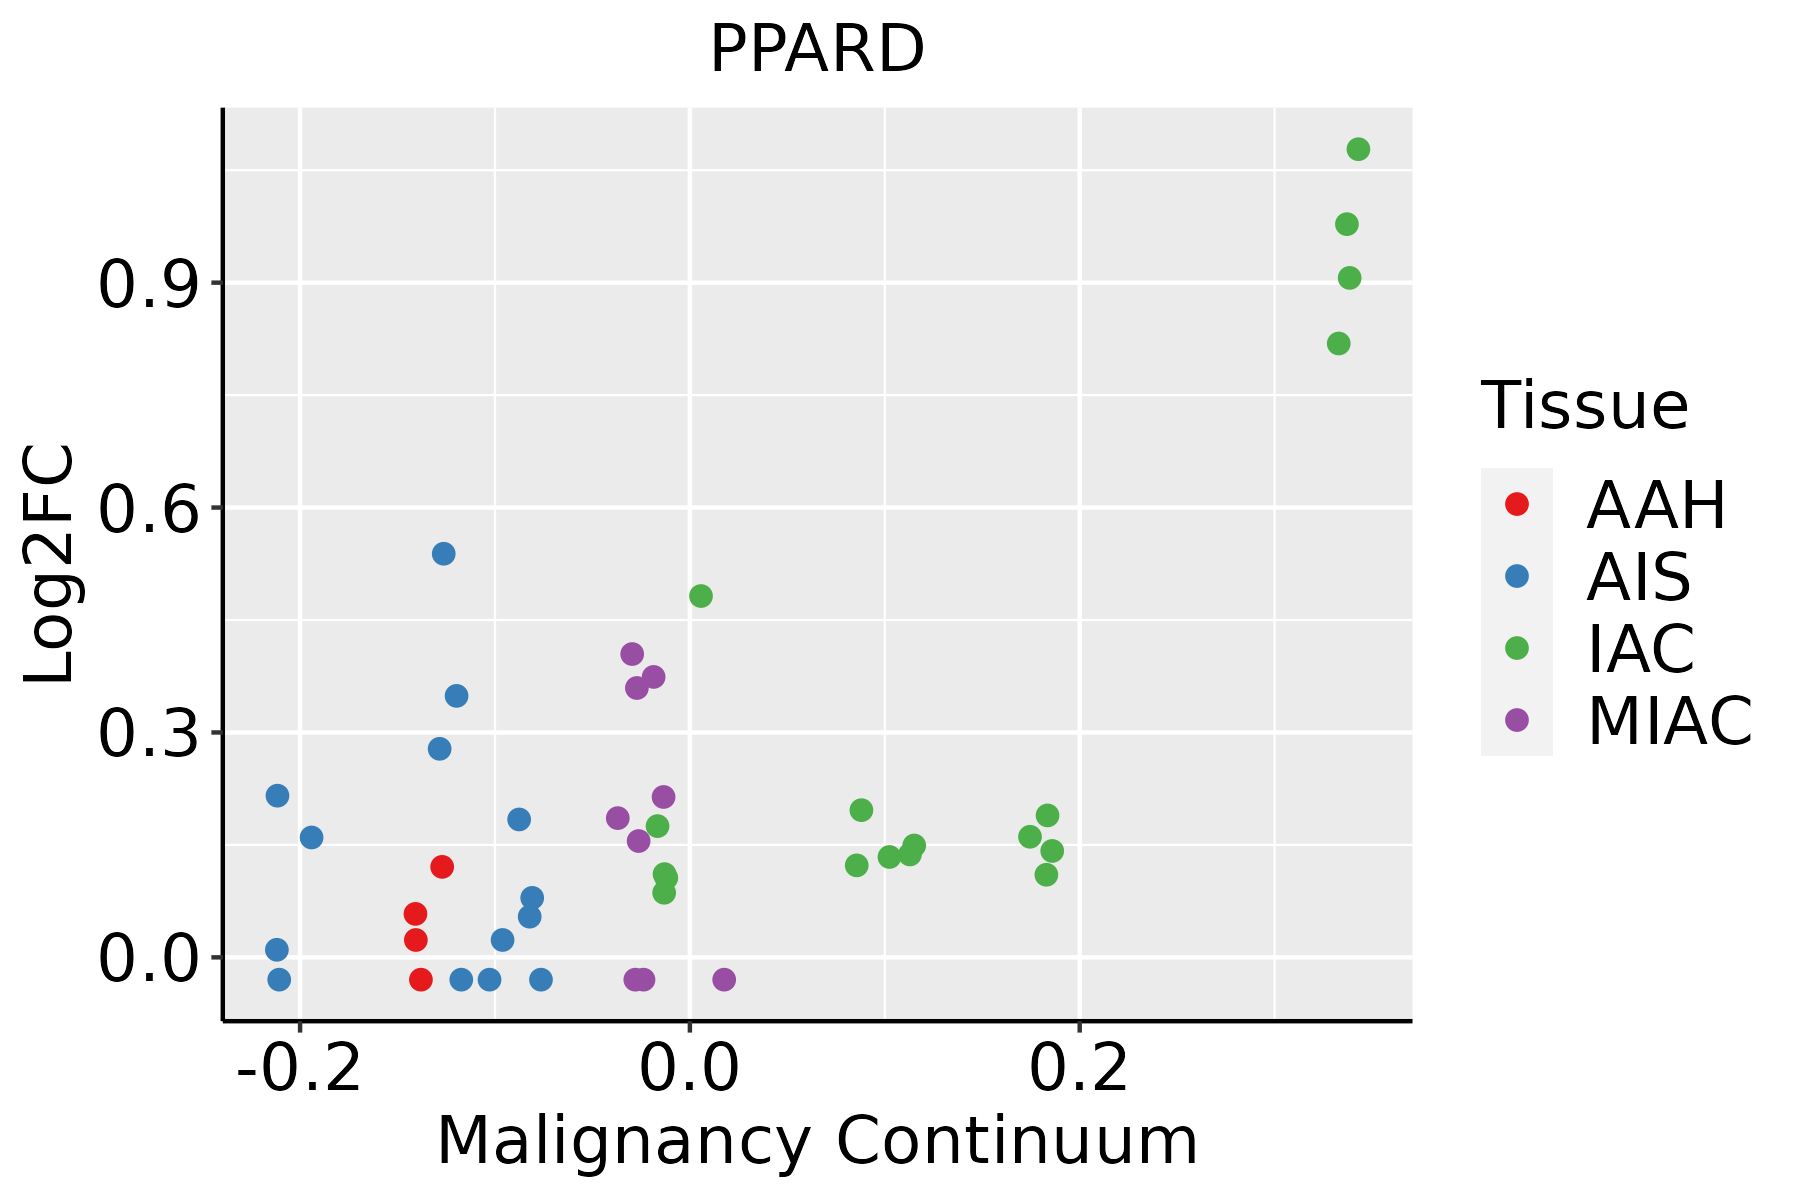 | AAH: Atypical adenomatous hyperplasia |
| AIS: Adenocarcinoma in situ | ||
| IAC: Invasive lung adenocarcinoma | ||
| MIA: Minimally invasive adenocarcinoma | ||
| Oral Cavity | 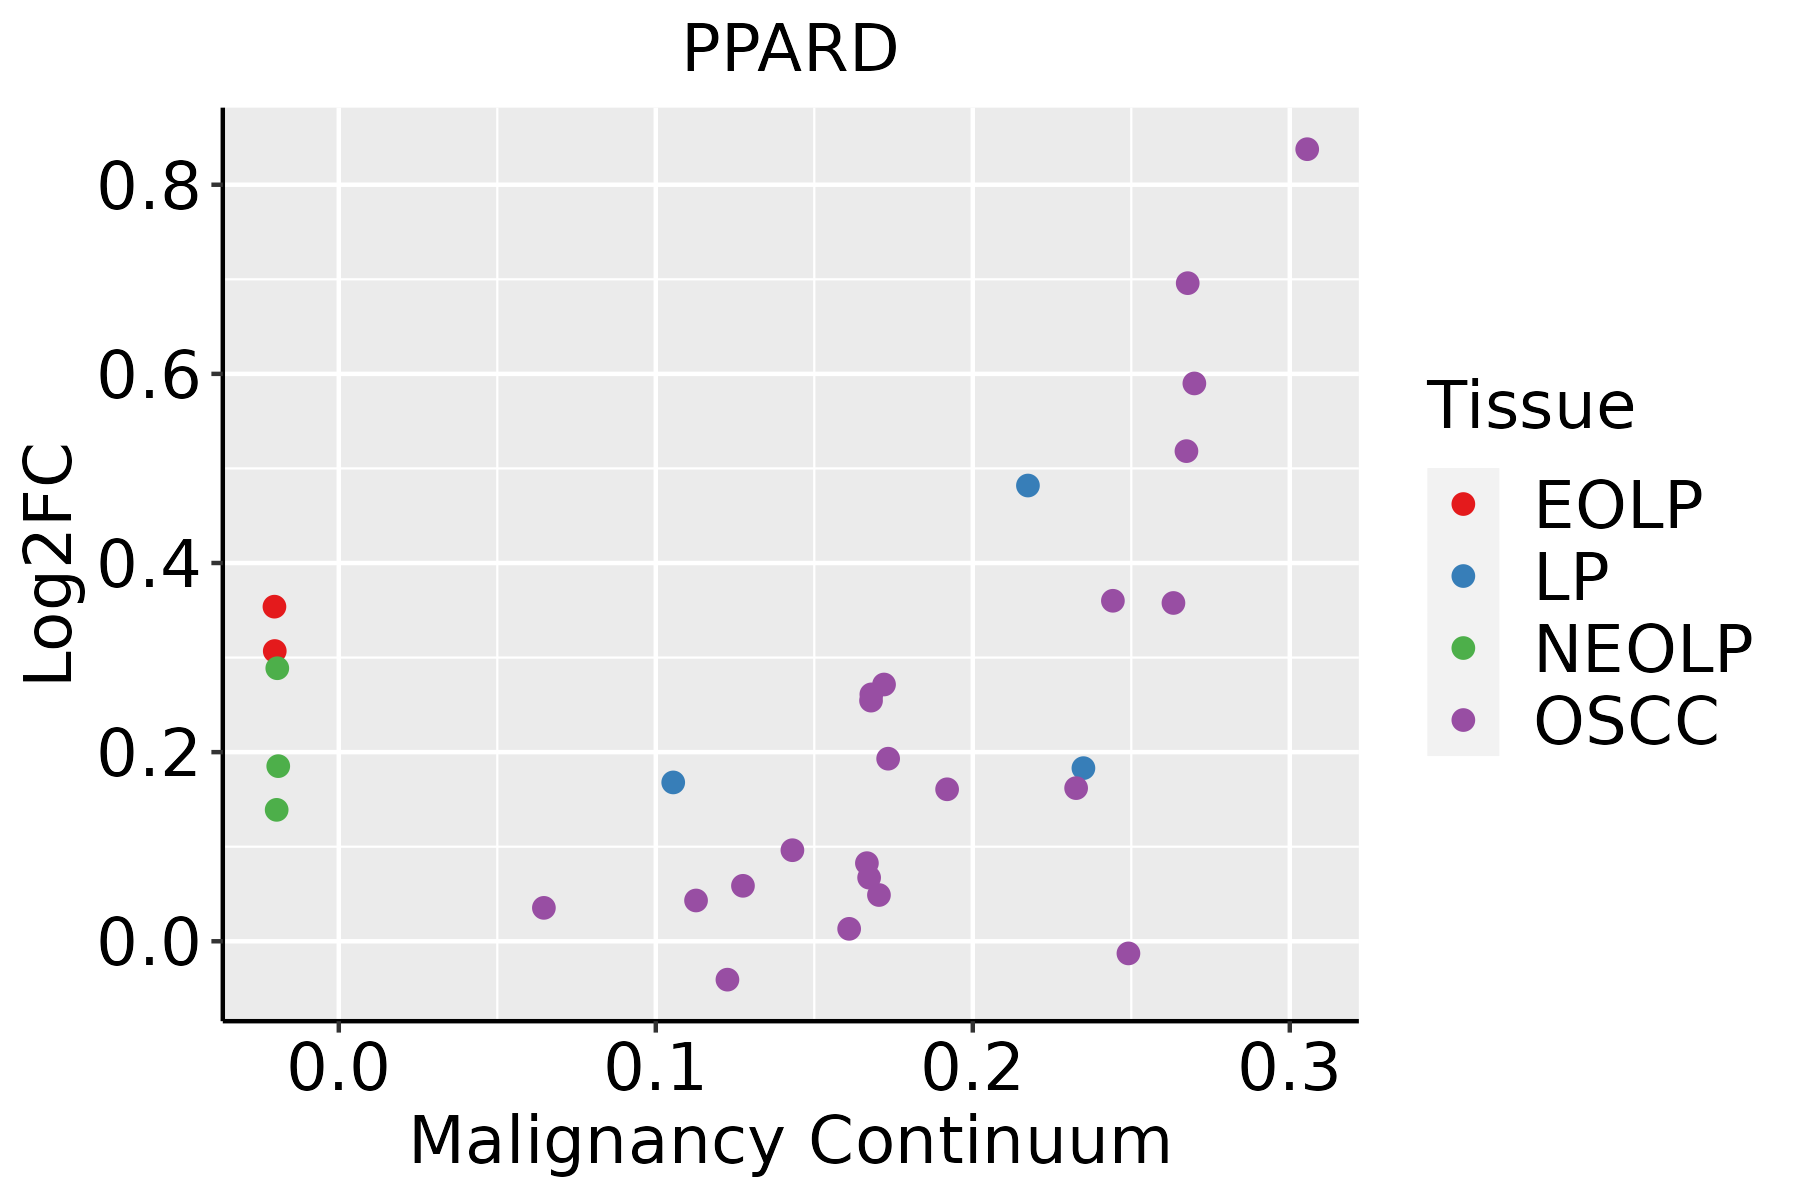 | EOLP: Erosive Oral lichen planus |
| LP: leukoplakia | ||
| NEOLP: Non-erosive oral lichen planus | ||
| OSCC: Oral squamous cell carcinoma |
| ∗log2FC in expression of this searched gene in stem-like cells from each diseased tissue sample relative to stem-like cells in normal samples in each tissue plotted against the malignancy continuum. Samples are colored based on if they are from different disease stage. |
Top |
Malignant transformation related pathway analysis |
| Find out the enriched GO biological processes and KEGG pathways involved in transition from healthy to precancer to cancer |
| Tissue | Disease Stage | Enriched GO biological Processes |
| Colorectum | AD |  |
| Colorectum | SER |  |
| Colorectum | MSS |  |
| Colorectum | MSI-H |  |
| Colorectum | FAP |  |
| ∗Top 15 enriched GO BP terms are showed in the bar plot of each disease state in each tissue. Each row represents a significant GO biological process which is colored according to the -log10(p.adjust). |
| Page: 1 2 3 4 5 6 7 8 9 |
| GO ID | Tissue | Disease Stage | Description | Gene Ratio | Bg Ratio | pvalue | p.adjust | Count |
| GO:00320246 | Endometrium | AEH | positive regulation of insulin secretion | 19/2100 | 78/18723 | 8.09e-04 | 7.62e-03 | 19 |
| GO:00303082 | Endometrium | AEH | negative regulation of cell growth | 36/2100 | 188/18723 | 9.15e-04 | 8.37e-03 | 36 |
| GO:00507149 | Endometrium | AEH | positive regulation of protein secretion | 28/2100 | 137/18723 | 1.17e-03 | 1.01e-02 | 28 |
| GO:00357743 | Endometrium | AEH | positive regulation of insulin secretion involved in cellular response to glucose stimulus | 11/2100 | 36/18723 | 1.44e-03 | 1.20e-02 | 11 |
| GO:00075665 | Endometrium | AEH | embryo implantation | 14/2100 | 53/18723 | 1.67e-03 | 1.36e-02 | 14 |
| GO:00486396 | Endometrium | AEH | positive regulation of developmental growth | 33/2100 | 174/18723 | 1.72e-03 | 1.38e-02 | 33 |
| GO:00456823 | Endometrium | AEH | regulation of epidermis development | 16/2100 | 65/18723 | 1.81e-03 | 1.44e-02 | 16 |
| GO:0061448 | Endometrium | AEH | connective tissue development | 44/2100 | 252/18723 | 1.92e-03 | 1.51e-02 | 44 |
| GO:007145310 | Endometrium | AEH | cellular response to oxygen levels | 33/2100 | 177/18723 | 2.30e-03 | 1.74e-02 | 33 |
| GO:00507967 | Endometrium | AEH | regulation of insulin secretion | 31/2100 | 165/18723 | 2.71e-03 | 1.96e-02 | 31 |
| GO:00459278 | Endometrium | AEH | positive regulation of growth | 44/2100 | 259/18723 | 3.28e-03 | 2.30e-02 | 44 |
| GO:00712229 | Endometrium | AEH | cellular response to lipopolysaccharide | 37/2100 | 209/18723 | 3.30e-03 | 2.31e-02 | 37 |
| GO:0048662 | Endometrium | AEH | negative regulation of smooth muscle cell proliferation | 17/2100 | 75/18723 | 3.39e-03 | 2.36e-02 | 17 |
| GO:00712169 | Endometrium | AEH | cellular response to biotic stimulus | 42/2100 | 246/18723 | 3.65e-03 | 2.50e-02 | 42 |
| GO:00149103 | Endometrium | AEH | regulation of smooth muscle cell migration | 19/2100 | 89/18723 | 4.12e-03 | 2.73e-02 | 19 |
| GO:00716927 | Endometrium | AEH | protein localization to extracellular region | 58/2100 | 368/18723 | 4.72e-03 | 3.00e-02 | 58 |
| GO:00192165 | Endometrium | AEH | regulation of lipid metabolic process | 53/2100 | 331/18723 | 4.86e-03 | 3.07e-02 | 53 |
| GO:00085447 | Endometrium | AEH | epidermis development | 52/2100 | 324/18723 | 5.00e-03 | 3.14e-02 | 52 |
| GO:00149092 | Endometrium | AEH | smooth muscle cell migration | 20/2100 | 97/18723 | 5.00e-03 | 3.14e-02 | 20 |
| GO:0014912 | Endometrium | AEH | negative regulation of smooth muscle cell migration | 11/2100 | 42/18723 | 5.45e-03 | 3.37e-02 | 11 |
| Page: 1 2 3 4 5 6 7 8 9 10 11 12 13 14 15 16 17 18 19 20 21 22 23 24 25 26 27 28 29 30 31 32 33 34 35 36 37 38 39 |
| Pathway ID | Tissue | Disease Stage | Description | Gene Ratio | Bg Ratio | pvalue | p.adjust | qvalue | Count |
| hsa043109 | Cervix | CC | Wnt signaling pathway | 43/1267 | 171/8465 | 3.03e-04 | 1.64e-03 | 9.68e-04 | 43 |
| hsa0431012 | Cervix | CC | Wnt signaling pathway | 43/1267 | 171/8465 | 3.03e-04 | 1.64e-03 | 9.68e-04 | 43 |
| hsa0431010 | Endometrium | AEH | Wnt signaling pathway | 37/1197 | 171/8465 | 4.68e-03 | 2.53e-02 | 1.86e-02 | 37 |
| hsa0431013 | Endometrium | AEH | Wnt signaling pathway | 37/1197 | 171/8465 | 4.68e-03 | 2.53e-02 | 1.86e-02 | 37 |
| hsa0431022 | Endometrium | EEC | Wnt signaling pathway | 40/1237 | 171/8465 | 1.37e-03 | 8.99e-03 | 6.70e-03 | 40 |
| hsa0431032 | Endometrium | EEC | Wnt signaling pathway | 40/1237 | 171/8465 | 1.37e-03 | 8.99e-03 | 6.70e-03 | 40 |
| hsa052215 | Esophagus | ESCC | Acute myeloid leukemia | 49/4205 | 67/8465 | 7.43e-05 | 3.07e-04 | 1.57e-04 | 49 |
| hsa0522113 | Esophagus | ESCC | Acute myeloid leukemia | 49/4205 | 67/8465 | 7.43e-05 | 3.07e-04 | 1.57e-04 | 49 |
| hsa033204 | Liver | HCC | PPAR signaling pathway | 48/4020 | 75/8465 | 2.83e-03 | 9.37e-03 | 5.21e-03 | 48 |
| hsa05221 | Liver | HCC | Acute myeloid leukemia | 41/4020 | 67/8465 | 1.64e-02 | 3.90e-02 | 2.17e-02 | 41 |
| hsa033205 | Liver | HCC | PPAR signaling pathway | 48/4020 | 75/8465 | 2.83e-03 | 9.37e-03 | 5.21e-03 | 48 |
| hsa052211 | Liver | HCC | Acute myeloid leukemia | 41/4020 | 67/8465 | 1.64e-02 | 3.90e-02 | 2.17e-02 | 41 |
| hsa043108 | Lung | IAC | Wnt signaling pathway | 40/1053 | 171/8465 | 4.56e-05 | 7.06e-04 | 4.69e-04 | 40 |
| hsa0431011 | Lung | IAC | Wnt signaling pathway | 40/1053 | 171/8465 | 4.56e-05 | 7.06e-04 | 4.69e-04 | 40 |
| hsa052214 | Oral cavity | OSCC | Acute myeloid leukemia | 42/3704 | 67/8465 | 1.34e-03 | 3.75e-03 | 1.91e-03 | 42 |
| hsa0522112 | Oral cavity | OSCC | Acute myeloid leukemia | 42/3704 | 67/8465 | 1.34e-03 | 3.75e-03 | 1.91e-03 | 42 |
| hsa0522121 | Oral cavity | EOLP | Acute myeloid leukemia | 19/1218 | 67/8465 | 2.20e-03 | 7.32e-03 | 4.32e-03 | 19 |
| hsa0431016 | Oral cavity | EOLP | Wnt signaling pathway | 37/1218 | 171/8465 | 6.23e-03 | 1.83e-02 | 1.08e-02 | 37 |
| hsa052213 | Oral cavity | EOLP | Acute myeloid leukemia | 19/1218 | 67/8465 | 2.20e-03 | 7.32e-03 | 4.32e-03 | 19 |
| hsa0431017 | Oral cavity | EOLP | Wnt signaling pathway | 37/1218 | 171/8465 | 6.23e-03 | 1.83e-02 | 1.08e-02 | 37 |
| Page: 1 2 |
Top |
Cell-cell communication analysis |
| Identification of potential cell-cell interactions between two cell types and their ligand-receptor pairs for different disease states |
| Ligand | Receptor | LRpair | Pathway | Tissue | Disease Stage |
| Page: 1 |
Top |
Single-cell gene regulatory network inference analysis |
| Find out the significant the regulons (TFs) and the target genes of each regulon across cell types for different disease states |
| TF | Cell Type | Tissue | Disease Stage | Target Gene | RSS | Regulon Activity |
| PPARD | TFH | Breast | ADJ | CTH,SF3A3,ZNF532, etc. | 7.27e-02 |  |
| PPARD | CAF | Breast | IDC | HK2,FSTL1,SLC2A3, etc. | 3.29e-02 |  |
| PPARD | M2MAC | Cervix | CC | DOCK4,PFKFB3,RAPGEF1, etc. | 2.77e-01 |  |
| PPARD | MON | Colorectum | Healthy | CREM,NAMPT,DOCK4, etc. | 1.38e-01 |  |
| PPARD | CFIB | Colorectum | ADJ | TGFB1,ANKRD13C,PCNX4, etc. | 4.46e-01 |  |
| PPARD | M2MAC | Endometrium | ADJ | LRMDA,DOCK4,NFKB1, etc. | 2.47e-01 |  |
| PPARD | INMON | Endometrium | ADJ | LRMDA,DOCK4,NFKB1, etc. | 1.04e-01 | |
| PPARD | INMON | Endometrium | EEC | LRMDA,DOCK4,NFKB1, etc. | 8.16e-02 |  |
| PPARD | CD8TEFF | Endometrium | Healthy | LRMDA,DOCK4,NFKB1, etc. | 1.92e-02 |  |
| PPARD | MAST | Lung | MIAC | MAML3,AREG,F8, etc. | 8.18e-02 |  |
| ∗The dot plots of a searched regulon are shown for all cell subpopulations in each disease state of each tissue based on the regulon specific score inferred using pySCENIC and by calculating the average expression. |
| Page: 1 2 3 4 |
Top |
Somatic mutation of malignant transformation related genes |
| Annotation of somatic variants for genes involved in malignant transformation |
| Hugo Symbol | Variant Class | Variant Classification | dbSNP RS | HGVSc | HGVSp | HGVSp Short | SWISSPROT | BIOTYPE | SIFT | PolyPhen | Tumor Sample Barcode | Tissue | Histology | Sex | Age | Stage | Therapy Types | Drugs | Outcome |
| PPARD | SNV | Missense_Mutation | rs767428713 | c.941N>A | p.Arg314His | p.R314H | Q03181 | protein_coding | tolerated(0.06) | benign(0.082) | TCGA-A8-A07U-01 | Breast | breast invasive carcinoma | Female | >=65 | III/IV | Chemotherapy | 5-fluorouracil | SD |
| PPARD | SNV | Missense_Mutation | c.448G>C | p.Glu150Gln | p.E150Q | Q03181 | protein_coding | tolerated(1) | possibly_damaging(0.826) | TCGA-D8-A1JA-01 | Breast | breast invasive carcinoma | Female | <65 | III/IV | Chemotherapy | adriamycin | PD | |
| PPARD | insertion | In_Frame_Ins | novel | c.666_667insAAAGCCAGCCACACGGCGGTGAGT | p.Ala222_Glu223insLysAlaSerHisThrAlaValSer | p.A222_E223insKASHTAVS | Q03181 | protein_coding | TCGA-A2-A0EO-01 | Breast | breast invasive carcinoma | Female | <65 | I/II | Hormone Therapy | tamoxiphen | SD | ||
| PPARD | insertion | In_Frame_Ins | novel | c.1108_1109insCTTGGTCTGTCACGGCCAAGGAGGCCTGCCGTCCCC | p.Val370delinsAlaTrpSerValThrAlaLysGluAlaCysArgProLeu | p.V370delinsAWSVTAKEACRPL | Q03181 | protein_coding | TCGA-A8-A09T-01 | Breast | breast invasive carcinoma | Female | >=65 | I/II | Hormone Therapy | anastrozole | SD | ||
| PPARD | insertion | Frame_Shift_Ins | novel | c.1139_1140insATCATTCTGTGTGGAGGTGAGTGAGAGTGGGGCAGGTGGGCTGG | p.Leu381SerfsTer51 | p.L381Sfs*51 | Q03181 | protein_coding | TCGA-B6-A0IA-01 | Breast | breast invasive carcinoma | Female | <65 | I/II | Unknown | Unknown | SD | ||
| PPARD | SNV | Missense_Mutation | novel | c.136T>C | p.Ser46Pro | p.S46P | Q03181 | protein_coding | tolerated(0.11) | benign(0) | TCGA-2W-A8YY-01 | Cervix | cervical & endocervical cancer | Female | <65 | I/II | Chemotherapy | cisplatin | CR |
| PPARD | SNV | Missense_Mutation | rs765360583 | c.308G>A | p.Arg103His | p.R103H | Q03181 | protein_coding | deleterious(0) | probably_damaging(0.999) | TCGA-2W-A8YY-01 | Cervix | cervical & endocervical cancer | Female | <65 | I/II | Chemotherapy | cisplatin | CR |
| PPARD | SNV | Missense_Mutation | c.431N>A | p.Arg144His | p.R144H | Q03181 | protein_coding | deleterious(0) | probably_damaging(0.998) | TCGA-FU-A3HZ-01 | Cervix | cervical & endocervical cancer | Female | <65 | I/II | Chemotherapy | cisplatin | CR | |
| PPARD | SNV | Missense_Mutation | novel | c.684N>C | p.Trp228Cys | p.W228C | Q03181 | protein_coding | tolerated(0.31) | probably_damaging(0.98) | TCGA-JW-A5VL-01 | Cervix | cervical & endocervical cancer | Female | <65 | I/II | Unknown | Unknown | SD |
| PPARD | SNV | Missense_Mutation | c.592N>T | p.Arg198Cys | p.R198C | Q03181 | protein_coding | deleterious(0.02) | benign(0.409) | TCGA-A6-2686-01 | Colorectum | colon adenocarcinoma | Female | >=65 | I/II | Unknown | Unknown | SD |
| Page: 1 2 3 4 5 6 |
Top |
Related drugs of malignant transformation related genes |
| Identification of chemicals and drugs interact with genes involved in malignant transfromation |
| (DGIdb 4.0) |
| Entrez ID | Symbol | Category | Interaction Types | Drug Claim Name | Drug Name | PMIDs |
| 5467 | PPARD | NUCLEAR HORMONE RECEPTOR, DRUGGABLE GENOME, TRANSCRIPTION FACTOR | PROPACHLOR | PROPACHLOR | ||
| 5467 | PPARD | NUCLEAR HORMONE RECEPTOR, DRUGGABLE GENOME, TRANSCRIPTION FACTOR | DICHLOROPHEN | DICHLOROPHEN | ||
| 5467 | PPARD | NUCLEAR HORMONE RECEPTOR, DRUGGABLE GENOME, TRANSCRIPTION FACTOR | BISPHENOL A | BISPHENOL A | ||
| 5467 | PPARD | NUCLEAR HORMONE RECEPTOR, DRUGGABLE GENOME, TRANSCRIPTION FACTOR | TCMDC-123920 | CHEMBL1606 | ||
| 5467 | PPARD | NUCLEAR HORMONE RECEPTOR, DRUGGABLE GENOME, TRANSCRIPTION FACTOR | GW7647 | GW7647 | 18162399 | |
| 5467 | PPARD | NUCLEAR HORMONE RECEPTOR, DRUGGABLE GENOME, TRANSCRIPTION FACTOR | HYDRAMETHYLNON | HYDRAMETHYLNON | ||
| 5467 | PPARD | NUCLEAR HORMONE RECEPTOR, DRUGGABLE GENOME, TRANSCRIPTION FACTOR | agonist | CHEMBL3544958 | CER-002 | |
| 5467 | PPARD | NUCLEAR HORMONE RECEPTOR, DRUGGABLE GENOME, TRANSCRIPTION FACTOR | 12-HYDROXY-OCTADECANOIC ACID | CHEMBL292352 | ||
| 5467 | PPARD | NUCLEAR HORMONE RECEPTOR, DRUGGABLE GENOME, TRANSCRIPTION FACTOR | L-165041 | CHEMBL153057 | ||
| 5467 | PPARD | NUCLEAR HORMONE RECEPTOR, DRUGGABLE GENOME, TRANSCRIPTION FACTOR | CLOTRIMAZOLE | CLOTRIMAZOLE |
| Page: 1 2 3 4 5 6 7 8 9 10 11 12 13 14 15 16 |

Copyright 2023-Present -The University of Texas Health Science Center at Houston |