Schematic overview of the cellular and molecular mechanisms involved in the cancer progression, including the proposed cellular and molecular mechanisms in cancer cells trajectory. AT1: alveolar type 1 cells; AT2: alveolar type 2 cells; AAH: atypical adenomatous hyperplasia; AIS: adenocarcinoma in situ; MIA: minimally invasive adenocarcinoma; IA: invasive adenocarcinoma; EMT: epithelial-mesenchymal transition

Home

Download

Statistics

Help

Contact

Center for Computational Systems Medicine
leaf

Gene summary

leaf

Malignant transformation analysis

leaf

Malignant transformation related pathway analysis

leaf

Cell-cell communication analysis

leaf

Single-cell gene regulatory network inference analysis

leaf

Somatic mutation of malignant transformation related genes

leaf

Related drugs of malignant transformation related genes

Gene: PMEPA1

Gene summary for PMEPA1

check button Gene summary.

Gene informationSpeciesHuman
Gene symbol

PMEPA1

Gene ID

56937

Gene nameprostate transmembrane protein, androgen induced 1
Gene AliasSTAG1
Cytomap20q13.31
Gene Typeprotein-coding
GO ID

GO:0001932

UniProtAcc

Q969W9


Top

Malignant transformation analysis

check button Identification of the aberrant gene expression in precancerous and cancerous lesions by comparing the gene expression of stem-like cells in diseased tissues with normal stem cells
check button Malignant transformation involving gene list.
Entrez IDSymbolReplicatesSpeciesOrganTissueAdj P-valueLog2FCMalignancy
56937PMEPA1GSM4909285HumanBreastIDC3.49e-072.94e-010.21
56937PMEPA1GSM4909290HumanBreastIDC1.02e-124.83e-010.2096
56937PMEPA1GSM4909295HumanBreastIDC1.39e-064.97e-010.0898
56937PMEPA1GSM4909308HumanBreastIDC8.81e-039.07e-020.158
56937PMEPA1GSM4909311HumanBreastIDC9.12e-03-1.25e-010.1534
56937PMEPA1GSM4909317HumanBreastIDC3.19e-236.12e-010.1355
56937PMEPA1GSM4909319HumanBreastIDC7.28e-08-1.25e-010.1563
56937PMEPA1GSM4909321HumanBreastIDC1.24e-03-1.01e-010.1559
56937PMEPA1brca2HumanBreastPrecancer5.65e-072.95e-01-0.024
56937PMEPA1DCIS2HumanBreastDCIS1.78e-575.27e-010.0085
56937PMEPA1HTA11_3410_2000001011HumanColorectumAD5.43e-033.42e-010.0155
56937PMEPA1HTA11_1938_2000001011HumanColorectumAD1.15e-091.18e+00-0.0811
56937PMEPA1HTA11_866_3004761011HumanColorectumAD1.67e-208.11e-010.096
56937PMEPA1HTA11_7696_3000711011HumanColorectumAD2.89e-177.45e-010.0674
56937PMEPA1HTA11_6818_2000001011HumanColorectumAD8.33e-121.10e+000.0112
56937PMEPA1HTA11_6818_2000001021HumanColorectumAD2.95e-351.78e+000.0588
56937PMEPA1HTA11_99999965104_69814HumanColorectumMSS1.42e-085.97e-010.281
56937PMEPA1HTA11_99999971662_82457HumanColorectumMSS4.75e-481.55e+000.3859
56937PMEPA1HTA11_99999973899_84307HumanColorectumMSS7.32e-532.99e+000.2585
56937PMEPA1HTA11_99999974143_84620HumanColorectumMSS2.14e-361.14e+000.3005
Page: 1 2 3 4 5 6 7 8 

check button Transcriptomic changes along malignancy continuum.
TissueExpression DynamicsAbbreviation
BreastThe image shows the transcriptomic changes along malignancy continuum.log2FC in expression of this searched gene in stem-like cells from each diseased tissue sample relative to stem-like cells in normal samples in each tissue plotted against the malignancy continuum. Samples are colored based on if they are from different disease stage.
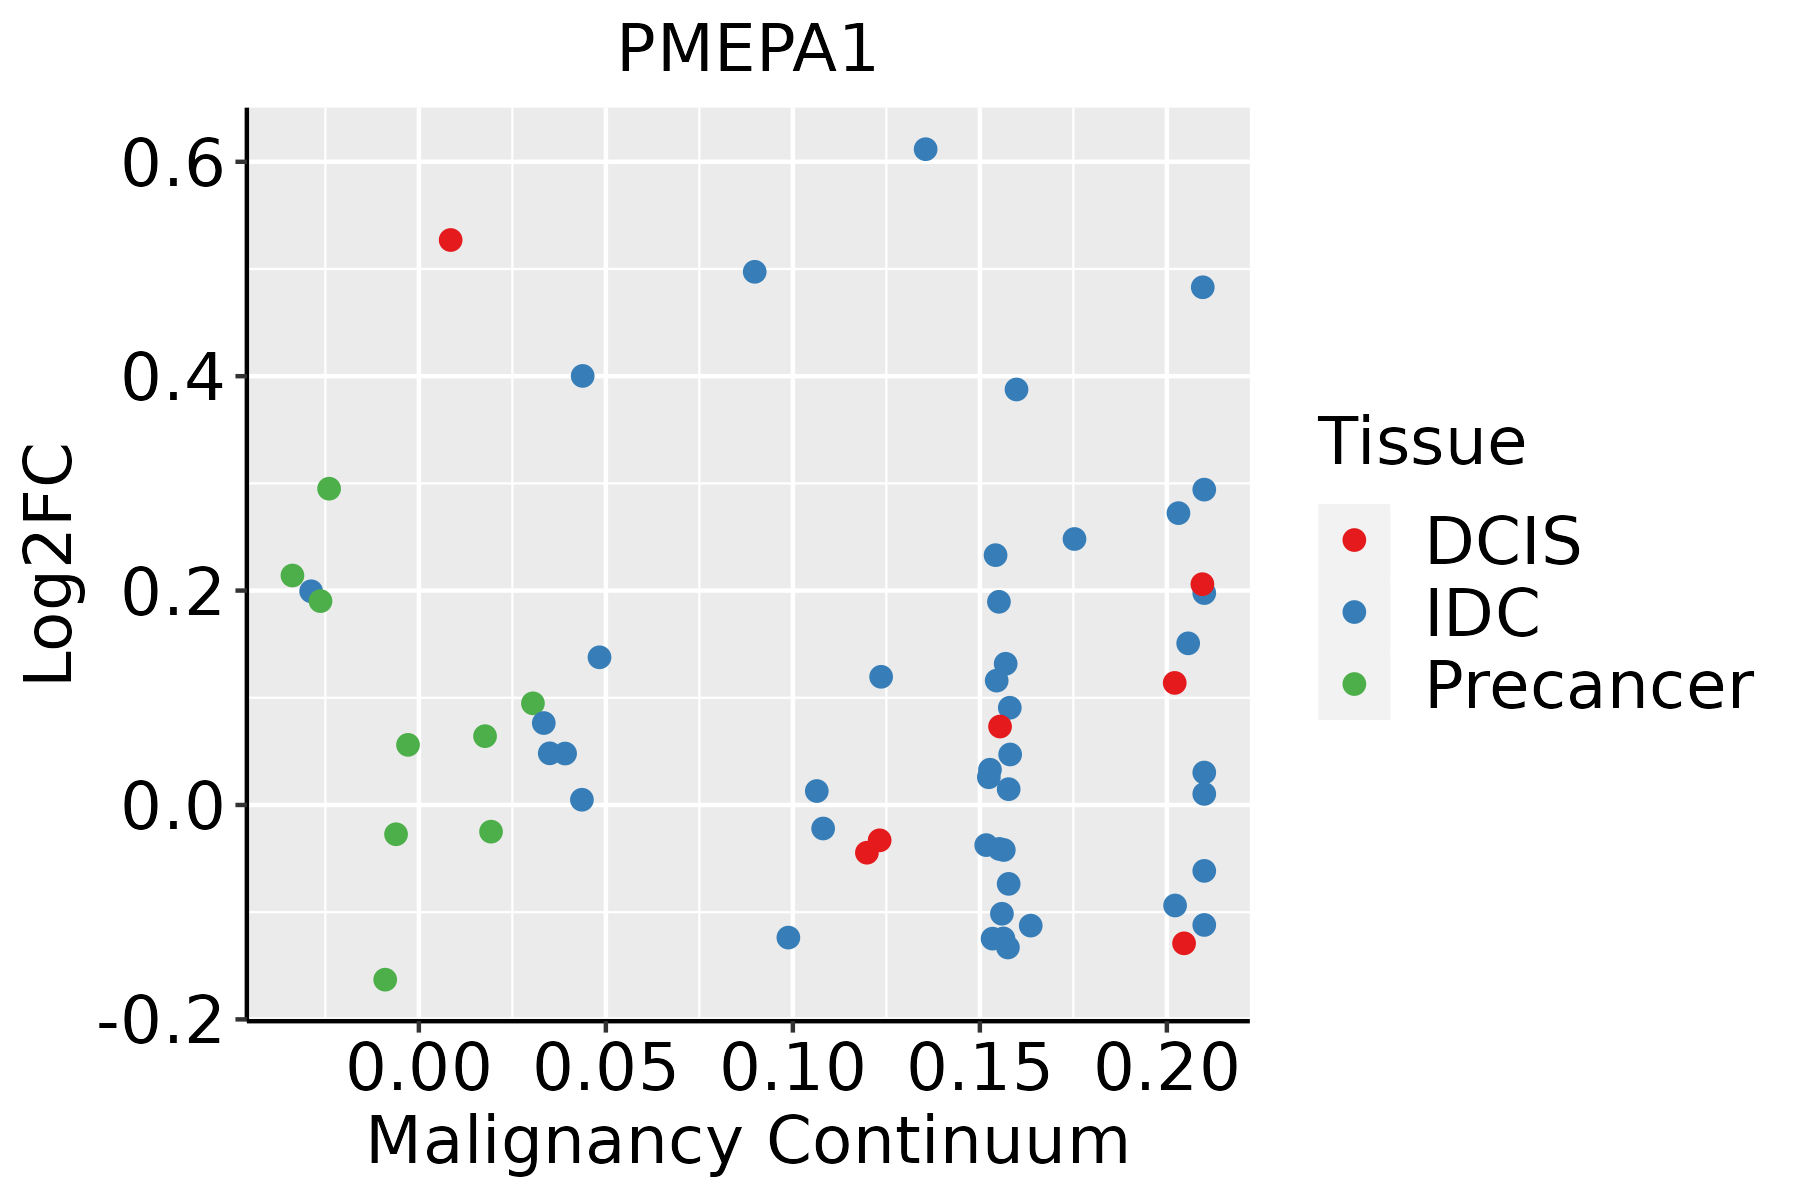
IDC: Invasive ductal carcinoma
DCIS: Ductal carcinoma in situ
Precancer(BRCA1-mut): Precancerous lesion from BRCA1 mutation carriers
Colorectum (GSE201348)The image shows the transcriptomic changes along malignancy continuum.log2FC in expression of this searched gene in stem-like cells from each diseased tissue sample relative to stem-like cells in normal samples in each tissue plotted against the malignancy continuum. Samples are colored based on if they are from different disease stage.FAP: Familial adenomatous polyposis
CRC: Colorectal cancer
Colorectum (HTA11)The image shows the transcriptomic changes along malignancy continuum.log2FC in expression of this searched gene in stem-like cells from each diseased tissue sample relative to stem-like cells in normal samples in each tissue plotted against the malignancy continuum. Samples are colored based on if they are from different disease stage.AD: Adenomas
SER: Sessile serrated lesions
MSI-H: Microsatellite-high colorectal cancer
MSS: Microsatellite stable colorectal cancer
EndometriumThe image shows the transcriptomic changes along malignancy continuum.log2FC in expression of this searched gene in stem-like cells from each diseased tissue sample relative to stem-like cells in normal samples in each tissue plotted against the malignancy continuum. Samples are colored based on if they are from different disease stage.AEH: Atypical endometrial hyperplasia
EEC: Endometrioid Cancer
EsophagusThe image shows the transcriptomic changes along malignancy continuum.log2FC in expression of this searched gene in stem-like cells from each diseased tissue sample relative to stem-like cells in normal samples in each tissue plotted against the malignancy continuum. Samples are colored based on if they are from different disease stage.
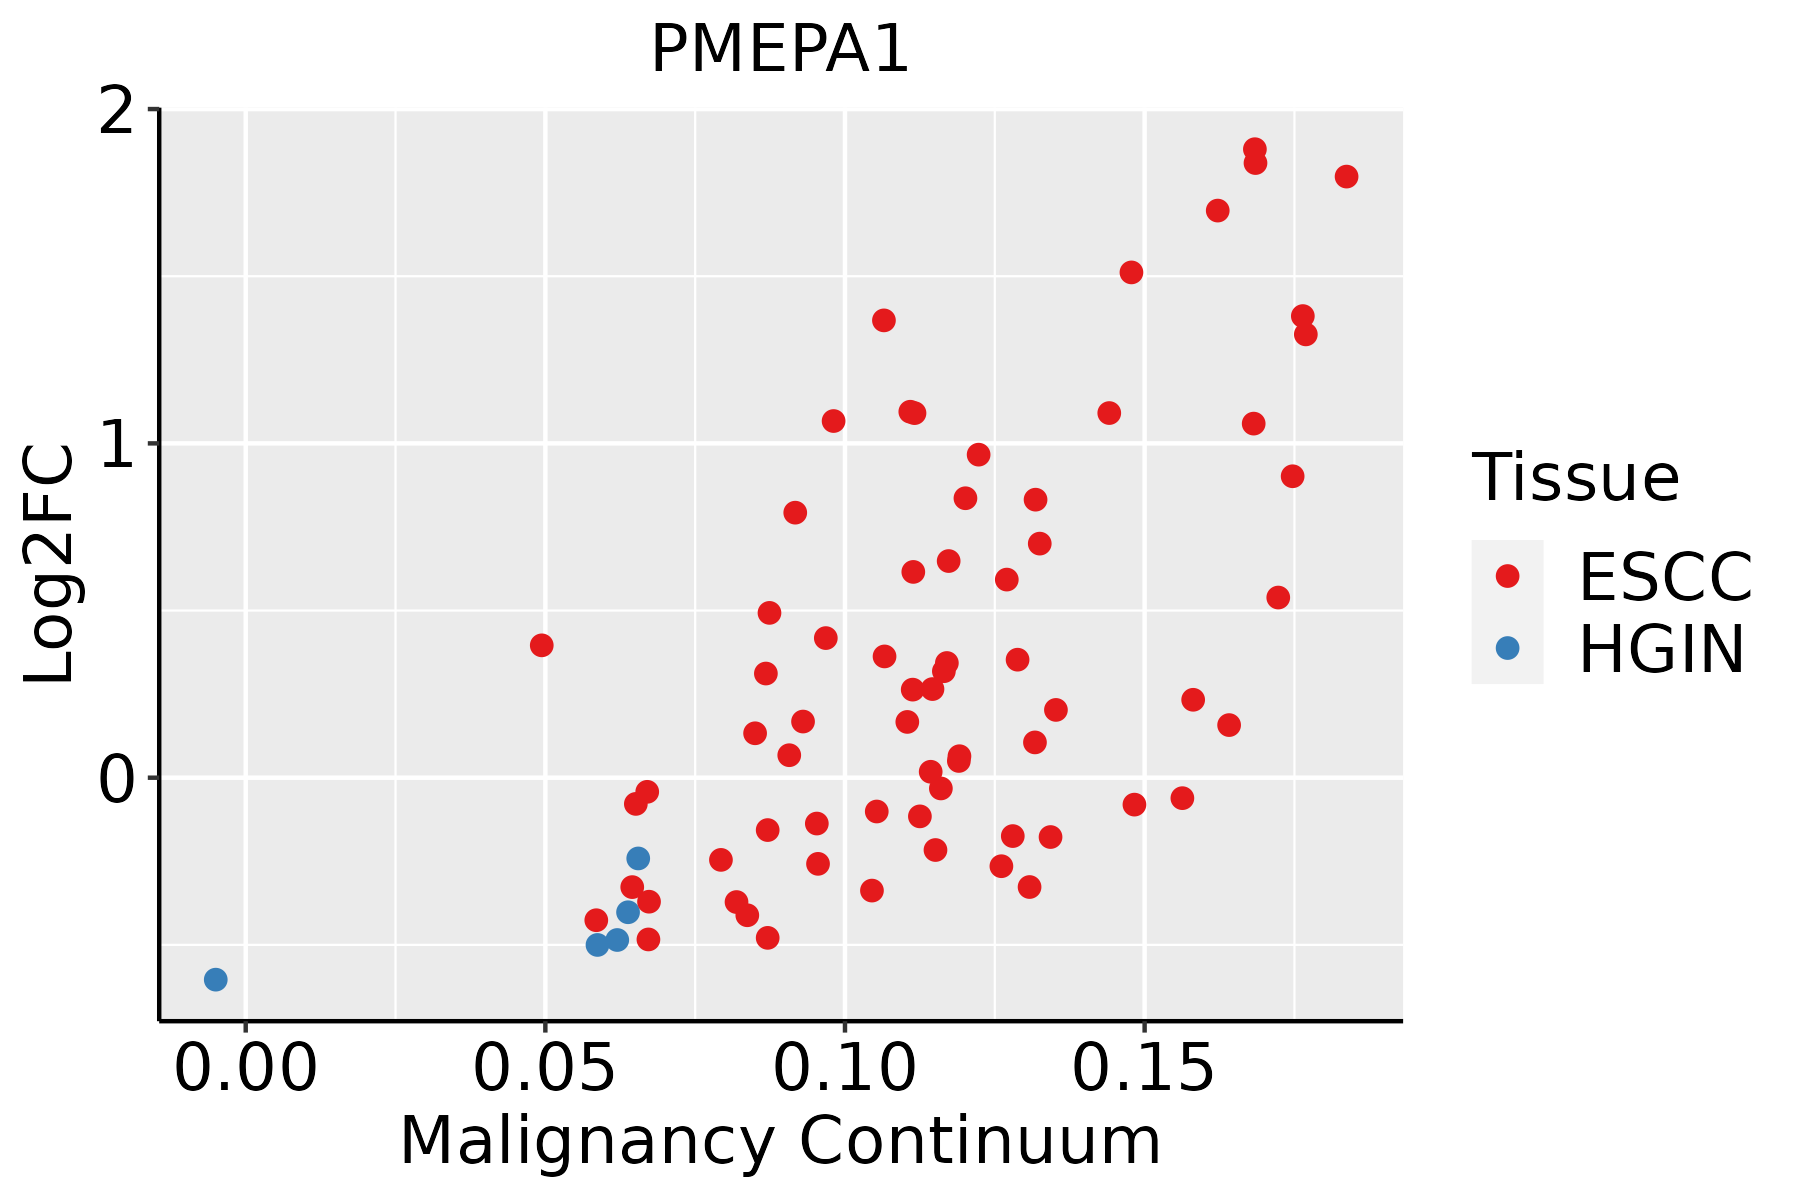
ESCC: Esophageal squamous cell carcinoma
HGIN: High-grade intraepithelial neoplasias
LGIN: Low-grade intraepithelial neoplasias
LiverThe image shows the transcriptomic changes along malignancy continuum.log2FC in expression of this searched gene in stem-like cells from each diseased tissue sample relative to stem-like cells in normal samples in each tissue plotted against the malignancy continuum. Samples are colored based on if they are from different disease stage.
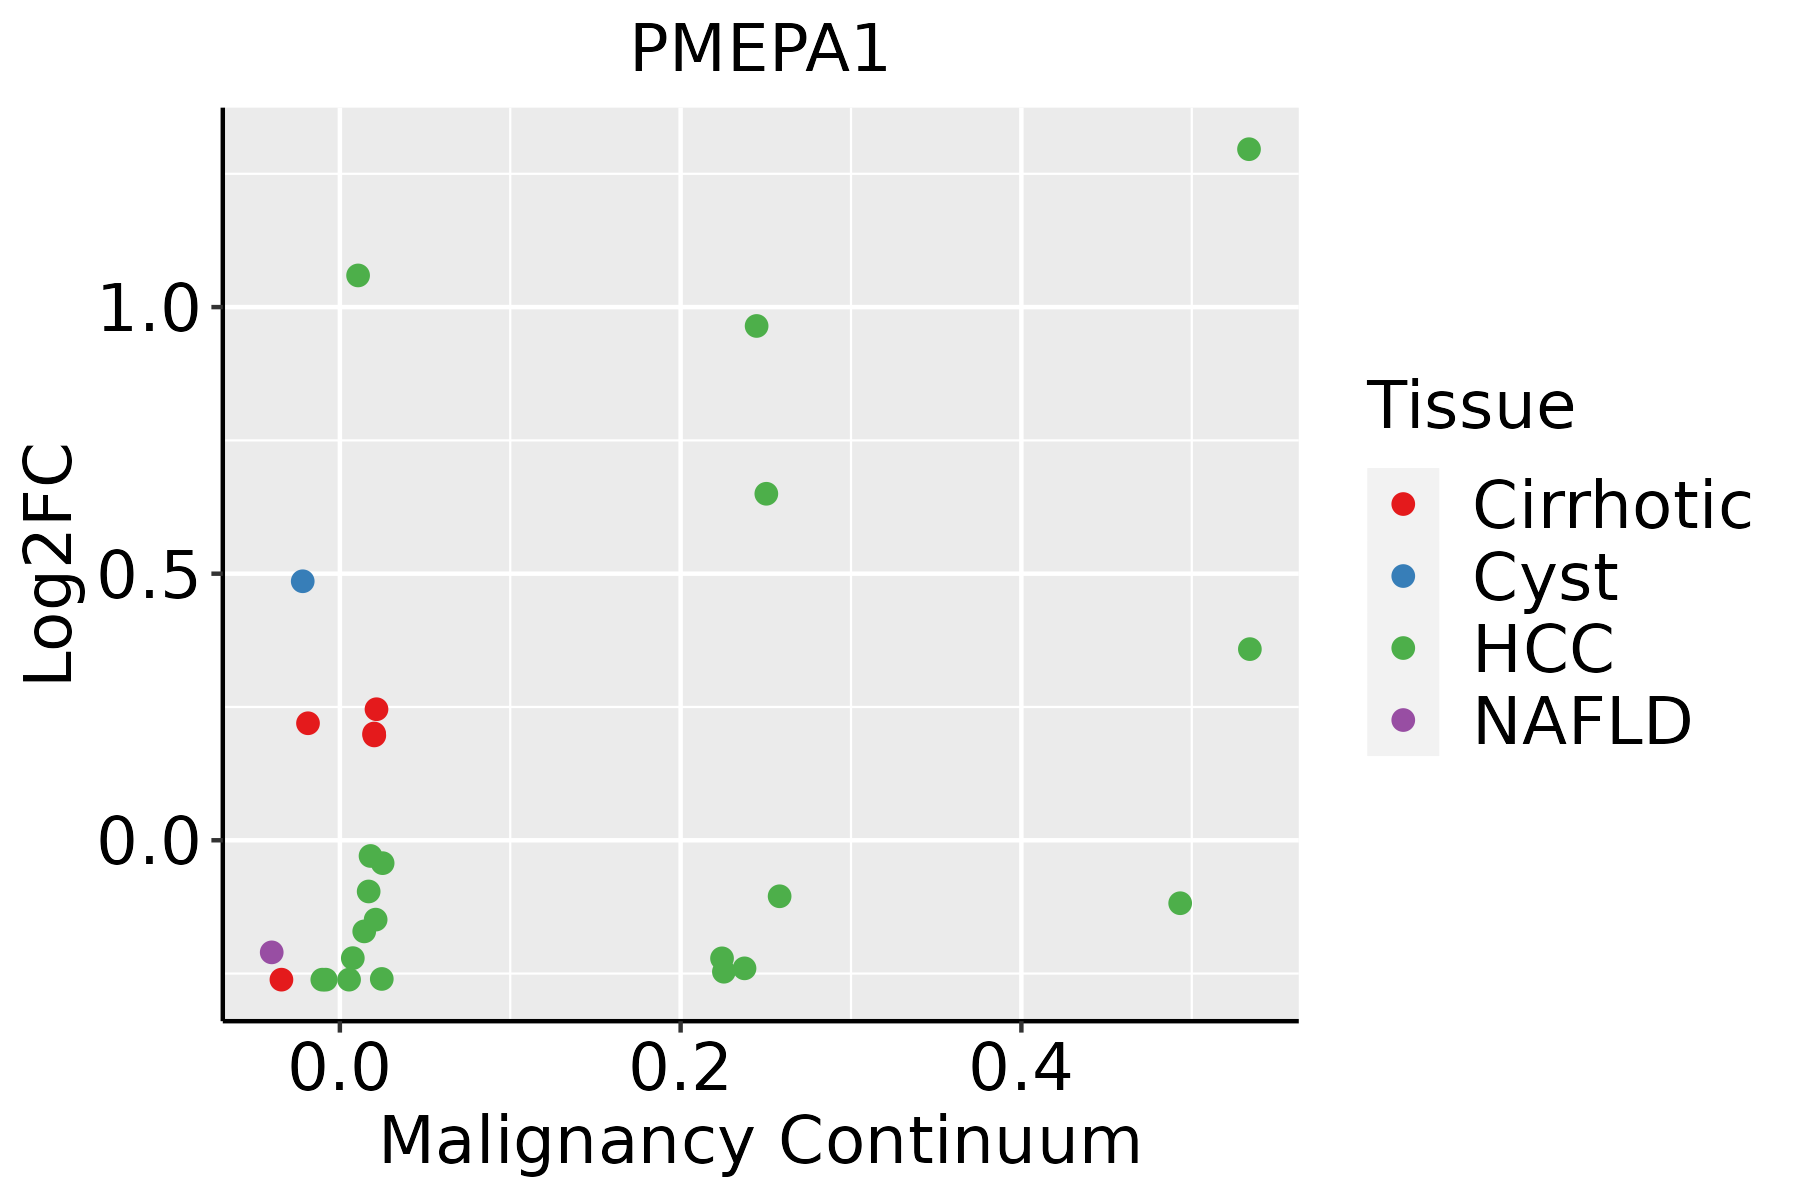
HCC: Hepatocellular carcinoma
NAFLD: Non-alcoholic fatty liver disease
LungThe image shows the transcriptomic changes along malignancy continuum.log2FC in expression of this searched gene in stem-like cells from each diseased tissue sample relative to stem-like cells in normal samples in each tissue plotted against the malignancy continuum. Samples are colored based on if they are from different disease stage.AAH: Atypical adenomatous hyperplasia
AIS: Adenocarcinoma in situ
IAC: Invasive lung adenocarcinoma
MIA: Minimally invasive adenocarcinoma
Oral CavityThe image shows the transcriptomic changes along malignancy continuum.log2FC in expression of this searched gene in stem-like cells from each diseased tissue sample relative to stem-like cells in normal samples in each tissue plotted against the malignancy continuum. Samples are colored based on if they are from different disease stage.EOLP: Erosive Oral lichen planus
LP: leukoplakia
NEOLP: Non-erosive oral lichen planus
OSCC: Oral squamous cell carcinoma
ProstateThe image shows the transcriptomic changes along malignancy continuum.log2FC in expression of this searched gene in stem-like cells from each diseased tissue sample relative to stem-like cells in normal samples in each tissue plotted against the malignancy continuum. Samples are colored based on if they are from different disease stage.
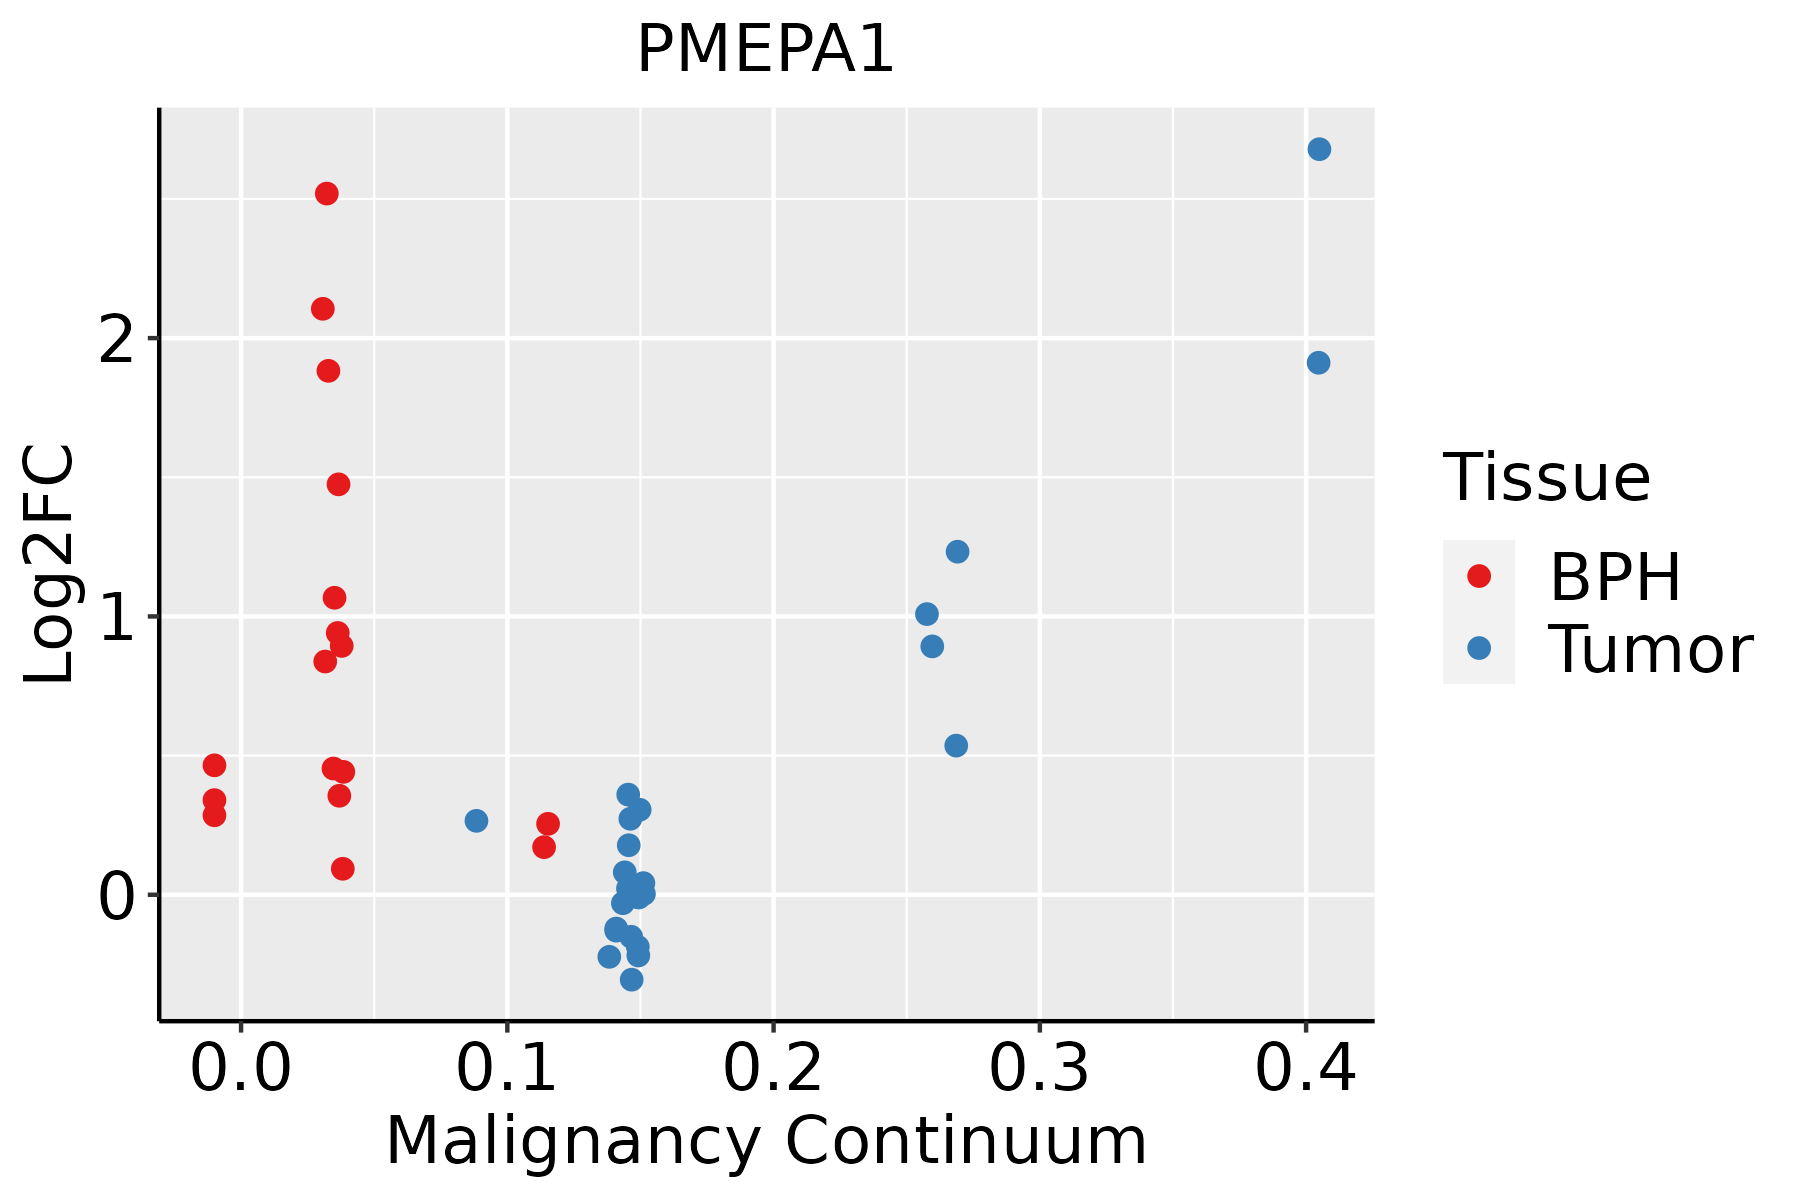
BPH: Benign Prostatic Hyperplasia
SkinThe image shows the transcriptomic changes along malignancy continuum.log2FC in expression of this searched gene in stem-like cells from each diseased tissue sample relative to stem-like cells in normal samples in each tissue plotted against the malignancy continuum. Samples are colored based on if they are from different disease stage.
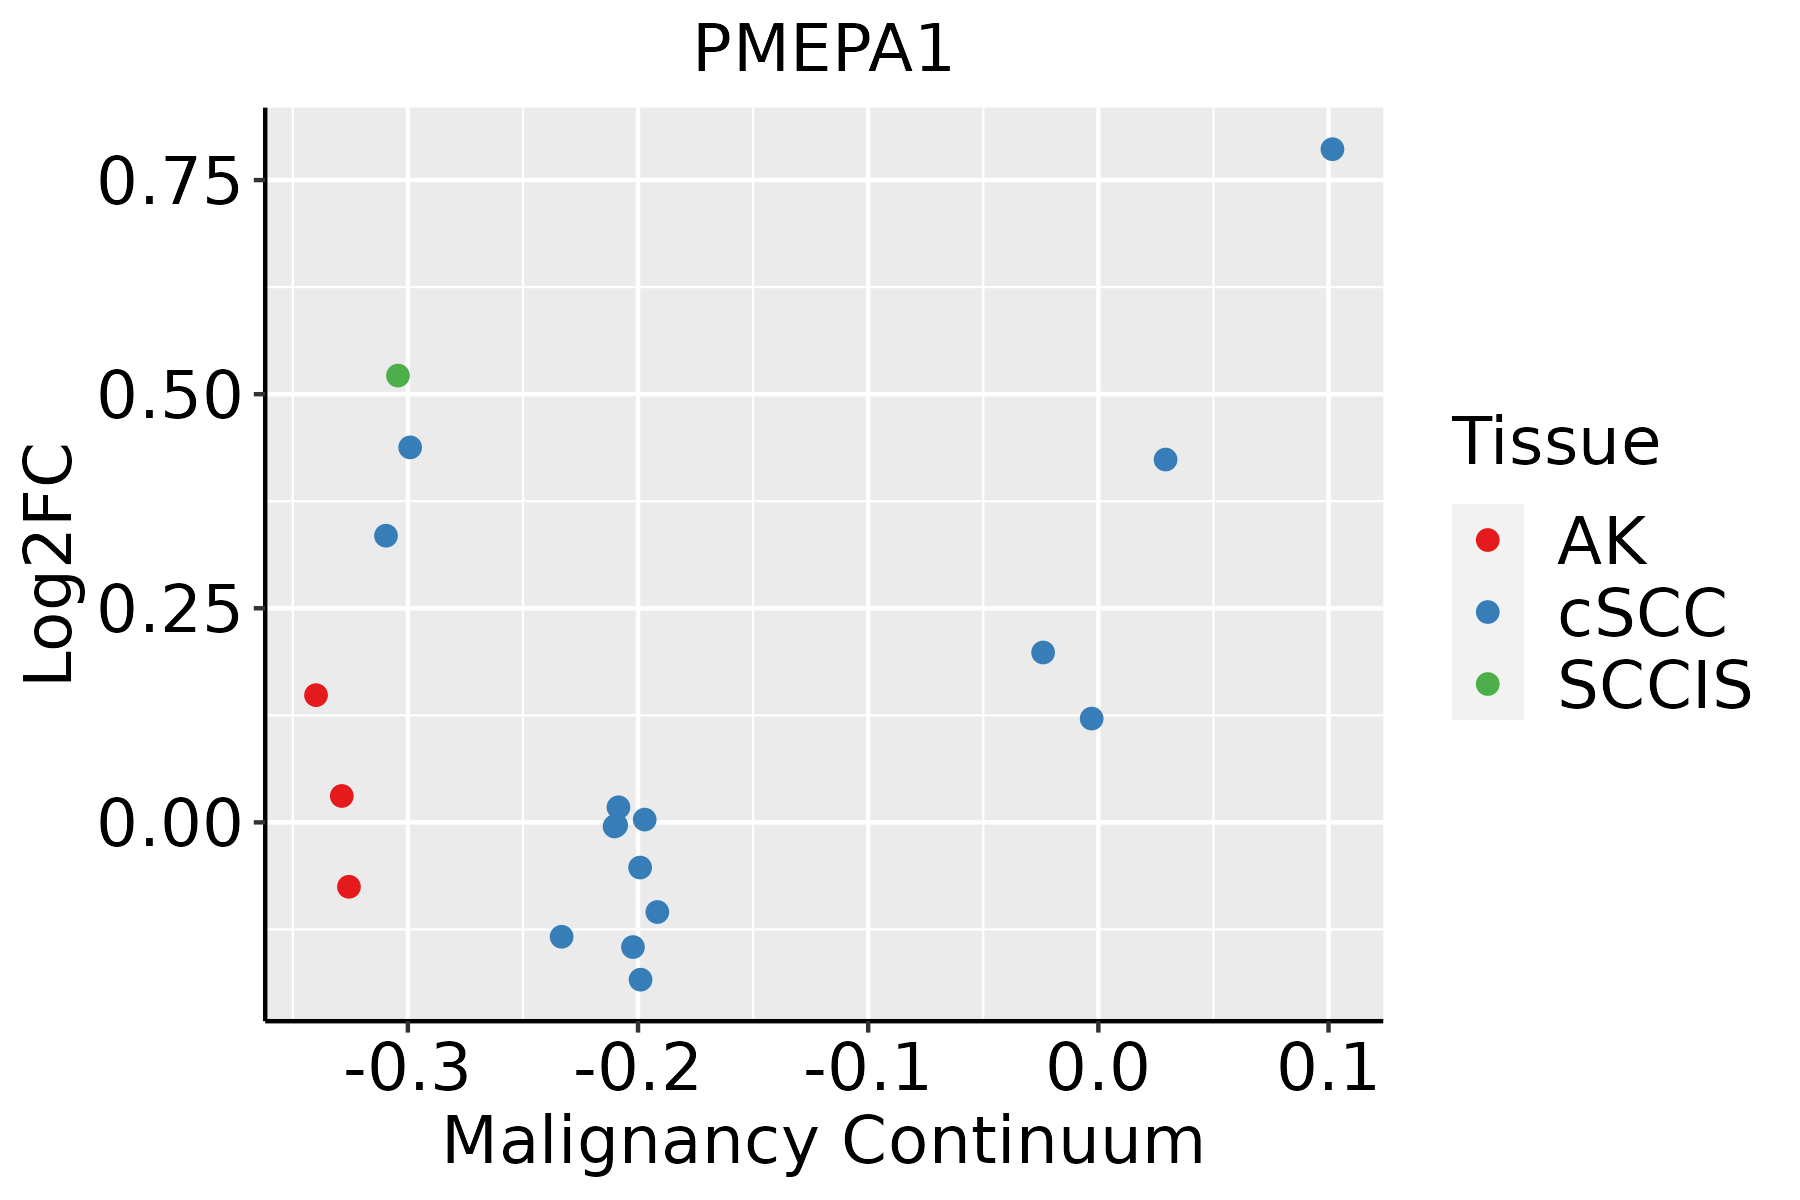
AK: Actinic keratosis
cSCC: Cutaneous squamous cell carcinoma
SCCIS:squamous cell carcinoma in situ
ThyroidThe image shows the transcriptomic changes along malignancy continuum.log2FC in expression of this searched gene in stem-like cells from each diseased tissue sample relative to stem-like cells in normal samples in each tissue plotted against the malignancy continuum. Samples are colored based on if they are from different disease stage.ATC: Anaplastic thyroid cancer
HT: Hashimoto's thyroiditis
PTC: Papillary thyroid cancer
∗log2FC in expression of this searched gene in stem-like cells from each diseased tissue sample relative to stem-like cells in normal samples in each tissue plotted against the malignancy continuum. Samples are colored based on if they are from different disease stage.

Top

Malignant transformation related pathway analysis

check buttonFind out the enriched GO biological processes and KEGG pathways involved in transition from healthy to precancer to cancer
check button Figure of enriched GO biological processes.
TissueDisease StageEnriched GO biological Processes
ColorectumADGO analysis - Figure of enriched GO biological processes: Top 15 enriched GO BP terms are showed in the bar plot of each disease state in each tissue. Each row represents a significant GO biological process which is colored according to the -log10(p.adjust).
ColorectumSERGO analysis - Figure of enriched GO biological processes: Top 15 enriched GO BP terms are showed in the bar plot of each disease state in each tissue. Each row represents a significant GO biological process which is colored according to the -log10(p.adjust).
ColorectumMSSGO analysis - Figure of enriched GO biological processes: Top 15 enriched GO BP terms are showed in the bar plot of each disease state in each tissue. Each row represents a significant GO biological process which is colored according to the -log10(p.adjust).
ColorectumMSI-HGO analysis - Figure of enriched GO biological processes: Top 15 enriched GO BP terms are showed in the bar plot of each disease state in each tissue. Each row represents a significant GO biological process which is colored according to the -log10(p.adjust).
ColorectumFAPGO analysis - Figure of enriched GO biological processes: Top 15 enriched GO BP terms are showed in the bar plot of each disease state in each tissue. Each row represents a significant GO biological process which is colored according to the -log10(p.adjust).
∗Top 15 enriched GO BP terms are showed in the bar plot of each disease state in each tissue. Each row represents a significant GO biological process which is colored according to the -log10(p.adjust).
Page: 1 2 3 4 5 6 7 8 9 

check button Enriched GO biological processes.
GO IDTissueDisease StageDescriptionGene RatioBg Ratiopvaluep.adjustCount
GO:004854527EsophagusHGINresponse to steroid hormone73/2587339/187236.06e-051.40e-0373
GO:004593626EsophagusHGINnegative regulation of phosphate metabolic process89/2587441/187231.24e-042.54e-0389
GO:001056326EsophagusHGINnegative regulation of phosphorus metabolic process89/2587442/187231.34e-042.71e-0389
GO:004232620EsophagusHGINnegative regulation of phosphorylation78/2587385/187232.77e-044.77e-0378
GO:000193320EsophagusHGINnegative regulation of protein phosphorylation69/2587342/187236.81e-049.26e-0369
GO:003051818EsophagusHGINintracellular steroid hormone receptor signaling pathway29/2587116/187239.06e-041.15e-0229
GO:007138320EsophagusHGINcellular response to steroid hormone stimulus44/2587204/187231.56e-031.79e-0244
GO:003133320EsophagusHGINnegative regulation of protein-containing complex assembly32/2587141/187232.80e-032.74e-0232
GO:004340118EsophagusHGINsteroid hormone mediated signaling pathway31/2587136/187233.01e-032.88e-0231
GO:0043254111EsophagusESCCregulation of protein-containing complex assembly278/8552428/187233.81e-162.77e-14278
GO:0010563111EsophagusESCCnegative regulation of phosphorus metabolic process274/8552442/187232.32e-129.41e-11274
GO:0045936111EsophagusESCCnegative regulation of phosphate metabolic process273/8552441/187233.18e-121.25e-10273
GO:0042326111EsophagusESCCnegative regulation of phosphorylation237/8552385/187231.86e-105.33e-09237
GO:0001933111EsophagusESCCnegative regulation of protein phosphorylation213/8552342/187233.54e-109.76e-09213
GO:0030522110EsophagusESCCintracellular receptor signaling pathway170/8552265/187238.58e-102.09e-08170
GO:0048545111EsophagusESCCresponse to steroid hormone204/8552339/187234.47e-088.11e-07204
GO:00715599EsophagusESCCresponse to transforming growth factor beta157/8552256/187232.95e-074.23e-06157
GO:0071383110EsophagusESCCcellular response to steroid hormone stimulus127/8552204/187231.26e-061.55e-05127
GO:00715609EsophagusESCCcellular response to transforming growth factor beta stimulus151/8552250/187231.78e-062.10e-05151
GO:00071799EsophagusESCCtransforming growth factor beta receptor signaling pathway121/8552198/187238.26e-068.03e-05121
Page: 1 2 3 4 5 6 7 8 9 10 11 12 13 14 15 16 17 18 19 20 21 22 

check button Enriched KEGG pathways.
Pathway IDTissueDisease StageDescriptionGene RatioBg Ratiopvaluep.adjustqvalueCount
Page: 1 

Top

Cell-cell communication analysis

check buttonIdentification of potential cell-cell interactions between two cell types and their ligand-receptor pairs for different disease states
LigandReceptorLRpairPathwayTissueDisease Stage
Page: 1 

Top

Single-cell gene regulatory network inference analysis

check buttonFind out the significant the regulons (TFs) and the target genes of each regulon across cell types for different disease states
TFCell TypeTissueDisease StageTarget GeneRSSRegulon Activity
∗The dot plots of a searched regulon are shown for all cell subpopulations in each disease state of each tissue based on the regulon specific score inferred using pySCENIC and by calculating the average expression.
Page: 1 

Top

Somatic mutation of malignant transformation related genes

check buttonAnnotation of somatic variants for genes involved in malignant transformation
Hugo SymbolVariant ClassVariant ClassificationdbSNP RSHGVScHGVSpHGVSp ShortSWISSPROTBIOTYPESIFTPolyPhenTumor Sample BarcodeTissueHistologySexAgeStageTherapy TypesDrugsOutcome
PMEPA1SNVMissense_Mutationc.286N>Cp.Glu96Glnp.E96QQ969W9protein_codingtolerated(0.08)possibly_damaging(0.447)TCGA-A8-A09K-01Breastbreast invasive carcinomaFemale>=65I/IIUnknownUnknownSD
PMEPA1SNVMissense_Mutationc.70T>Cp.Cys24Argp.C24RQ969W9protein_codingdeleterious_low_confidence(0.04)benign(0.056)TCGA-C8-A8HQ-01Breastbreast invasive carcinomaFemale<65I/IIUnknownUnknownSD
PMEPA1SNVMissense_Mutationnovelc.789N>Ap.His263Glnp.H263QQ969W9protein_codingtolerated_low_confidence(0.34)benign(0.003)TCGA-EW-A3U0-01Breastbreast invasive carcinomaFemale<65III/IVChemotherapycisplatinCR
PMEPA1insertionFrame_Shift_Insrs751873496c.624dupCp.Ser209GlnfsTer3p.S209Qfs*3Q969W9protein_codingTCGA-AN-A0FV-01Breastbreast invasive carcinomaFemale<65I/IIUnknownUnknownSD
PMEPA1SNVMissense_Mutationc.837N>Tp.Lys279Asnp.K279NQ969W9protein_codingdeleterious_low_confidence(0)probably_damaging(0.997)TCGA-2W-A8YY-01Cervixcervical & endocervical cancerFemale<65I/IIChemotherapycisplatinCR
PMEPA1SNVMissense_Mutationrs761429643c.353N>Ap.Arg118Hisp.R118HQ969W9protein_codingdeleterious(0)probably_damaging(0.998)TCGA-2W-A8YY-01Cervixcervical & endocervical cancerFemale<65I/IIChemotherapycisplatinCR
PMEPA1insertionFrame_Shift_Insnovelc.331_332insGAGGAp.Ala111GlyfsTer70p.A111Gfs*70Q969W9protein_codingTCGA-DS-A1OB-01Cervixcervical & endocervical cancerFemale<65I/IIChemotherapycarboplatinPD
PMEPA1SNVMissense_Mutationc.70N>Ap.Cys24Serp.C24SQ969W9protein_codingdeleterious_low_confidence(0.01)benign(0)TCGA-A6-2680-01Colorectumcolon adenocarcinomaFemale>=65I/IIUnknownUnknownSD
PMEPA1SNVMissense_Mutationc.43N>Ap.Ala15Thrp.A15TQ969W9protein_codingtolerated_low_confidence(0.2)benign(0.009)TCGA-AM-5821-01Colorectumcolon adenocarcinomaFemale>=65I/IIUnknownUnknownSD
PMEPA1SNVMissense_Mutationnovelc.167N>Cp.Val56Alap.V56AQ969W9protein_codingdeleterious(0.05)benign(0.266)TCGA-CK-4951-01Colorectumcolon adenocarcinomaFemale>=65I/IIUnknownUnknownPD
Page: 1 2 3 4 5 6 

Top

Related drugs of malignant transformation related genes

check buttonIdentification of chemicals and drugs interact with genes involved in malignant transfromation
(DGIdb 4.0)
Entrez IDSymbolCategoryInteraction TypesDrug Claim NameDrug NamePMIDs
Page: 1