
|
|||||
|
 | |
| |
| |
| |
| |
| |
|
Gene: OXSR1 |
Gene summary for OXSR1 |
| Gene information | Species | Human | Gene symbol | OXSR1 | Gene ID | 9943 |
| Gene name | oxidative stress responsive kinase 1 | |
| Gene Alias | OSR1 | |
| Cytomap | 3p22.2 | |
| Gene Type | protein-coding | GO ID | GO:0002376 | UniProtAcc | A0A024R2M7 |
Top |
Malignant transformation analysis |
| Identification of the aberrant gene expression in precancerous and cancerous lesions by comparing the gene expression of stem-like cells in diseased tissues with normal stem cells |
| Entrez ID | Symbol | Replicates | Species | Organ | Tissue | Adj P-value | Log2FC | Malignancy |
| 9943 | OXSR1 | AEH-subject1 | Human | Endometrium | AEH | 5.41e-12 | 4.48e-01 | -0.3059 |
| 9943 | OXSR1 | AEH-subject4 | Human | Endometrium | AEH | 1.20e-10 | 4.66e-01 | -0.2657 |
| 9943 | OXSR1 | AEH-subject5 | Human | Endometrium | AEH | 4.22e-24 | 7.83e-01 | -0.2953 |
| 9943 | OXSR1 | EEC-subject1 | Human | Endometrium | EEC | 8.97e-08 | 3.79e-01 | -0.2682 |
| 9943 | OXSR1 | EEC-subject2 | Human | Endometrium | EEC | 9.37e-04 | 3.20e-01 | -0.2607 |
| 9943 | OXSR1 | EEC-subject4 | Human | Endometrium | EEC | 3.93e-02 | 2.34e-01 | -0.2571 |
| 9943 | OXSR1 | GSM6177620_NYU_UCEC1_lib1_lib1 | Human | Endometrium | EEC | 3.47e-05 | 1.46e-01 | -0.1869 |
| 9943 | OXSR1 | GSM6177620_NYU_UCEC1_lib2_lib2 | Human | Endometrium | EEC | 5.63e-05 | 1.48e-01 | -0.1875 |
| 9943 | OXSR1 | GSM6177620_NYU_UCEC1_lib3_lib3 | Human | Endometrium | EEC | 1.62e-05 | -2.62e-02 | -0.1883 |
| 9943 | OXSR1 | GSM6177621_NYU_UCEC2_lib1_lib1 | Human | Endometrium | EEC | 1.06e-02 | 1.28e-01 | -0.1934 |
| 9943 | OXSR1 | GSM6177622_NYU_UCEC3_lib1_lib1 | Human | Endometrium | EEC | 2.77e-07 | -3.56e-03 | -0.1917 |
| 9943 | OXSR1 | GSM6177622_NYU_UCEC3_lib2_lib2 | Human | Endometrium | EEC | 1.89e-06 | -5.57e-04 | -0.1916 |
| 9943 | OXSR1 | LZE4T | Human | Esophagus | ESCC | 3.58e-11 | 8.49e-02 | 0.0811 |
| 9943 | OXSR1 | LZE5T | Human | Esophagus | ESCC | 5.19e-03 | 3.66e-02 | 0.0514 |
| 9943 | OXSR1 | LZE7T | Human | Esophagus | ESCC | 5.47e-05 | 9.46e-03 | 0.0667 |
| 9943 | OXSR1 | LZE24T | Human | Esophagus | ESCC | 2.48e-10 | 3.32e-01 | 0.0596 |
| 9943 | OXSR1 | P1T-E | Human | Esophagus | ESCC | 1.12e-04 | 6.40e-01 | 0.0875 |
| 9943 | OXSR1 | P2T-E | Human | Esophagus | ESCC | 3.52e-18 | 1.03e-01 | 0.1177 |
| 9943 | OXSR1 | P4T-E | Human | Esophagus | ESCC | 1.76e-12 | 2.35e-01 | 0.1323 |
| 9943 | OXSR1 | P5T-E | Human | Esophagus | ESCC | 9.89e-10 | 2.23e-01 | 0.1327 |
| Page: 1 2 3 4 5 6 |
| Tissue | Expression Dynamics | Abbreviation |
| Endometrium |  | AEH: Atypical endometrial hyperplasia |
| EEC: Endometrioid Cancer | ||
| Esophagus |  | ESCC: Esophageal squamous cell carcinoma |
| HGIN: High-grade intraepithelial neoplasias | ||
| LGIN: Low-grade intraepithelial neoplasias | ||
| Liver | 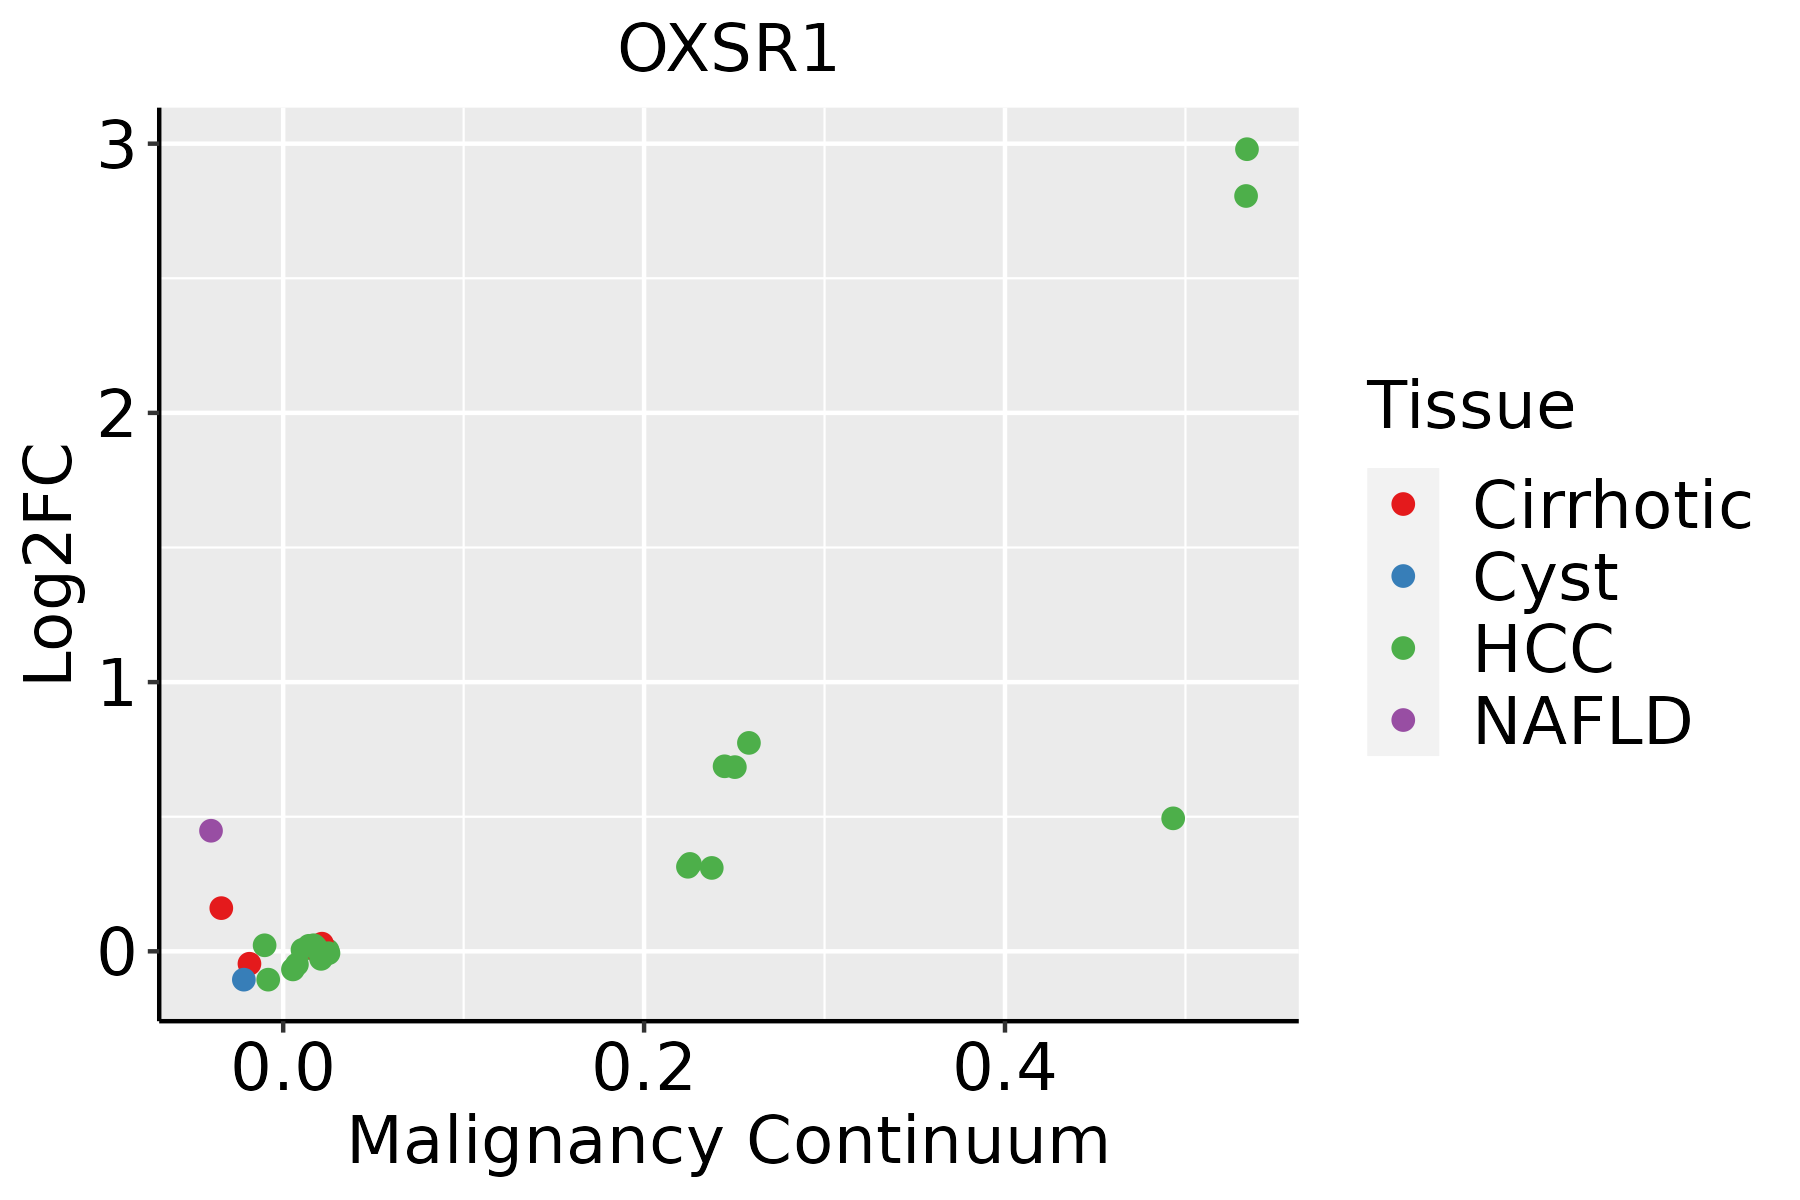 | HCC: Hepatocellular carcinoma |
| NAFLD: Non-alcoholic fatty liver disease | ||
| Skin | 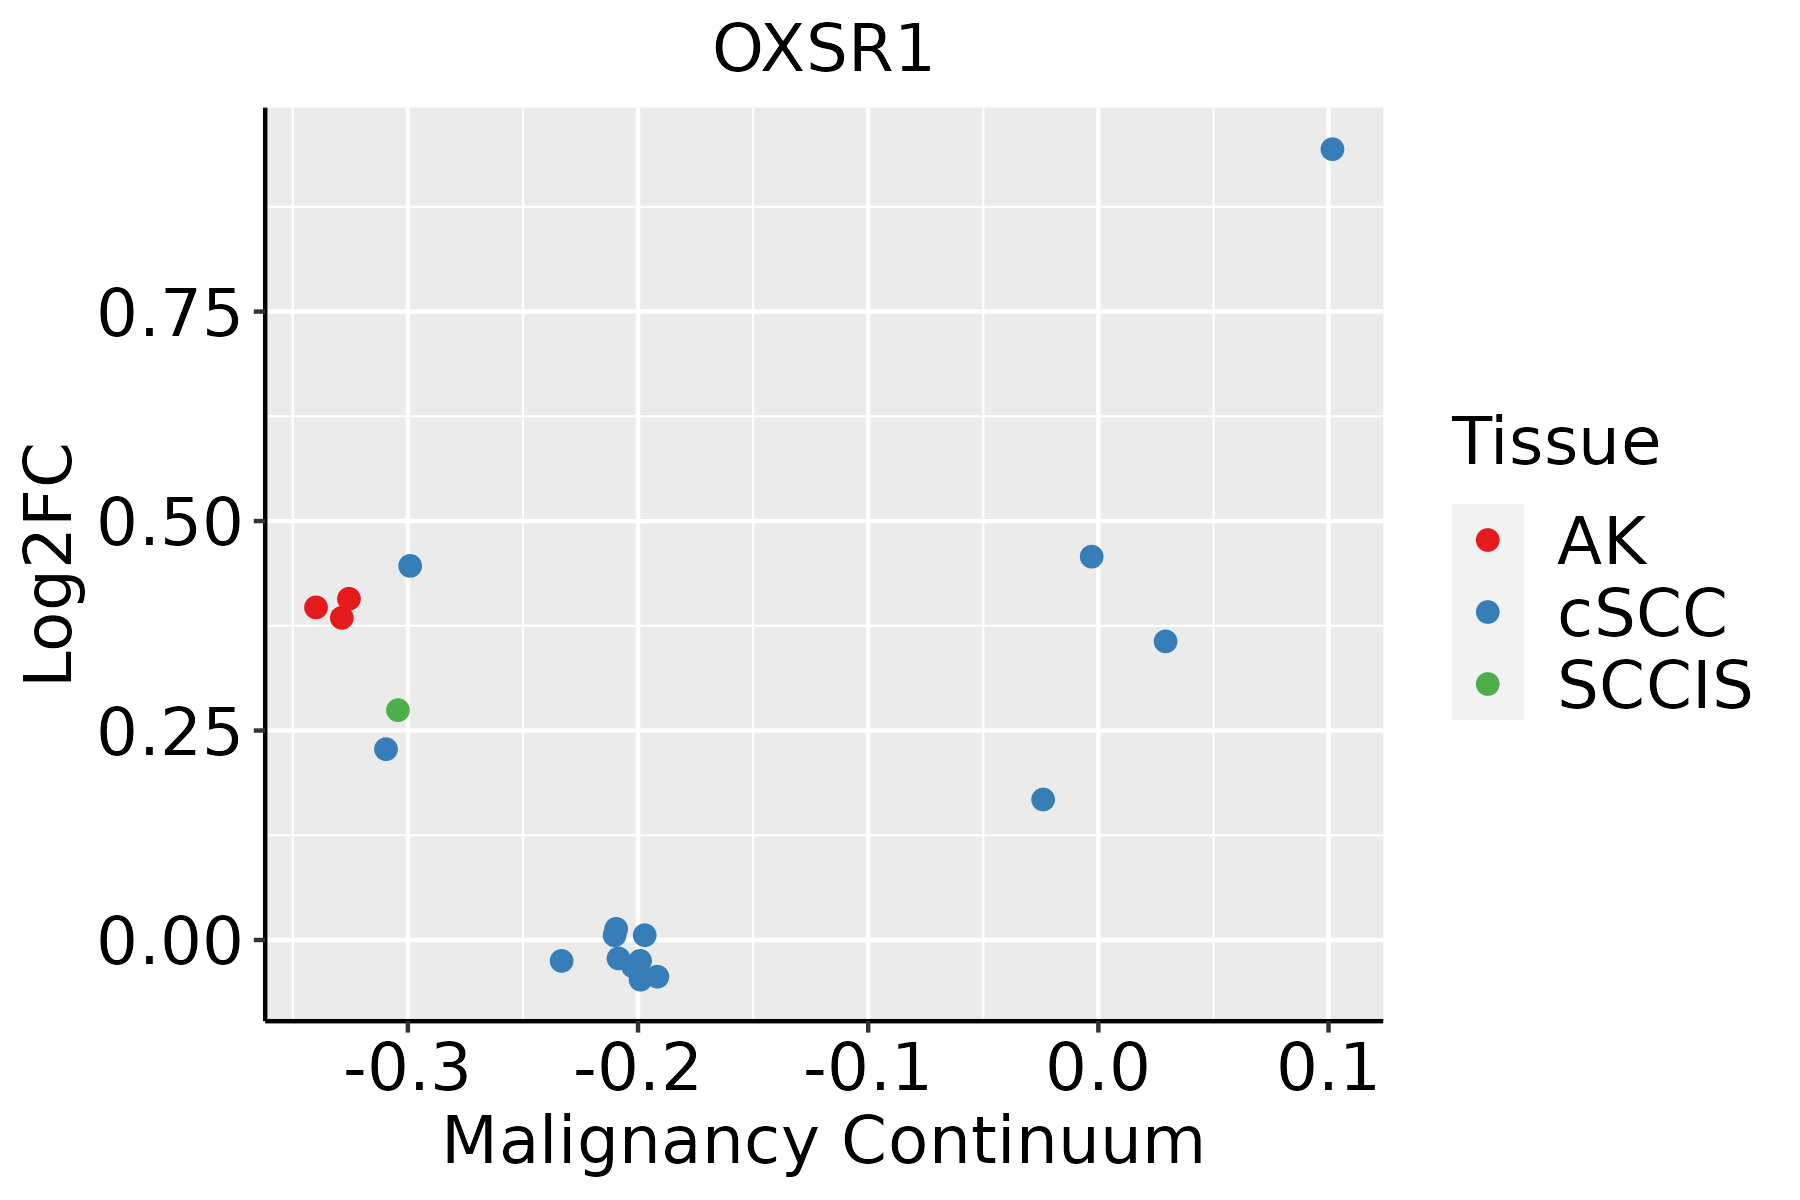 | AK: Actinic keratosis |
| cSCC: Cutaneous squamous cell carcinoma | ||
| SCCIS:squamous cell carcinoma in situ | ||
| Thyroid |  | ATC: Anaplastic thyroid cancer |
| HT: Hashimoto's thyroiditis | ||
| PTC: Papillary thyroid cancer |
| ∗log2FC in expression of this searched gene in stem-like cells from each diseased tissue sample relative to stem-like cells in normal samples in each tissue plotted against the malignancy continuum. Samples are colored based on if they are from different disease stage. |
Top |
Malignant transformation related pathway analysis |
| Find out the enriched GO biological processes and KEGG pathways involved in transition from healthy to precancer to cancer |
| Tissue | Disease Stage | Enriched GO biological Processes |
| Colorectum | AD |  |
| Colorectum | SER |  |
| Colorectum | MSS |  |
| Colorectum | MSI-H |  |
| Colorectum | FAP |  |
| ∗Top 15 enriched GO BP terms are showed in the bar plot of each disease state in each tissue. Each row represents a significant GO biological process which is colored according to the -log10(p.adjust). |
| Page: 1 2 3 4 5 6 7 8 9 |
| GO ID | Tissue | Disease Stage | Description | Gene Ratio | Bg Ratio | pvalue | p.adjust | Count |
| GO:190162311 | Skin | SCCIS | regulation of lymphocyte chemotaxis | 6/919 | 25/18723 | 1.09e-03 | 1.32e-02 | 6 |
| GO:0070098 | Skin | SCCIS | chemokine-mediated signaling pathway | 12/919 | 88/18723 | 1.20e-03 | 1.42e-02 | 12 |
| GO:01401311 | Skin | SCCIS | positive regulation of lymphocyte chemotaxis | 5/919 | 19/18723 | 1.84e-03 | 1.96e-02 | 5 |
| GO:19013794 | Skin | SCCIS | regulation of potassium ion transmembrane transport | 12/919 | 95/18723 | 2.34e-03 | 2.34e-02 | 12 |
| GO:000697015 | Skin | SCCIS | response to osmotic stress | 11/919 | 84/18723 | 2.63e-03 | 2.48e-02 | 11 |
| GO:00108201 | Skin | SCCIS | positive regulation of T cell chemotaxis | 4/919 | 15/18723 | 5.10e-03 | 4.10e-02 | 4 |
| GO:19010163 | Skin | SCCIS | regulation of potassium ion transmembrane transporter activity | 9/919 | 68/18723 | 5.82e-03 | 4.50e-02 | 9 |
| GO:00108191 | Skin | SCCIS | regulation of T cell chemotaxis | 4/919 | 16/18723 | 6.53e-03 | 4.89e-02 | 4 |
| GO:000697929 | Skin | cSCC | response to oxidative stress | 184/4864 | 446/18723 | 8.57e-13 | 4.89e-11 | 184 |
| GO:006219729 | Skin | cSCC | cellular response to chemical stress | 138/4864 | 337/18723 | 1.10e-09 | 4.23e-08 | 138 |
| GO:007121425 | Skin | cSCC | cellular response to abiotic stimulus | 135/4864 | 331/18723 | 2.26e-09 | 8.11e-08 | 135 |
| GO:010400425 | Skin | cSCC | cellular response to environmental stimulus | 135/4864 | 331/18723 | 2.26e-09 | 8.11e-08 | 135 |
| GO:004677715 | Skin | cSCC | protein autophosphorylation | 84/4864 | 227/18723 | 1.53e-04 | 1.35e-03 | 84 |
| GO:000697021 | Skin | cSCC | response to osmotic stress | 35/4864 | 84/18723 | 1.23e-03 | 7.97e-03 | 35 |
| GO:0006979113 | Thyroid | PTC | response to oxidative stress | 234/5968 | 446/18723 | 6.97e-20 | 9.77e-18 | 234 |
| GO:0062197113 | Thyroid | PTC | cellular response to chemical stress | 180/5968 | 337/18723 | 1.36e-16 | 1.16e-14 | 180 |
| GO:0071214111 | Thyroid | PTC | cellular response to abiotic stimulus | 158/5968 | 331/18723 | 9.90e-10 | 2.89e-08 | 158 |
| GO:0104004111 | Thyroid | PTC | cellular response to environmental stimulus | 158/5968 | 331/18723 | 9.90e-10 | 2.89e-08 | 158 |
| GO:004677716 | Thyroid | PTC | protein autophosphorylation | 110/5968 | 227/18723 | 1.25e-07 | 2.44e-06 | 110 |
| GO:001821017 | Thyroid | PTC | peptidyl-threonine modification | 66/5968 | 125/18723 | 9.50e-07 | 1.43e-05 | 66 |
| Page: 1 2 3 4 5 6 7 8 9 10 |
| Pathway ID | Tissue | Disease Stage | Description | Gene Ratio | Bg Ratio | pvalue | p.adjust | qvalue | Count |
| Page: 1 |
Top |
Cell-cell communication analysis |
| Identification of potential cell-cell interactions between two cell types and their ligand-receptor pairs for different disease states |
| Ligand | Receptor | LRpair | Pathway | Tissue | Disease Stage |
| Page: 1 |
Top |
Single-cell gene regulatory network inference analysis |
| Find out the significant the regulons (TFs) and the target genes of each regulon across cell types for different disease states |
| TF | Cell Type | Tissue | Disease Stage | Target Gene | RSS | Regulon Activity |
| ∗The dot plots of a searched regulon are shown for all cell subpopulations in each disease state of each tissue based on the regulon specific score inferred using pySCENIC and by calculating the average expression. |
| Page: 1 |
Top |
Somatic mutation of malignant transformation related genes |
| Annotation of somatic variants for genes involved in malignant transformation |
| Hugo Symbol | Variant Class | Variant Classification | dbSNP RS | HGVSc | HGVSp | HGVSp Short | SWISSPROT | BIOTYPE | SIFT | PolyPhen | Tumor Sample Barcode | Tissue | Histology | Sex | Age | Stage | Therapy Types | Drugs | Outcome |
| OXSR1 | SNV | Missense_Mutation | c.135C>G | p.Ile45Met | p.I45M | O95747 | protein_coding | deleterious(0.04) | probably_damaging(1) | TCGA-BH-A1FC-01 | Breast | breast invasive carcinoma | Female | >=65 | I/II | Unknown | Unknown | SD | |
| OXSR1 | insertion | Nonsense_Mutation | novel | c.414_415insAAAAATGGACAGGAAAGATAACAGAAGAGAGATGGCAACAATATTCTGGAAGATAGCAG | p.Ile143GlufsTer3 | p.I143Efs*3 | O95747 | protein_coding | TCGA-AO-A128-01 | Breast | breast invasive carcinoma | Female | <65 | I/II | Chemotherapy | doxorubicin | SD | ||
| OXSR1 | SNV | Missense_Mutation | c.214C>G | p.His72Asp | p.H72D | O95747 | protein_coding | deleterious(0) | probably_damaging(0.999) | TCGA-EA-A411-01 | Cervix | cervical & endocervical cancer | Female | <65 | I/II | Unknown | Unknown | SD | |
| OXSR1 | SNV | Missense_Mutation | c.605N>A | p.Arg202His | p.R202H | O95747 | protein_coding | tolerated(0.46) | probably_damaging(0.946) | TCGA-EK-A2R7-01 | Cervix | cervical & endocervical cancer | Female | <65 | I/II | Unknown | Unknown | SD | |
| OXSR1 | SNV | Missense_Mutation | c.403G>A | p.Glu135Lys | p.E135K | O95747 | protein_coding | deleterious(0.01) | benign(0.358) | TCGA-IR-A3LA-01 | Cervix | cervical & endocervical cancer | Female | <65 | I/II | Chemotherapy | cisplatin | CR | |
| OXSR1 | SNV | Missense_Mutation | c.892G>C | p.Glu298Gln | p.E298Q | O95747 | protein_coding | tolerated(0.05) | possibly_damaging(0.734) | TCGA-LP-A4AW-01 | Cervix | cervical & endocervical cancer | Female | <65 | I/II | Unknown | Unknown | SD | |
| OXSR1 | SNV | Missense_Mutation | novel | c.1345N>T | p.Asp449Tyr | p.D449Y | O95747 | protein_coding | deleterious(0) | probably_damaging(0.994) | TCGA-AA-3984-01 | Colorectum | colon adenocarcinoma | Female | <65 | I/II | Unknown | Unknown | SD |
| OXSR1 | SNV | Missense_Mutation | novel | c.536N>A | p.Arg179Gln | p.R179Q | O95747 | protein_coding | deleterious(0.02) | possibly_damaging(0.59) | TCGA-AZ-4315-01 | Colorectum | colon adenocarcinoma | Male | <65 | I/II | Unknown | Unknown | SD |
| OXSR1 | SNV | Missense_Mutation | rs777107244 | c.980G>A | p.Arg327His | p.R327H | O95747 | protein_coding | tolerated(0.29) | benign(0.003) | TCGA-AZ-4614-01 | Colorectum | colon adenocarcinoma | Female | >=65 | I/II | Unknown | Unknown | PD |
| OXSR1 | SNV | Missense_Mutation | c.1352N>A | p.Arg451Gln | p.R451Q | O95747 | protein_coding | deleterious(0.02) | probably_damaging(0.958) | TCGA-EI-6917-01 | Colorectum | rectum adenocarcinoma | Male | <65 | III/IV | Chemotherapy | 5fluorouracil+oxaciplatina+l-folinian | SD |
| Page: 1 2 3 4 5 |
Top |
Related drugs of malignant transformation related genes |
| Identification of chemicals and drugs interact with genes involved in malignant transfromation |
| (DGIdb 4.0) |
| Entrez ID | Symbol | Category | Interaction Types | Drug Claim Name | Drug Name | PMIDs |
| 9943 | OXSR1 | DRUGGABLE GENOME, KINASE, ENZYME, SERINE THREONINE KINASE | inhibitor | 249565899 |
| Page: 1 |

Copyright 2023-Present -The University of Texas Health Science Center at Houston |