Schematic overview of the cellular and molecular mechanisms involved in the cancer progression, including the proposed cellular and molecular mechanisms in cancer cells trajectory. AT1: alveolar type 1 cells; AT2: alveolar type 2 cells; AAH: atypical adenomatous hyperplasia; AIS: adenocarcinoma in situ; MIA: minimally invasive adenocarcinoma; IA: invasive adenocarcinoma; EMT: epithelial-mesenchymal transition

Home

Download

Statistics

Help

Contact

Center for Computational Systems Medicine
leaf

Gene summary

leaf

Malignant transformation analysis

leaf

Malignant transformation related pathway analysis

leaf

Cell-cell communication analysis

leaf

Single-cell gene regulatory network inference analysis

leaf

Somatic mutation of malignant transformation related genes

leaf

Related drugs of malignant transformation related genes

Gene: OXR1

Gene summary for OXR1

check button Gene summary.

Gene informationSpeciesHuman
Gene symbol

OXR1

Gene ID

55074

Gene nameoxidation resistance 1
Gene AliasCHEGDD
Cytomap8q23.1
Gene Typeprotein-coding
GO ID

GO:0006464

UniProtAcc

Q8N573


Top

Malignant transformation analysis

check button Identification of the aberrant gene expression in precancerous and cancerous lesions by comparing the gene expression of stem-like cells in diseased tissues with normal stem cells
check button Malignant transformation involving gene list.
Entrez IDSymbolReplicatesSpeciesOrganTissueAdj P-valueLog2FCMalignancy
55074OXR1CA_HPV_3HumanCervixCC1.09e-039.66e-020.0414
55074OXR1CCI_1HumanCervixCC5.66e-047.60e-010.528
55074OXR1CCI_2HumanCervixCC9.61e-051.36e+000.5249
55074OXR1CCI_3HumanCervixCC2.05e-045.72e-010.516
55074OXR1HTA11_3410_2000001011HumanColorectumAD2.68e-20-6.50e-010.0155
55074OXR1HTA11_2951_2000001011HumanColorectumAD8.57e-03-7.23e-010.0216
55074OXR1HTA11_866_2000001011HumanColorectumAD8.96e-07-2.91e-01-0.1001
55074OXR1HTA11_866_3004761011HumanColorectumAD4.61e-06-4.77e-010.096
55074OXR1HTA11_8622_2000001021HumanColorectumSER1.09e-03-6.10e-010.0528
55074OXR1HTA11_7696_3000711011HumanColorectumAD8.00e-08-3.59e-010.0674
55074OXR1HTA11_6818_2000001011HumanColorectumAD8.25e-04-3.97e-010.0112
55074OXR1HTA11_6818_2000001021HumanColorectumAD3.27e-08-5.92e-010.0588
55074OXR1HTA11_99999973899_84307HumanColorectumMSS1.99e-03-4.91e-010.2585
55074OXR1HTA11_99999974143_84620HumanColorectumMSS8.73e-22-6.05e-010.3005
55074OXR1F007HumanColorectumFAP1.04e-05-3.59e-010.1176
55074OXR1A002-C-010HumanColorectumFAP3.11e-04-2.28e-010.242
55074OXR1A001-C-207HumanColorectumFAP1.01e-06-3.23e-010.1278
55074OXR1A015-C-203HumanColorectumFAP1.91e-40-5.46e-01-0.1294
55074OXR1A015-C-204HumanColorectumFAP7.77e-12-4.53e-01-0.0228
55074OXR1A014-C-040HumanColorectumFAP1.31e-08-6.05e-01-0.1184
Page: 1 2 3 4 5 6 7 8 9 10 

check button Transcriptomic changes along malignancy continuum.
TissueExpression DynamicsAbbreviation
CervixThe image shows the transcriptomic changes along malignancy continuum.log2FC in expression of this searched gene in stem-like cells from each diseased tissue sample relative to stem-like cells in normal samples in each tissue plotted against the malignancy continuum. Samples are colored based on if they are from different disease stage.CC: Cervix cancer
HSIL_HPV: HPV-infected high-grade squamous intraepithelial lesions
N_HPV: HPV-infected normal cervix
Colorectum (GSE201348)The image shows the transcriptomic changes along malignancy continuum.log2FC in expression of this searched gene in stem-like cells from each diseased tissue sample relative to stem-like cells in normal samples in each tissue plotted against the malignancy continuum. Samples are colored based on if they are from different disease stage.
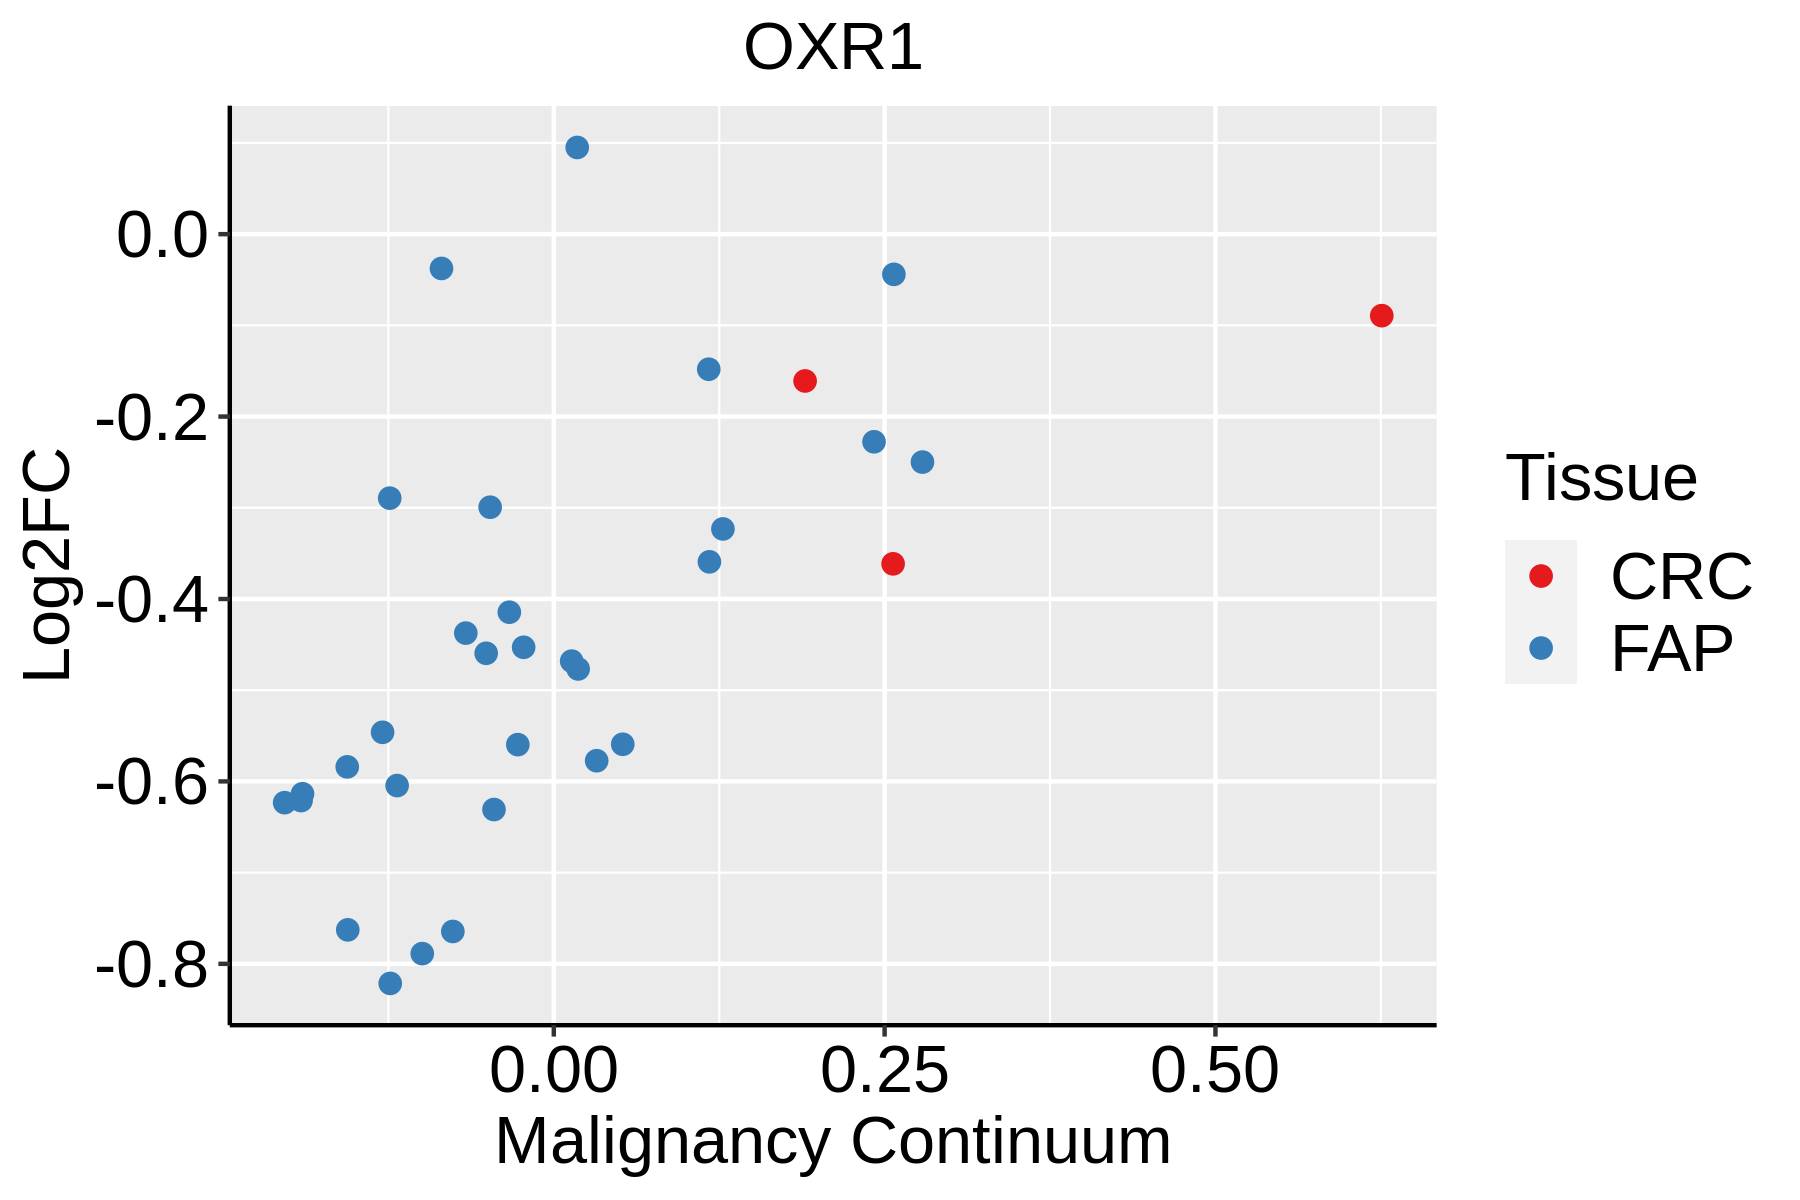
FAP: Familial adenomatous polyposis
CRC: Colorectal cancer
Colorectum (HTA11)The image shows the transcriptomic changes along malignancy continuum.log2FC in expression of this searched gene in stem-like cells from each diseased tissue sample relative to stem-like cells in normal samples in each tissue plotted against the malignancy continuum. Samples are colored based on if they are from different disease stage.AD: Adenomas
SER: Sessile serrated lesions
MSI-H: Microsatellite-high colorectal cancer
MSS: Microsatellite stable colorectal cancer
EndometriumThe image shows the transcriptomic changes along malignancy continuum.log2FC in expression of this searched gene in stem-like cells from each diseased tissue sample relative to stem-like cells in normal samples in each tissue plotted against the malignancy continuum. Samples are colored based on if they are from different disease stage.
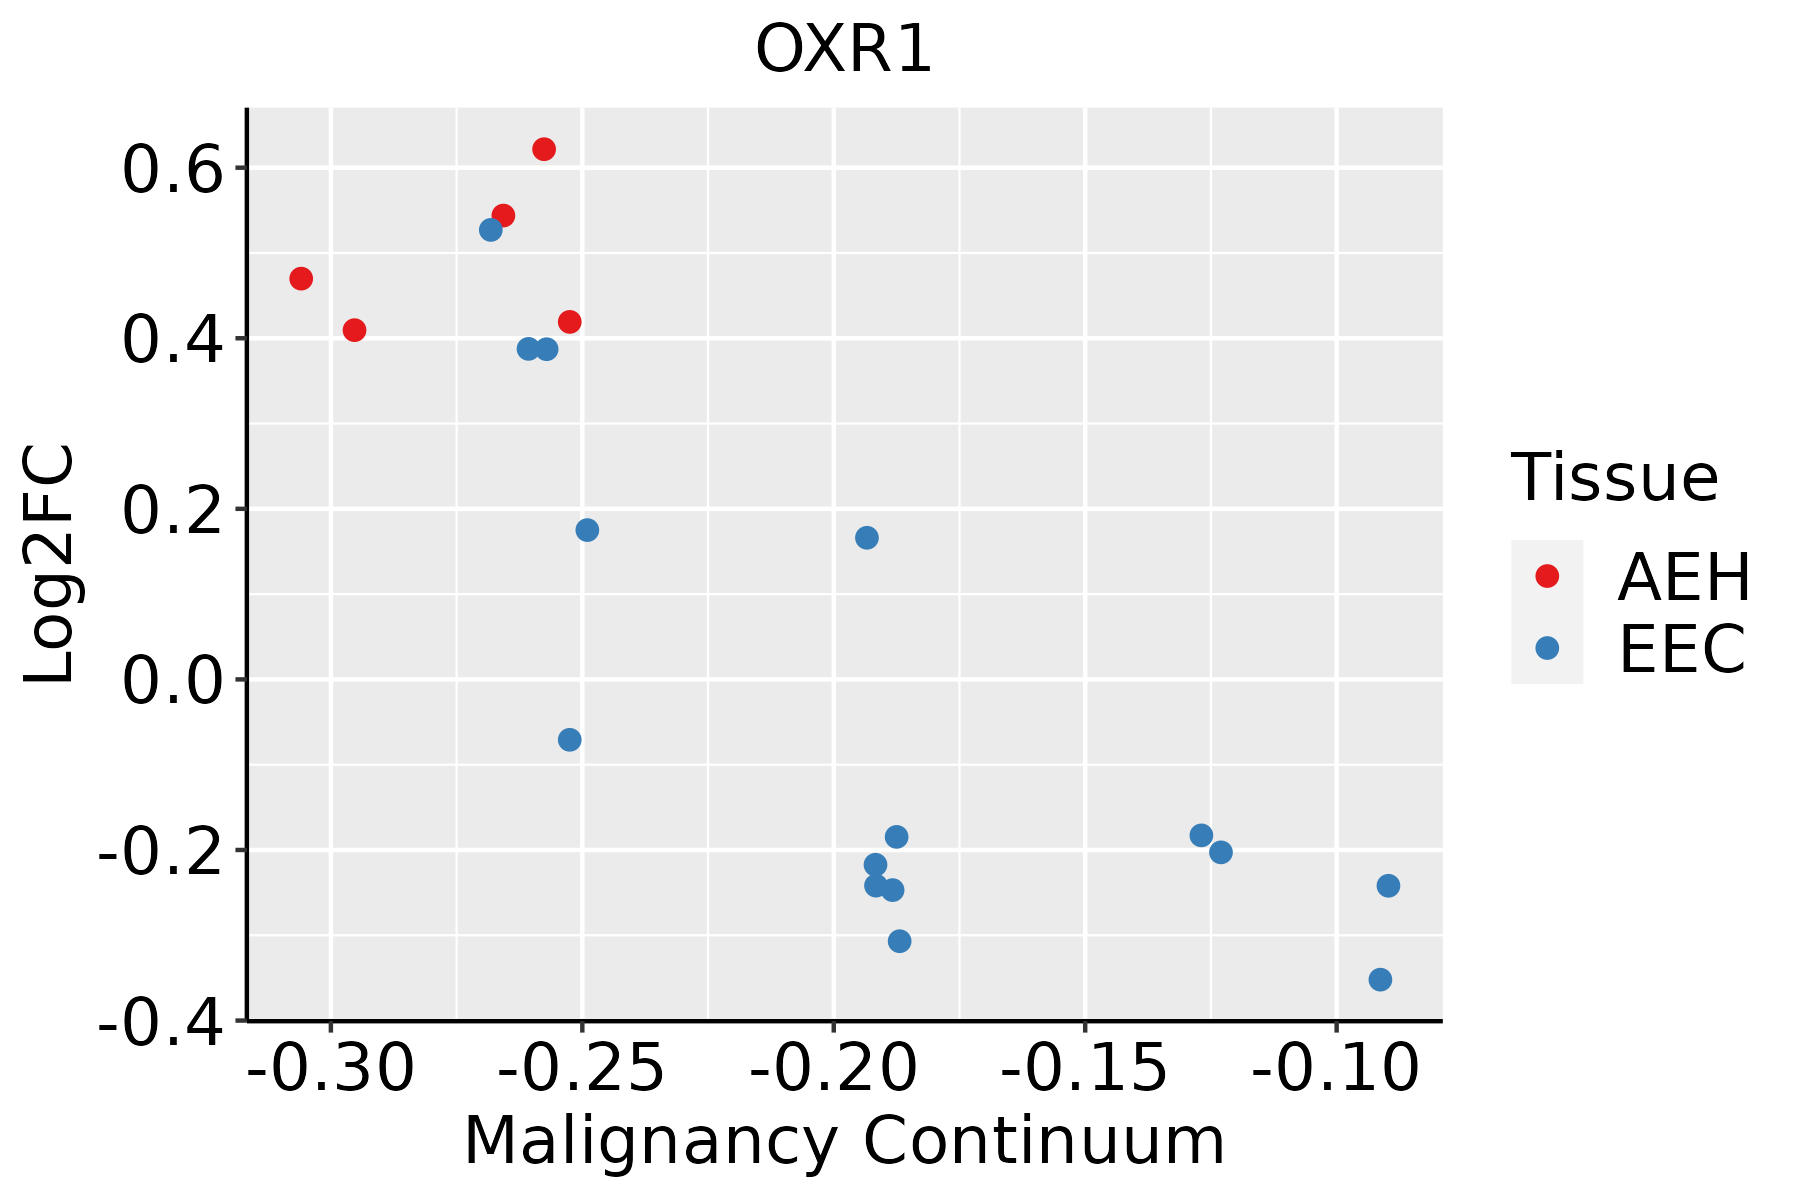
AEH: Atypical endometrial hyperplasia
EEC: Endometrioid Cancer
EsophagusThe image shows the transcriptomic changes along malignancy continuum.log2FC in expression of this searched gene in stem-like cells from each diseased tissue sample relative to stem-like cells in normal samples in each tissue plotted against the malignancy continuum. Samples are colored based on if they are from different disease stage.
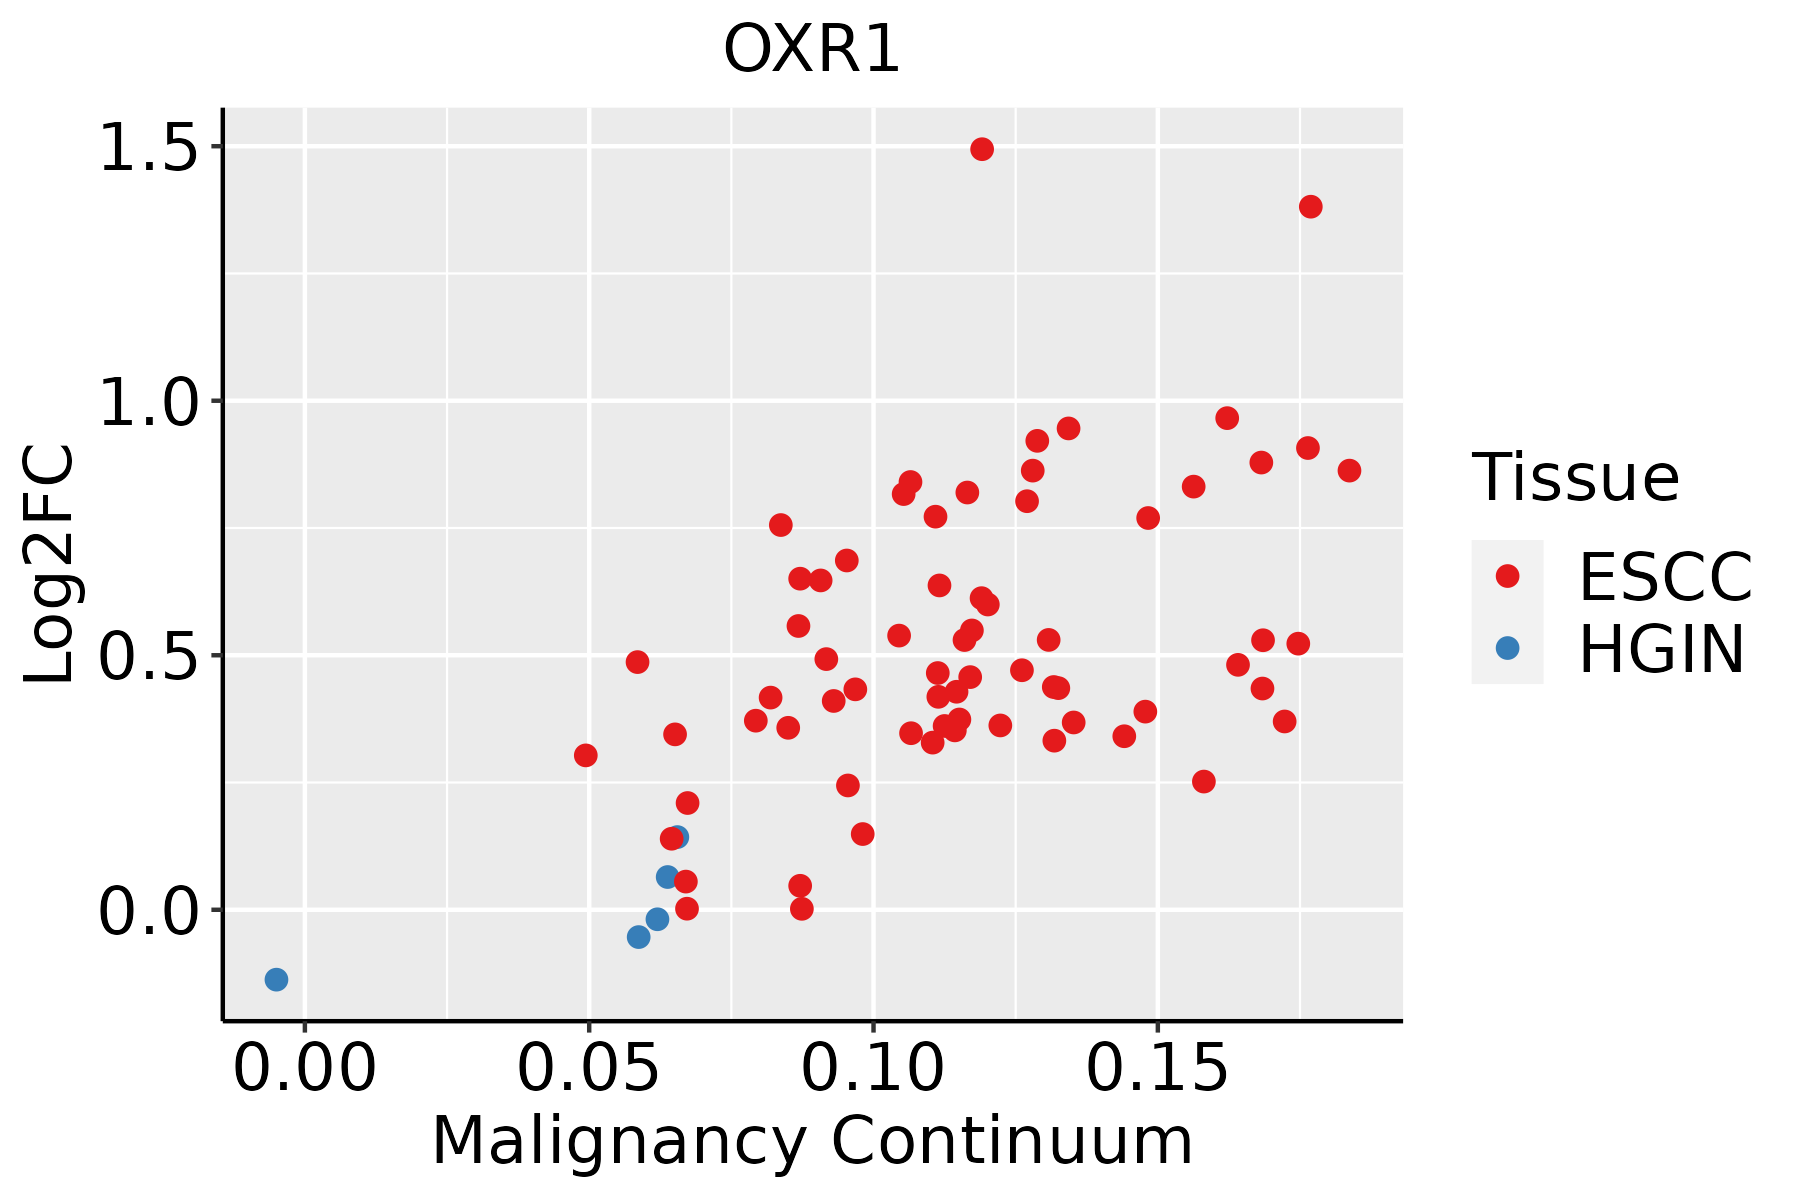
ESCC: Esophageal squamous cell carcinoma
HGIN: High-grade intraepithelial neoplasias
LGIN: Low-grade intraepithelial neoplasias
LiverThe image shows the transcriptomic changes along malignancy continuum.log2FC in expression of this searched gene in stem-like cells from each diseased tissue sample relative to stem-like cells in normal samples in each tissue plotted against the malignancy continuum. Samples are colored based on if they are from different disease stage.
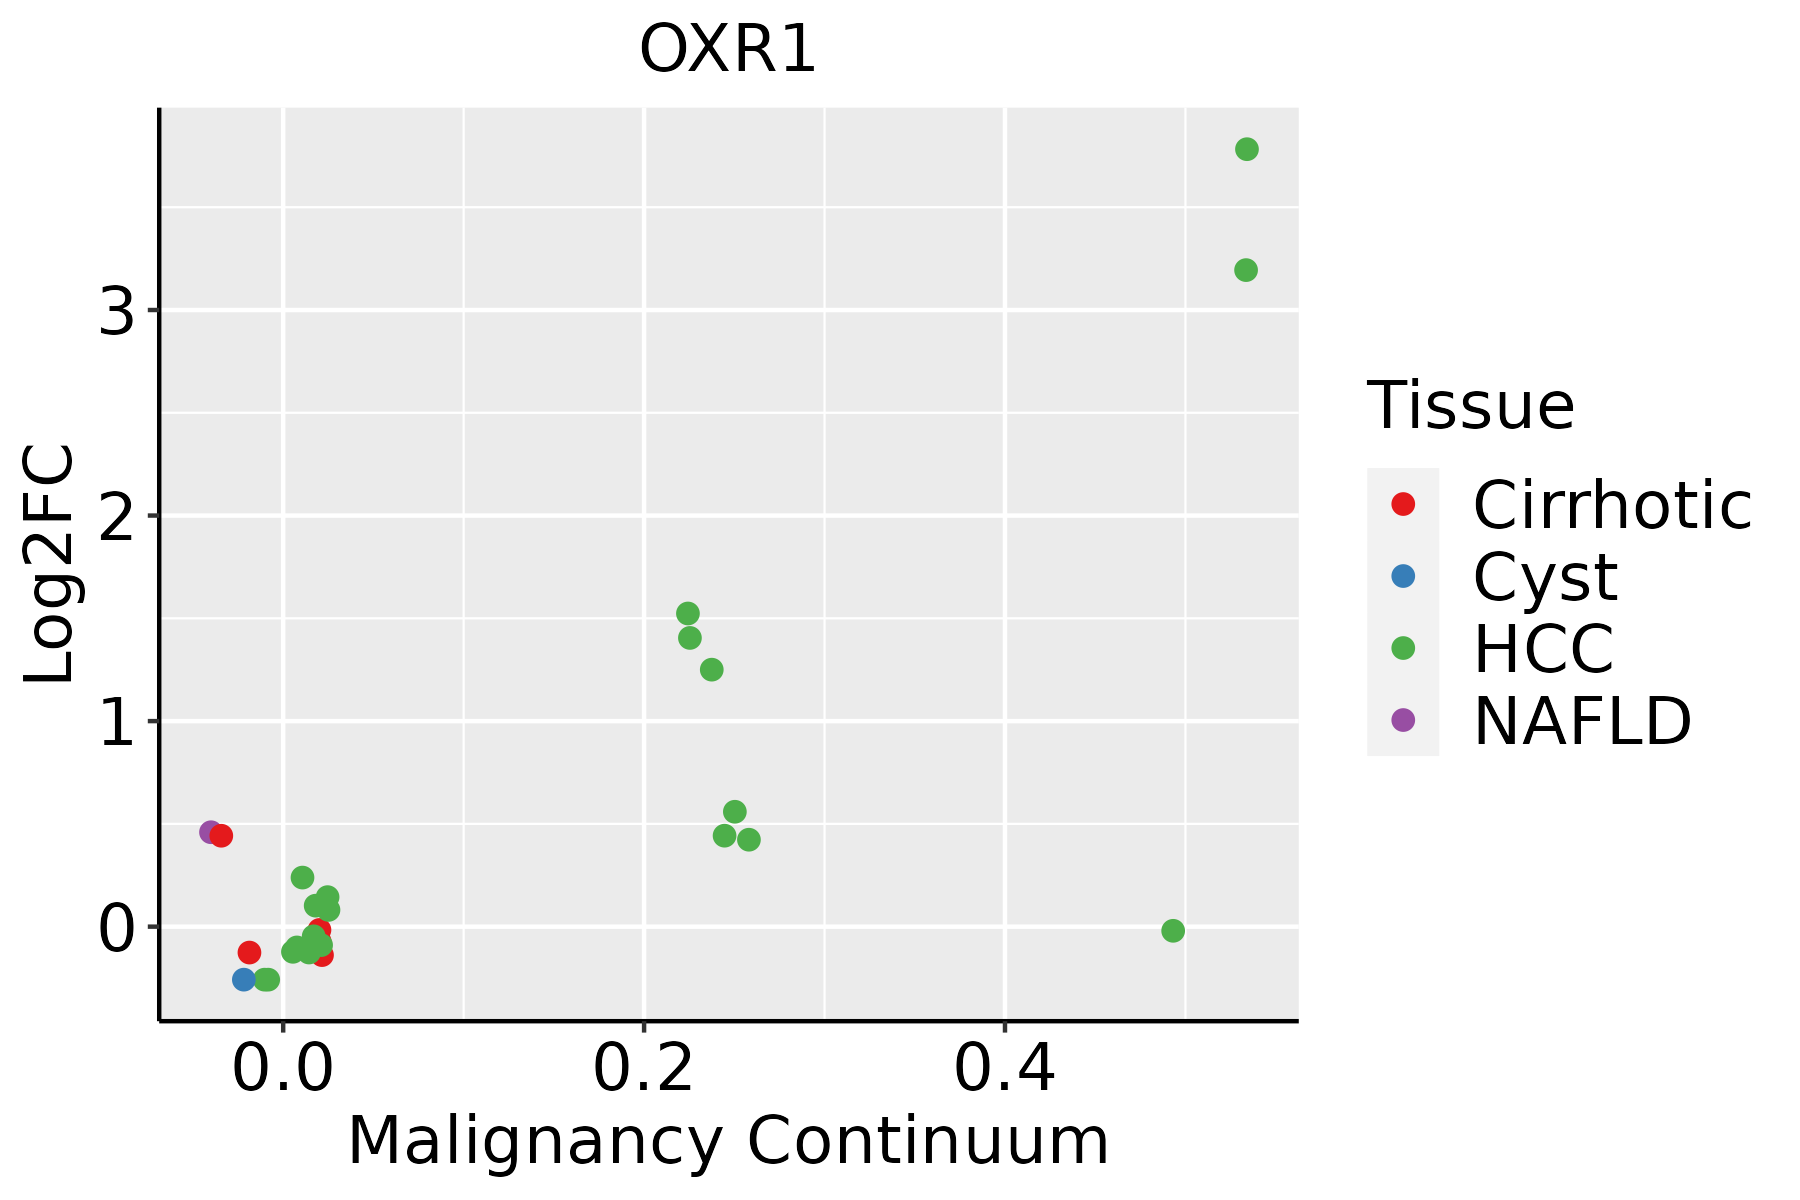
HCC: Hepatocellular carcinoma
NAFLD: Non-alcoholic fatty liver disease
LungThe image shows the transcriptomic changes along malignancy continuum.log2FC in expression of this searched gene in stem-like cells from each diseased tissue sample relative to stem-like cells in normal samples in each tissue plotted against the malignancy continuum. Samples are colored based on if they are from different disease stage.
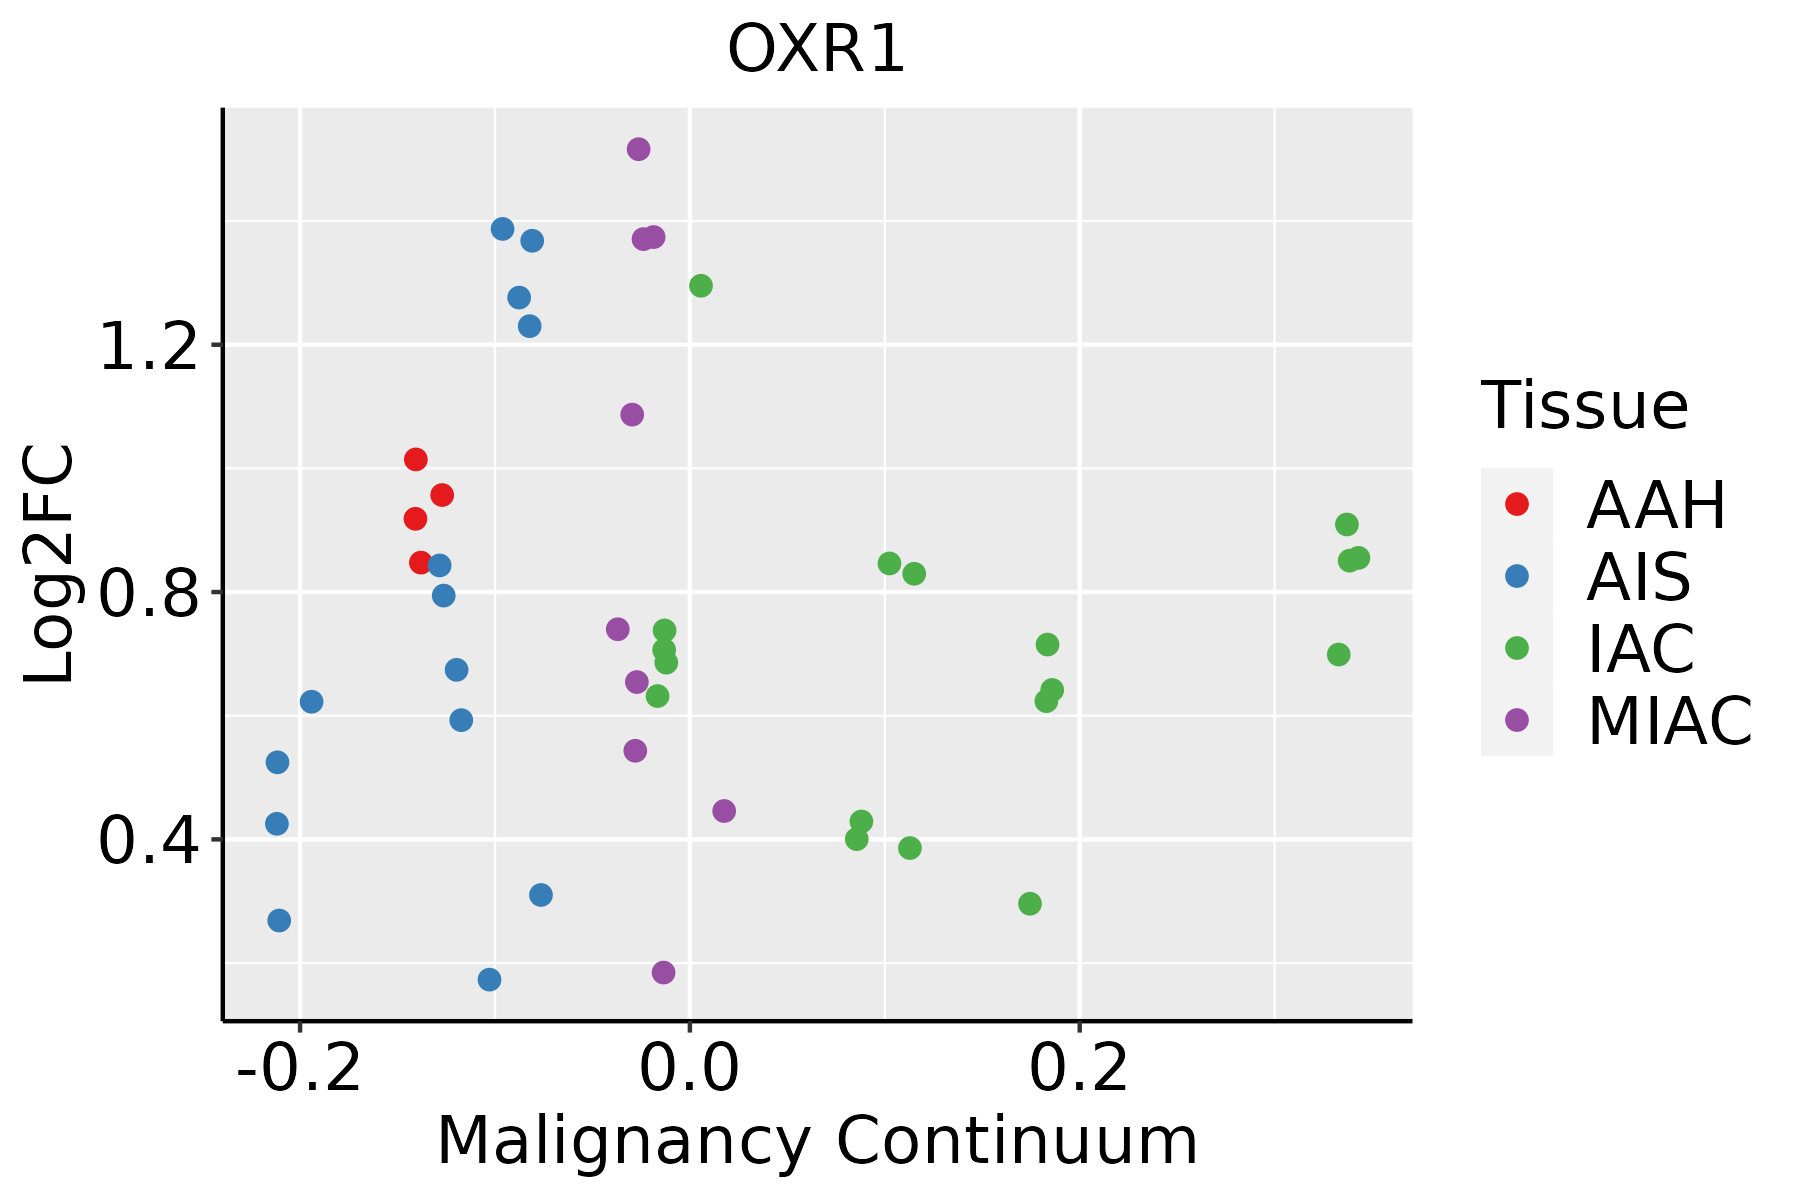
AAH: Atypical adenomatous hyperplasia
AIS: Adenocarcinoma in situ
IAC: Invasive lung adenocarcinoma
MIA: Minimally invasive adenocarcinoma
Oral CavityThe image shows the transcriptomic changes along malignancy continuum.log2FC in expression of this searched gene in stem-like cells from each diseased tissue sample relative to stem-like cells in normal samples in each tissue plotted against the malignancy continuum. Samples are colored based on if they are from different disease stage.EOLP: Erosive Oral lichen planus
LP: leukoplakia
NEOLP: Non-erosive oral lichen planus
OSCC: Oral squamous cell carcinoma
ProstateThe image shows the transcriptomic changes along malignancy continuum.log2FC in expression of this searched gene in stem-like cells from each diseased tissue sample relative to stem-like cells in normal samples in each tissue plotted against the malignancy continuum. Samples are colored based on if they are from different disease stage.
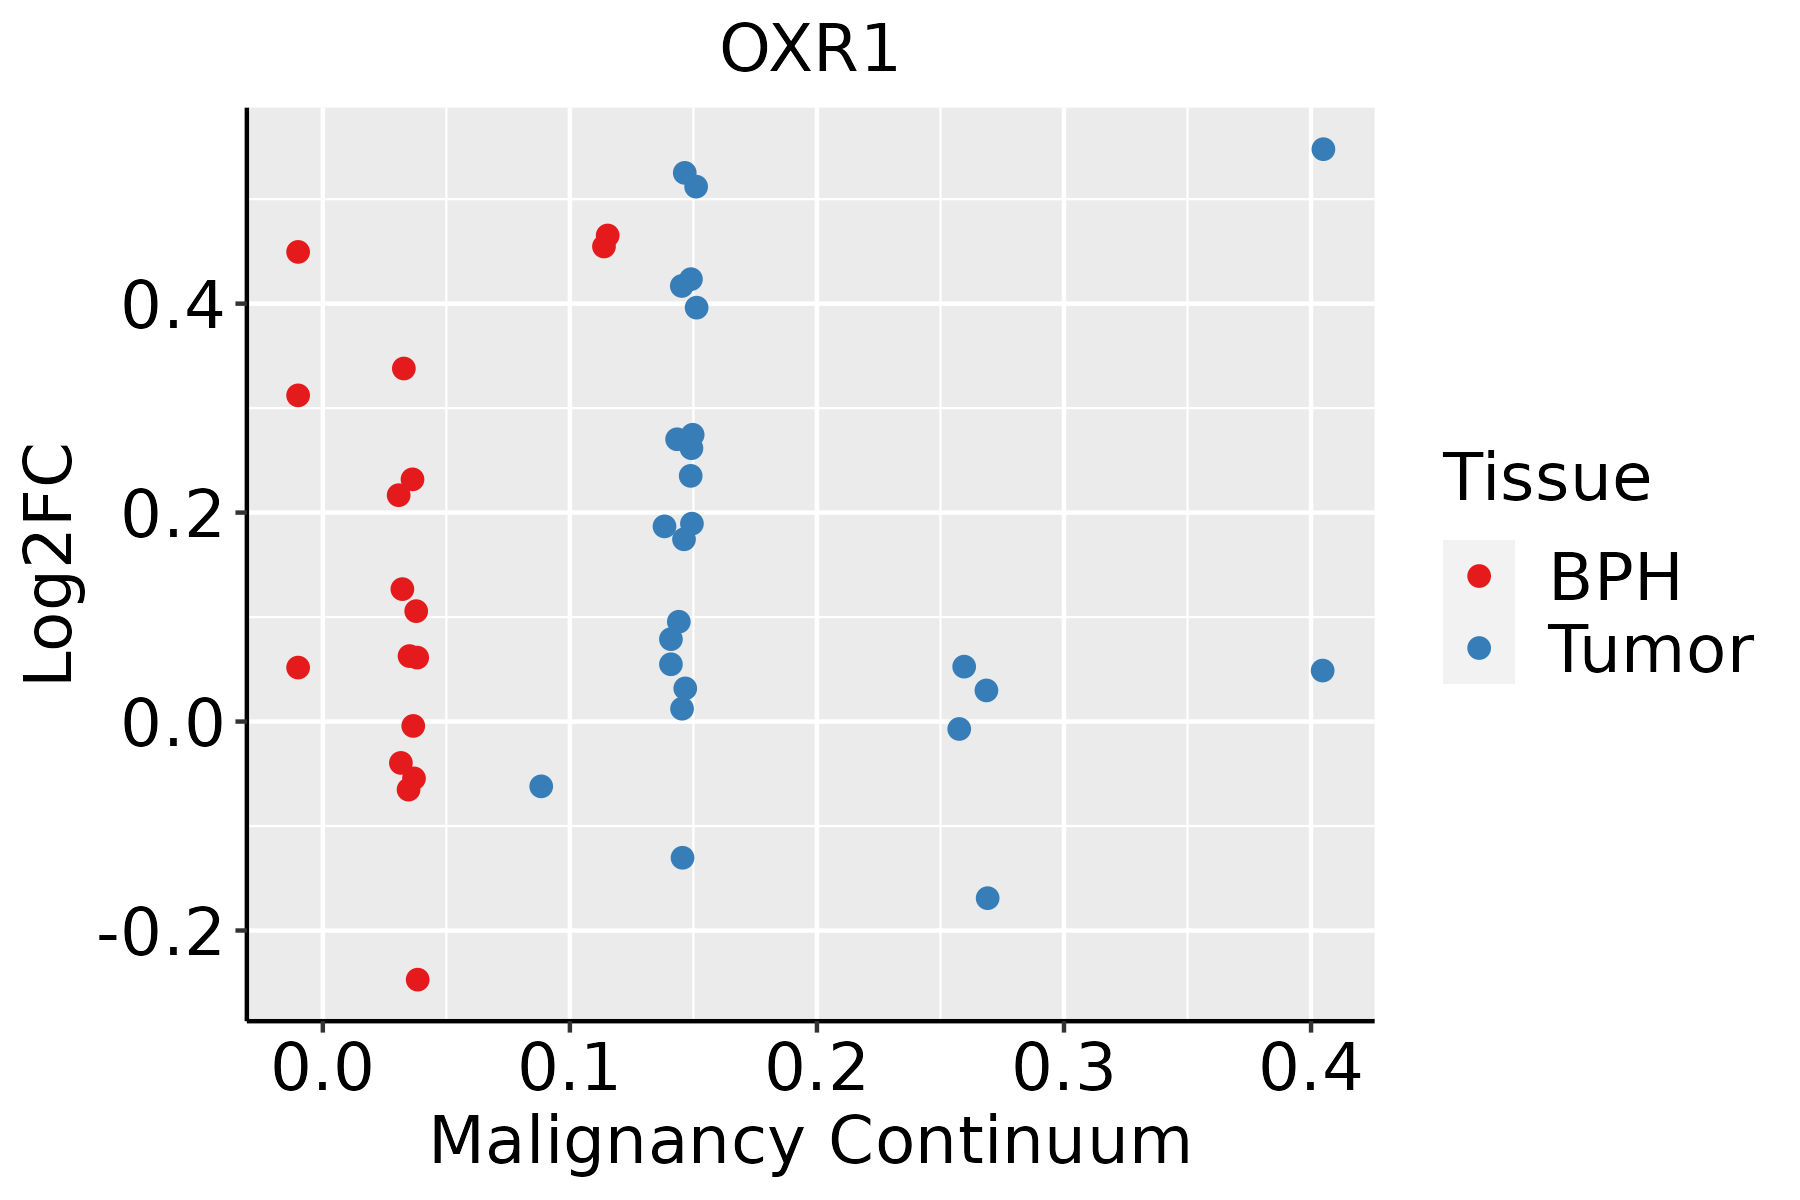
BPH: Benign Prostatic Hyperplasia
ThyroidThe image shows the transcriptomic changes along malignancy continuum.log2FC in expression of this searched gene in stem-like cells from each diseased tissue sample relative to stem-like cells in normal samples in each tissue plotted against the malignancy continuum. Samples are colored based on if they are from different disease stage.
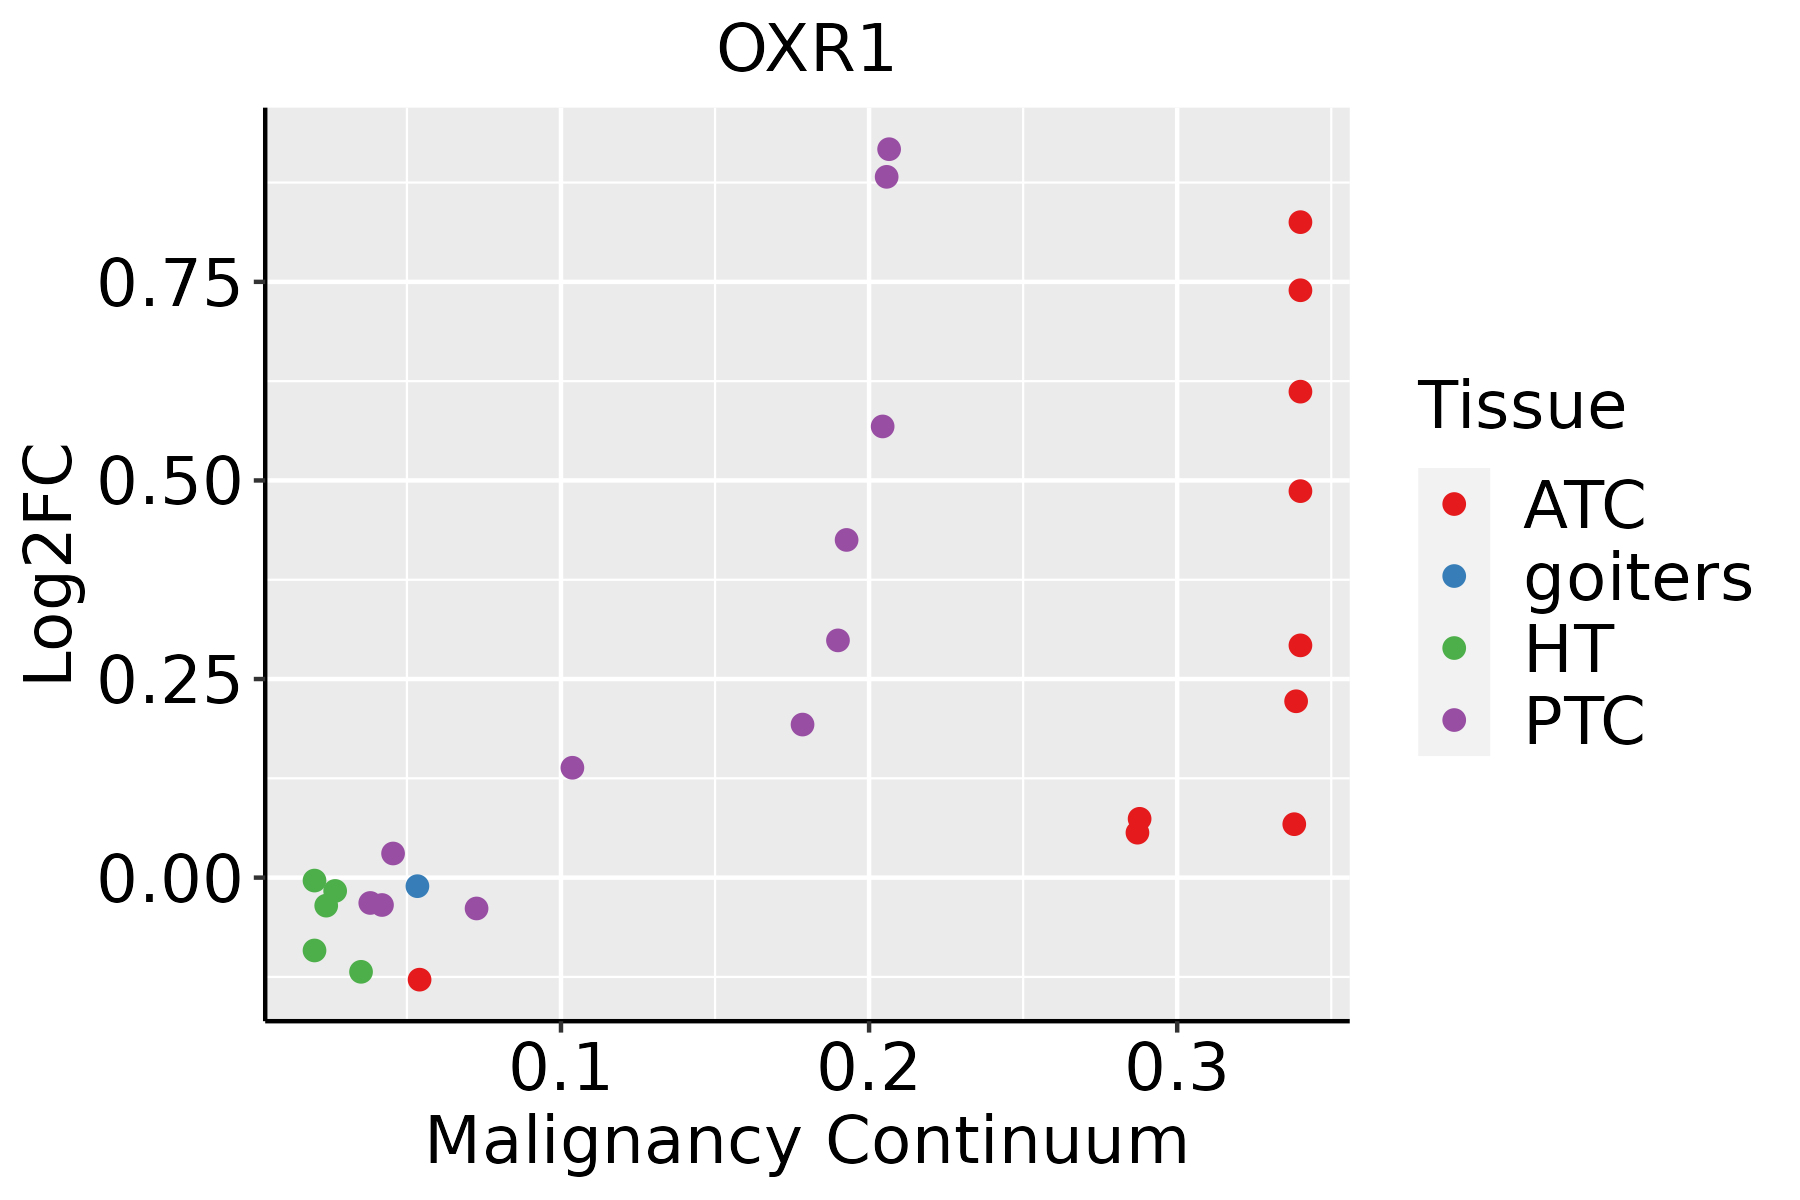
ATC: Anaplastic thyroid cancer
HT: Hashimoto's thyroiditis
PTC: Papillary thyroid cancer
∗log2FC in expression of this searched gene in stem-like cells from each diseased tissue sample relative to stem-like cells in normal samples in each tissue plotted against the malignancy continuum. Samples are colored based on if they are from different disease stage.

Top

Malignant transformation related pathway analysis

check buttonFind out the enriched GO biological processes and KEGG pathways involved in transition from healthy to precancer to cancer
check button Figure of enriched GO biological processes.
TissueDisease StageEnriched GO biological Processes
ColorectumADGO analysis - Figure of enriched GO biological processes: Top 15 enriched GO BP terms are showed in the bar plot of each disease state in each tissue. Each row represents a significant GO biological process which is colored according to the -log10(p.adjust).
ColorectumSERGO analysis - Figure of enriched GO biological processes: Top 15 enriched GO BP terms are showed in the bar plot of each disease state in each tissue. Each row represents a significant GO biological process which is colored according to the -log10(p.adjust).
ColorectumMSSGO analysis - Figure of enriched GO biological processes: Top 15 enriched GO BP terms are showed in the bar plot of each disease state in each tissue. Each row represents a significant GO biological process which is colored according to the -log10(p.adjust).
ColorectumMSI-HGO analysis - Figure of enriched GO biological processes: Top 15 enriched GO BP terms are showed in the bar plot of each disease state in each tissue. Each row represents a significant GO biological process which is colored according to the -log10(p.adjust).
ColorectumFAPGO analysis - Figure of enriched GO biological processes: Top 15 enriched GO BP terms are showed in the bar plot of each disease state in each tissue. Each row represents a significant GO biological process which is colored according to the -log10(p.adjust).
∗Top 15 enriched GO BP terms are showed in the bar plot of each disease state in each tissue. Each row represents a significant GO biological process which is colored according to the -log10(p.adjust).
Page: 1 2 3 4 5 6 7 8 9 

check button Enriched GO biological processes.
GO IDTissueDisease StageDescriptionGene RatioBg Ratiopvaluep.adjustCount
GO:19032017LiverCirrhoticregulation of oxidative stress-induced cell death33/463474/187231.51e-041.45e-0333
GO:00364755LiverCirrhoticneuron death in response to oxidative stress17/463431/187233.19e-042.77e-0317
GO:19004077LiverCirrhoticregulation of cellular response to oxidative stress36/463489/187237.79e-045.73e-0336
GO:00435242LiverCirrhoticnegative regulation of neuron apoptotic process51/4634145/187233.15e-031.78e-0251
GO:19032027LiverCirrhoticnegative regulation of oxidative stress-induced cell death22/463453/187235.36e-032.73e-0222
GO:19028827LiverCirrhoticregulation of response to oxidative stress36/463498/187235.44e-032.77e-0236
GO:19032035LiverCirrhoticregulation of oxidative stress-induced neuron death13/463427/187237.07e-033.41e-0213
GO:19032046LiverCirrhoticnegative regulation of oxidative stress-induced neuron death10/463419/187238.23e-033.83e-0210
GO:000697922LiverHCCresponse to oxidative stress281/7958446/187239.75e-191.24e-16281
GO:006219722LiverHCCcellular response to chemical stress216/7958337/187236.86e-165.44e-14216
GO:003459922LiverHCCcellular response to oxidative stress183/7958288/187233.65e-131.93e-11183
GO:007099722LiverHCCneuron death202/7958361/187231.44e-072.70e-06202
GO:190121412LiverHCCregulation of neuron death179/7958319/187235.65e-079.01e-06179
GO:005140212LiverHCCneuron apoptotic process135/7958246/187235.64e-055.26e-04135
GO:004352312LiverHCCregulation of neuron apoptotic process117/7958212/187231.25e-041.03e-03117
GO:190121512LiverHCCnegative regulation of neuron death113/7958208/187233.68e-042.54e-03113
GO:003647511LiverHCCneuron death in response to oxidative stress22/795831/187231.27e-036.92e-0322
GO:003647312LiverHCCcell death in response to oxidative stress55/795895/187231.76e-039.12e-0355
GO:190288212LiverHCCregulation of response to oxidative stress55/795898/187234.46e-031.93e-0255
GO:190040712LiverHCCregulation of cellular response to oxidative stress50/795889/187236.33e-032.58e-0250
Page: 1 2 3 4 5 6 7 8 9 10 11 12 13 14 15 16 

check button Enriched KEGG pathways.
Pathway IDTissueDisease StageDescriptionGene RatioBg Ratiopvaluep.adjustqvalueCount
Page: 1 

Top

Cell-cell communication analysis

check buttonIdentification of potential cell-cell interactions between two cell types and their ligand-receptor pairs for different disease states
LigandReceptorLRpairPathwayTissueDisease Stage
Page: 1 

Top

Single-cell gene regulatory network inference analysis

check buttonFind out the significant the regulons (TFs) and the target genes of each regulon across cell types for different disease states
TFCell TypeTissueDisease StageTarget GeneRSSRegulon Activity
∗The dot plots of a searched regulon are shown for all cell subpopulations in each disease state of each tissue based on the regulon specific score inferred using pySCENIC and by calculating the average expression.
Page: 1 

Top

Somatic mutation of malignant transformation related genes

check buttonAnnotation of somatic variants for genes involved in malignant transformation
Hugo SymbolVariant ClassVariant ClassificationdbSNP RSHGVScHGVSpHGVSp ShortSWISSPROTBIOTYPESIFTPolyPhenTumor Sample BarcodeTissueHistologySexAgeStageTherapy TypesDrugsOutcome
OXR1SNVMissense_Mutationnovelc.819N>Ap.Met273Ilep.M273IQ8N573protein_codingtolerated(0.12)benign(0.068)TCGA-A2-A4S3-01Breastbreast invasive carcinomaFemale<65I/IIUnknownUnknownSD
OXR1SNVMissense_Mutationrs528049194c.1985G>Ap.Arg662Hisp.R662HQ8N573protein_codingdeleterious(0.01)benign(0.07)TCGA-AC-A62V-01Breastbreast invasive carcinomaMale<65III/IVTargeted Molecular therapydenosumabPD
OXR1SNVMissense_Mutationrs140427774c.364N>Ap.Glu122Lysp.E122KQ8N573protein_codingtolerated(0.74)possibly_damaging(0.904)TCGA-AN-A046-01Breastbreast invasive carcinomaFemale>=65I/IIUnknownUnknownSD
OXR1SNVMissense_Mutationc.1368N>Tp.Glu456Aspp.E456DQ8N573protein_codingtolerated(0.42)benign(0.003)TCGA-AN-A046-01Breastbreast invasive carcinomaFemale>=65I/IIUnknownUnknownSD
OXR1SNVMissense_Mutationnovelc.1859N>Ap.Gly620Aspp.G620DQ8N573protein_codingdeleterious(0.04)probably_damaging(0.965)TCGA-AN-A046-01Breastbreast invasive carcinomaFemale>=65I/IIUnknownUnknownSD
OXR1SNVMissense_Mutationnovelc.2063N>Gp.Asn688Serp.N688SQ8N573protein_codingtolerated(0.13)benign(0.043)TCGA-AN-A046-01Breastbreast invasive carcinomaFemale>=65I/IIUnknownUnknownSD
OXR1SNVMissense_Mutationc.1958N>Tp.Glu653Valp.E653VQ8N573protein_codingdeleterious(0)probably_damaging(0.999)TCGA-AO-A0J5-01Breastbreast invasive carcinomaFemale<65III/IVOther, specify in notesBisphosphonatezoledronicPD
OXR1SNVMissense_Mutationrs149485264c.584N>Ap.Arg195Glnp.R195QQ8N573protein_codingtolerated(0.11)possibly_damaging(0.856)TCGA-AO-A128-01Breastbreast invasive carcinomaFemale<65I/IIChemotherapydoxorubicinSD
OXR1SNVMissense_Mutationc.479T>Gp.Val160Glyp.V160GQ8N573protein_codingtolerated(0.27)benign(0.063)TCGA-AQ-A04H-01Breastbreast invasive carcinomaFemale<65III/IVChemotherapytaxotereSD
OXR1SNVMissense_Mutationc.913A>Cp.Thr305Prop.T305PQ8N573protein_codingtolerated(0.34)benign(0.001)TCGA-AQ-A04J-01Breastbreast invasive carcinomaFemale<65I/IIChemotherapycytoxanSD
Page: 1 2 3 4 5 6 7 8 9 10 11 12 13 

Top

Related drugs of malignant transformation related genes

check buttonIdentification of chemicals and drugs interact with genes involved in malignant transfromation
(DGIdb 4.0)
Entrez IDSymbolCategoryInteraction TypesDrug Claim NameDrug NamePMIDs
Page: 1